
Abstract
BACKGROUND AND PURPOSE: Dynamic susceptibility contrast MR perfusion imaging has limited results in children due to difficulties in reproducing technical standards derived from adults. This prospective, multicenter study aimed to determine DSC feasibility and quality in children using custom administration of a standard dose of gadolinium.
MATERIALS AND METHODS: Eighty-three consecutive children with brain tumors underwent DSC perfusion with a standard dose of gadobutrol administered by an automated power injector. The location and size of intravenous catheters and gadobutrol volume and flow rates were reported, and local and/or systemic adverse effects were recorded. DSC was qualitatively evaluated by CBV maps and signal intensity–time curves and quantitatively by the percentage of signal drop and full width at half-maximum, and the data were compared with the standards reported for adults. Quantitative data were grouped by flow rate, and differences among groups were assessed by analysis of covariance and tested for statistical significance with a t test.
RESULTS: No local or systemic adverse events were recorded independent of catheter location (63 arm, 14 hand, 6 foot), size (24–18 ga), and flow rates (1–5 mL/s). High-quality CBV maps and signal intensity–time curves were achieved in all patients, and quantitative evaluations were equal or superior to those reported for adults. No significant differences (P ≥ .05) were identified among the higher-flow-rate groups in the quantitative data.
CONCLUSIONS: A custom administration of a standard dose of gadobutrol allows safe and high-quality DSC MR perfusion imaging in children.
ABBREVIATIONS:
- FWHM
- full width at half maximum
- GBCA
- gadolinium-based contrast agent
- PSD
- percentage of signal drop
Dynamic susceptibility-weighted contrast-enhanced perfusion MR imaging provides hemodynamic information complementary to traditional structural MR imaging. Currently, DSC perfusion is routinely used in clinical practice to diagnose, manage, and investigate brain tumors in adult patients. DSC-derived cerebral blood volume maps can provide quantitative estimation of relative CBV that can be used to grade gliomas, differentiate brain tumor types, and distinguish tumors from non-neoplastic lesions.1 The noninvasive character of DSC perfusion, susceptibility for microvascular hemodynamic alterations, short acquisition times, lack of ionizing radiation, and the current widespread availability of MR imaging scanners make DSC-PWI ideally suited for children.2 However, performing DSC MR perfusion in pediatric patients can be challenging due to several technical issues: the need to use a power injector and difficulties in obtaining proper venous access (18–20 ga), reaching a high-flow injection rate (5 mL/s), and guaranteeing patient immobility. These limitations discourage the use of DSC-PWI in children, and most pediatric neuroradiologists still prefer manual injection of contrast medium. It is well-known that DSC imaging relies on the rapid acquisition of as many images as possible during the passage of the contrast media through the brain to measure the degree of T2/T2* signal changes with time and that it needs magnetic susceptibility contrast agents to be injected as a narrow bolus by a power injector because high intravascular concentrations of gadolinium are required for T2-weighted magnetic susceptibility effects to dominate image contrast.
This prospective, bicenter study (Fondazione Policlinico Universitario A. Gemelli Istituto di Ricovero e Cura a Carattere Scientifico, Roma, Foundation Istituto di Ricovero e Cura a Carattere Scientifico, Ca' Granda Ospedale Maggiore Policlinico, Milan) therefore aimed to determine the feasibility and safety of DSC MR perfusion imaging in children and to assess DSC perfusion quality using a “custom child” administration of a standard dose of gadolinium-based contrast agent (GBCA) (0.1 mmol/kg of gadobutrol, Gadovist; Bayer Schering Pharma, Berlin, Germany), defined as the use of a power injector at lower flow rates (1–5 mL/s) and by various venous accesses (18–24 ga) and locations (arm, foot, hand), with or without sedation. We compared the results obtained in children with the DSC quality standards reported in the literature for adults, considered the state of the art.
To our knowledge, this is the first study to evaluate the feasibility, safety, and quality of DSC-PWI in pediatric patients.
Materials and Methods
Study Population
The local ethics committee approval was obtained at both sites for this prospective, bicenter study. A supplementary approval was obtained to extend the age of inclusion following the label extension in the European Union for diagnostic use of gadobutrol in pediatric patients younger than 2 years of age, including term neonates. Written informed consent was provided for each pediatric participant by the parent or legal guardian. Eighty-three consecutive pediatric patients (6 months to 16 years of age; mean age, 8.15 ± 4.7 years) from 2 centers were enrolled from February 2015 to October 2017. All patients had a diagnosis of previously untreated intra-axial brain tumor. Sedation was performed in patients younger than 6 years of age.
DSC Imaging Protocol
DSC perfusion MR images were obtained during the first pass of a gadobutrol bolus with 1.5T or 3T MR imaging scanners (Signa Excite and EchoSpeed; GE Healthcare, Milwaukee, Wisconsin; and Achieva, Philips Healthcare, Best, the Netherlands, respectively) using a gradient-echo EPI sequence (TR = 1500–2250, TE = 35–45 ms, flip angle = 35°–90°, NEX = 1, matrix size = 128 × 128, section thickness = 4–5 mm, gap = 0.4–0.5 mm). A total of 60 image volumes were acquired, and the first 10 acquisitions were obtained to establish a precontrast baseline before starting the contrast agent injection. A standard contrast medium dose of 0.1 mmol/kg of body weight was injected followed by a 10–20 mL saline flush. Various peripheral intravenous catheters (18-, 20-, 22-, or 24-ga), locations (hand, arm, or foot), and flow-rates (1–5 mL/s) were used, depending on the age of the patient and the availability/site of venous access. Automated contrast agent and saline administration was performed using a power injector (Medrad® Spectris Solaris® EP; MedRad, Indianola, Pennsylvania) in all examinations. Choices of venous access, catheter size, and flow rate included the direct supervision of a physician (anesthesiologist and/or neuroradiologist) to provide the safe administration of contrast and aiming to obtain a compact bolus. The catheter site was checked at the end of imaging and 24 hours after MR imaging, and adverse events were recorded.
DSC Image Processing
Perfusion and conventional MR imaging data were transferred from MR imagers to an independent personal computer for qualitative and quantitative perfusion analysis. Perfusion parametric maps were obtained using the dedicated software package nordicICE (NordicNeuroLab, Bergen, Norway). Realignment was performed to minimize patient motion during dynamic scanning, and relative CBV maps were generated using an established tracer kinetic model applied to first-pass data.3,4
To reduce recirculation effects, we fitted concentration-time course curves to a γ-variate function to approximate the first-pass response as it would appear in the absence of recirculation. The dynamic curves were corrected mathematically to reduce the effect of contrast agent leakage, as described previously,5 and the relative CBV was computed by numeric integration of the curve after eliminating recirculation and contrast agent leakage.
DSC Data Evaluation Part 1: Qualitative Analysis
Qualitative analysis was performed by 2 fully independent and blinded readers, a neuroradiologist with >10 years of experience in neuro-MR imaging and a third-year radiology resident. Each reader evaluated the relative CBV maps from each examination in a fully randomized order in terms of global image quality and the adequacy of differentiation between white and gray matter. As previously described,6 each reader evaluated CBV perfusion color maps by scoring the visibility of the insular ribbon, basal ganglia, and internal capsule on a scale of 1–5 according to the following criteria: 1, no, not visible or not distinguishable from surrounding tissue; 2, poor, barely distinguishable from surrounding tissue; 3, moderate, visible but unclear delineation from surrounding tissue; 4, good, visible with acceptable delineation from surrounding tissue; and 5, excellent, easily visible with sharp delineation from the surrounding tissue.
Arterial bolus quality was then evaluated using the 5-grade scale (no, poor, moderate, good, excellent) previously reported by Tombach et al6 on the basis of signal intensity–time curves derived from ROIs placed in the lenticular nucleus of the unaffected side. The scale enabled an integrated assessment of the shape of the curve, the steepness of the signal intensity decrease, the bolus width (wide or narrow), the signal intensity loss, the smoothness of the curve (smooth or jagged), and the presence of a second-pass enhancement peak. Interreader agreement was assessed for each qualitative evaluation.
DSC Data Evaluation Part 2: Quantitative Analysis
Quantitative analysis was performed using signal intensity–time curves derived from ROIs positioned on the lenticular nucleus and frontal white matter of the unaffected side.7 ROIs of at least 30 mm2 were generally used and were placed by a third neuroradiologist with >10 years' experience in neuro-MR imaging and at least 5 years' experience in DSC-MR imaging. The percentage of signal drop (PSD) from pre- to postcontrast and the full width at half maximum (FWHM) were determined from each signal intensity–time curve for each ROI, as reported in Essig et al.7
Statistical Analysis
The descriptive analysis included age, weight, quantity of contrast agent, flow rate, catheter gauge, and catheter site. The distribution of the continuous variables was assessed by the Shapiro-Wilk test, which showed a normal distribution of the considered variables.
Qualitative and quantitative data have been compared with the DSC quality standards reported in the literature for adults: approximately 30%–40% signal drop and 6–7 seconds of FWHM.7 Interreader agreement was assessed with the Cohen κ test for the qualitative evaluation. For the quantitative data, Pearson correlations were used to assess relationships between PSD and FWHM and parameters such as age, weight, quantity of contrast agent, flow rate, and catheter gauge and site; a 1-way ANOVA with logistic analysis was performed to compare the PSD and FWHM with these parameters.
Quantitative data were separated into 2 groups by flow rates for statistical analysis (low-flow group: flow rates from 1 to 3 mL/s; high-flow group: flow rates 4 and 5 mL/s), and differences between flow rate groups were evaluated by analysis of covariance and tested for statistical significance with a t test for paired samples.
Quantitative data were also divided into 3 groups by age (group 1: 0–6 years of age; group 2: 6–12 years of age; group 3: 13–16 years of age), and differences between male and female sex in each group were tested by a t test for paired samples. A P value < .05 was considered statistically significant.
Results
Seventy-six patients were imaged on the 1.5T system, and 7, on the 3T system. The locations for the intravenous catheters were the arm (63/83), hand (14/83), and foot (6/83), and the gauges used were 18 ga (9/83), 20 ga (42/83), 22 ga (24/83), and 24 ga (8/83). The mean weight of the patients was 33.18 ± 17.26 kg, and gadobutrol volume ranged from 1 to 7 mL (mean, 3.36 ± 1.722 mL). Flow rates ranged from 1 to 5 mL/s: 5 mL/s in 8 patients, 4 mL/s in 46 patients, 3 mL/s in 18 patients, 2 mL/s in 8 patients, 1 mL/s in 3 patients. Thirty-three patients received sedation, and all were 6 years of age or younger. No access site–related or systemic complications were detected at the end of imaging or 24 hours later. High-quality CBV maps (minimum value, 4) and signal intensity–time curves (minimum value 3) were achieved in all examinations, with very good interobserver agreement for CBV maps (κ = 0.756) and good agreement for signal intensity–time curves (κ = 0.724) (On-line Table).
Most quantitative evaluations obtained in the lenticular nucleus were equal-to-superior compared with data for adults reported in the literature: The mean PSD was 41.42% ± 8.063% (range, 29%–70%) and mean FWHM was 6.171 s ± 1.254 s (range, 3.2–9.6) (On-line Table). The lowest flow rate was 1 mL/s in 3 patients and resulted in a mean PSD of 31.66%, 7.233-second mean FWHM, and a very high qualitative score for the CBV map and curve (On-line Table). The lenticular FWHM was above the threshold of 7 seconds in 20 patients (Fig 1). Quantitative evaluations obtained in the frontal white matter showed a lower mean PSD (22.12% ± 6.53%; range, 12%–37%) and a higher mean FWHM (6.833 ± 1.254; range, 3.8–9.5).

Scatterplot of the PSD and FWHM distribution in the study population. Dotted lines indicate the threshold values of 30% for PSD (A) and 7 seconds for FWHM (B).
In both the lenticular nucleus and frontal white matter, no significant difference (P ≥ .05) was found between quantitative FWHM and different flow-rate groups at 1–5 mL/s (Fig 2A). Among the different flow-rate groups, a significant difference (P = .037) in the PSD was found between 1 and 3 mL/s in the lenticular nucleus (Fig 2B). A difference in the PSD was also found in the frontal white matter between the 1- and 3-mL/s flow-rate groups, but the result was slightly above statistical significance (P = .059). No significant differences (P ≥ .05) were found in the PSD and FWHM among the high (4–5 mL/s) and low (1–3 mL/s) flow-rate groups, and no significant relationships were found between the PSD and age, sex, weight, flow rate, catheter gauge, and quantity of contrast agent. Significant correlations were found between the lenticular FWHM and age (P = .028), weight (P = .015), and quantity of contrast agent (P = .012). In the 0- to 6-year-old group, boys showed a significantly higher lenticular FWHM (P = .013), while in the 13- to 16-year-old group, girls showed higher lenticular FWHM (P = .017) (Fig 3).
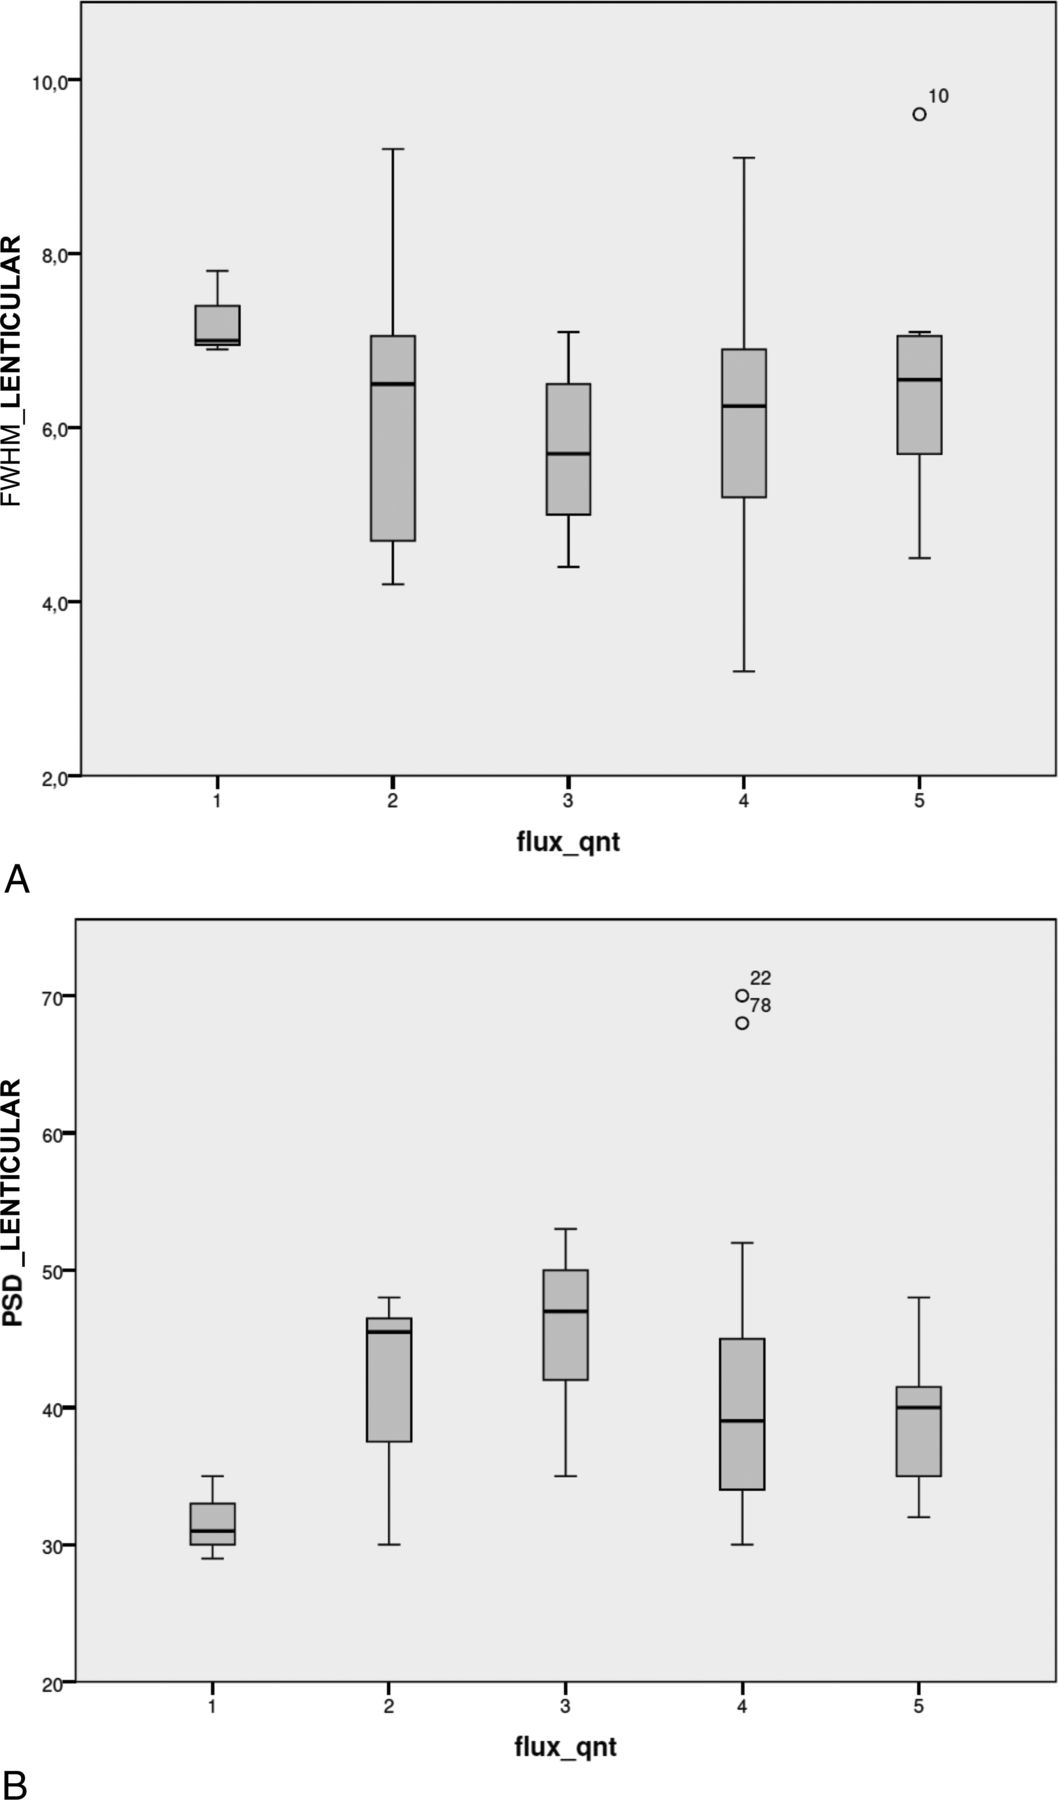
Boxplot of lenticular FWHM (A) shows no significant correlation with flow rate. Boxplot of lenticular PSD (B) shows a significant difference between the 1- and 3-mL/s groups.

Boxplot of lenticular FWHM shows a significant correlation with sex the 0- to 6-year-old (A) and 13- to 16-year-old (B) groups.
Discussion
The diagnosis of pediatric brain tumors is almost always based on patient age, tumor location, and conventional neuroimaging findings. However, additional goals for brain MR imaging for pediatric brain tumors should include differentiating specific tumor types, grading tumors, distinguishing viable tumor from necrotic tissue, guiding stereotactic biopsy, and determining treatment responses. Perfusion MR imaging provides the degree of neovascularity/tumor angiogenesis and is extremely useful for tumor characterization, grading, and prognosis.
There are currently 3 available techniques for perfusion MR imaging: dynamic susceptibility contrast imaging, dynamic contrast-enhanced imaging, and arterial spin-labeling. Arterial spin-labeling is particularly easy, safe, and suitable for children due to the lack of exogenous contrast agent administration, but this technique is still gaining clinical acceptance. Both DSC and dynamic contrast-enhanced imaging need the same exogenous contrast agent (GBCA), with a universally accepted role in the characterization of brain tumors and mandatory administration in such clinicoradiologic scenarios, independent of patient age. A clear advantage of arterial spin-labeling is that CBF quantification is not affected by T1 and T2 leakage effects with blood-brain barrier disruption, but arterial spin-labeling can currently provide values of only CBF (relative and absolute), which showed a good correlation with DSC CBV. On the other hand, DSC imaging sets also contain information regarding the flow and permeability properties of the tumor microvascular system, and DSC provides several perfusion parameters, reported as useful in the assessment of pediatric brain tumors: percentage of signal recovery, pattern of contrast leakage, and time-to-maximum.8,9
DSC imaging is currently considered the standard perfusion MR imaging method for brain tumors and is far more commonly used in the clinical setting because of its relatively short imaging time and the wider availability of image-processing tools. However, DSC imaging is technically more challenging in children compared with adult patients because it requires high-flow contrast injection, a compact bolus, proper venous access (18–20 ga), and patient immobility according to the American Society of Functional Neuroradiology recommendations.10 Few studies report the use of DSC imaging in pediatric patients to date and often include confounding inclusion/exclusion criteria. Ho et al8,11 evaluated the utility of relative CBV data from DSC imaging for grading pediatric primary brain tumors but did not provide detailed information regarding injection rates or patient age. Our study is the first to systematically determine the feasibility, safety, and quality of DSC MR perfusion imaging in children, using a custom child administration of a standard dose of gadolinium (0.1 mmol/kg dose of gadobutrol; Gadovist). We first demonstrated the technical feasibility of DSC-PWI in children and considered that the technique remains within the estimated cost, does not need additional or particular tools, and will be profitable in terms of clinical information. We carefully analyzed the safety of MR perfusion examinations in children, and all were well-tolerated and without adverse effects, notably with respect to the intravenous administration of contrast material performed with a power injector and various flow rates. We accurately customized the contrast medium administration for each patient, because we know from experience that the size of the child affects venous access and the ability to meet the standard adult requirements. Our safety standards required that 1 member of the MR imaging team (neuroradiologist, nurse, anesthesiologist) obtain peripheral venous access or check the pre-existing venous access site when patients and their parents arrive at the MR imaging unit. The key step was the accurate determination of the best venous access, which specified the appropriate needle gauge and the subsequent contrast medium flow rate. The peripheral IV catheters were always checked before examination by applying 5–10 mL of saline solution and were evaluated for blood return, and the connective tubing was attached to 1 of the power injectors. A new peripheral venous access site was inserted if the IV catheter could not be adequately flushed with saline or if the patient experienced pain at the injection site when not sedated. All aspects of the examination were explained to the parents of the children before the study, including the use of venous access to inject a small volume of contrast medium, and this information was well-received by parents. We strongly believe that our safety standards, customized to each patient, allow DSC studies to be performed safely, with no extravasation or other local reactions/adverse effects recorded.
Finally, we analyzed and reported the DSC perfusion quality. We intentionally chose gadobutrol for its high relaxivity and high concentration. Values obtained for FWHM with gadobutrol were lower than those obtained with other less concentrated contrast agents,7 and although it has been reported that the reduced gadobutrol injection time did not show a positive effect on the bolus geometry in adults,12 we speculated that a reduced bolus volume and consequently reduced injection rate may be advantageous for the bolus profile in our pediatric population. The comparison or enlargement of our data with those of future studies is now possible and in line with these suggestions.
We achieved high-quality CBV maps and signal intensity–time curves in all patients, even with very low-flow injection rates such as 1–2 mL/s. A flow rate of 1 mL/s was effective in achieving good-quality maps and curves (respectively evaluated with the maximum score and rated as good or excellent by the 2 readers) in 3 patients between 5 and 7 months of age, with a mean PSD value (31.6%) that is considered appropriate for routine clinical studies7 and a mean FWHM only slightly higher than 7 seconds, but similar to others obtained with faster flow rates in our population. In addition, neither the PSD nor FWHM showed statistically significant differences for gray and white matter between the groups' high- and low-flow rates. This means that even performing DSC-PWI at a lower flow rate we achieved good perfusion data. We demonstrated that a compact contrast bolus is achievable even using lower flow rates, particularly for young-age and low-weight children, resulting in a good or excellent quality of the curve and a high PSD. A univocal explanation for the FWHM of >7 seconds in 20 patients was not fully identified, but the relatively higher FWHM did not negatively affect the image quality in these 20 patients, and only 1 (a patient with a flow rate of 1 mL/s) had a PSD slightly lower than the accepted threshold of 30%.
As expected, the PSD was higher for gray matter than for white matter, whereas the FWHM was lower.7
Only the FWHM of the lenticular nuclei correlated with age, weight, and, consequently, the amount of contrast medium. The reasons for the similar PSDs obtained despite different injection rates and the higher FWHM obtained with increasing age, weight, and contrast amount remain to be clarified. Multiple factors may compete with the contrast flow velocity in children and exert a greater power to narrow the contrast bolus. Faster heart rates, faster circulation, shorter distance to reach the brain, a smaller capillary bed of the lung, and smaller perfusion cross-sectional area in juvenile brains may reduce the general broadening of the bolus, leading to a bolus geometry similar to that obtained with the higher flow rates and volumes of contrast media in adults.2 It is also well-accepted that cerebral blood flow tends to decrease throughout childhood, reaching adult levels by the late teens.13 It should be assumed that the width of the curve (FWHM) is more influenced by the increase in the bolus distribution in the vascular tree than the PSD, with other parameters such as flow velocity being equal. In our population, the result of the highest PSD among the group with flow rates of 3 mL/s in gray matter (Fig 2B) is not completely clear; a larger population is needed to perform stronger statistical analyses among age-related groups. In adults, sex differences in cerebral perfusion have been reported, with women having higher CBF values than men, but the factors modulating this sex difference in perfusion remain unclear. In our population, girls showed a lower FWHM of gray matter in the 0- to 6-year-old group, but it was higher in the 13- to 16-year-old group (Fig 3). Differences in hematocrit and steroid hormone levels have been brought into play to explain the sex difference in adult cerebral perfusion,14,15 but more studies on pediatric brain perfusion are warranted to define a sex difference in brain hemodynamics and to better understand the biologic causes.
Sedation was always used in children younger than 6 years of age, and while some anesthetic agents used in pediatric anesthesia decrease CBF indirectly,16 no cases of low-quality DSC perfusion studies were recorded in our population. Moreover, the use of DSC MR perfusion does not significantly extend the duration of sedation because it lasts approximately 1–1.30 minutes. Ultimately, our effort was to determine that DSC is feasible in pediatric patients; thus, when the use of gadolinium is deemed clinically necessary, the gadolinium bolus can be used to obtain DSC perfusion with administration parameters suitable for pediatric populations. Gadolinium deposition in the brain after the use of gadolinium-based contrast agents has been documented extensively in the literature.17⇓–19 Brain deposition is most noticeable with linear agents in both adults and children, and at present, the GBCA gadobutrol seems less likely to deposit within the brain in comparison with other linear and macrocyclic GBCAs.18 Bjørnerud et al20 reported, in an adult population, an increased T1 signal intensity in the dentate nucleus after a very high number (>30) of administrations of gadobutrol, but in pediatric patients, this agent was not associated with the MR imaging evidence of brain deposition.21 However, while gadobutrol may be less likely to deposit within the brain in comparison with other GBCAs, in our study, we chose this contrast agent due only to its characteristics of high relaxivity and high concentration, because in early 2014, when we were planning this study, there was not yet scientific evidence of gadolinium deposition in the brain. Finally, to date, no detrimental impact of these depositions has been identified.
The primary limitation of the study is the small population, which does not allow the identification of factors that can influence the quality of perfusion images more than others. Therefore, DSC should be performed in a larger pediatric population to clarify the mechanisms behind the similar bolus geometry despite the different injection flow rates in children with respect to adults. Another limitation is the low number of perfusion studies obtained at 3T, which does not allow comparisons of the quality of perfusion at 1.5T and 3T. However, considering the high quality of perfusion that we achieved at 1.5T and that, in general, 3T provides a greater SNR,22 we can speculate that pediatric brain DSC perfusion at low-flow rates may benefit from higher field strengths.
With such a wide age range of patients, to homogenize our data and have similar acquisitions, we decided not to use a preload because the precise administration of a quarter dose of 1 mol of contrast for children weighing less than 10 kg meant being able to administer less than 0.2 mL. In adult populations, to reduce the so called “leakage effect,” we usually use a preload of one-quarter of the total dose, about 5–10 minutes before the DSC acquisition as well as postprocessing leakage-correction algorithms. Benefits of the use of preload administration are particularly evident in the presence of BBB disruption, which may cause an underestimation of the relative CBV,23 but in our population, quantitative data of DSC were measured in normal-appearing gray and white matter, where there was no evidence of alterations of the BBB. One of the limits of our study is the use of different flip angles, due to the different vendors and magnetic fields, while we used the same postprocessing leakage-correction algorithm.
Conclusions
This study provides support for the hypothesis that a custom child administration of a standard dose of gadobutrol allows safe and high-quality DSC perfusion MR imaging in a pediatric population. The feasibility and reliability of DSC-PWI in children argue for the inclusion of DSC in the routine clinical MR imaging protocol for pediatric brain tumors.
Footnotes
Disclosures: Cesare Colosimo—UNRELATED: Consultancy: Bracco.
References
- Received September 7, 2018.
- Accepted after revision December 1, 2018.
- © 2019 by American Journal of Neuroradiology


