
Abstract
BACKGROUND AND PURPOSE: Periventricular caps are a common finding on MR imaging and are believed to reflect focally increased interstitial water content due to dysfunctional transependymal transportation rather than ischemic-gliotic changes. We compared the quantitative water content of periventricular caps and microvascular white matter lesions, hypothesizing that periventricular caps associated with increased interstitial fluid content display higher water content than white matter lesions and are therefore differentiable from microvascular white matter lesions by measurement of the water content.
MATERIALS AND METHODS: In a prospective study, we compared the water content of periventricular caps and white matter lesions in 50 patients using a quantitative multiple-echo, gradient-echo MR imaging water-mapping sequence.
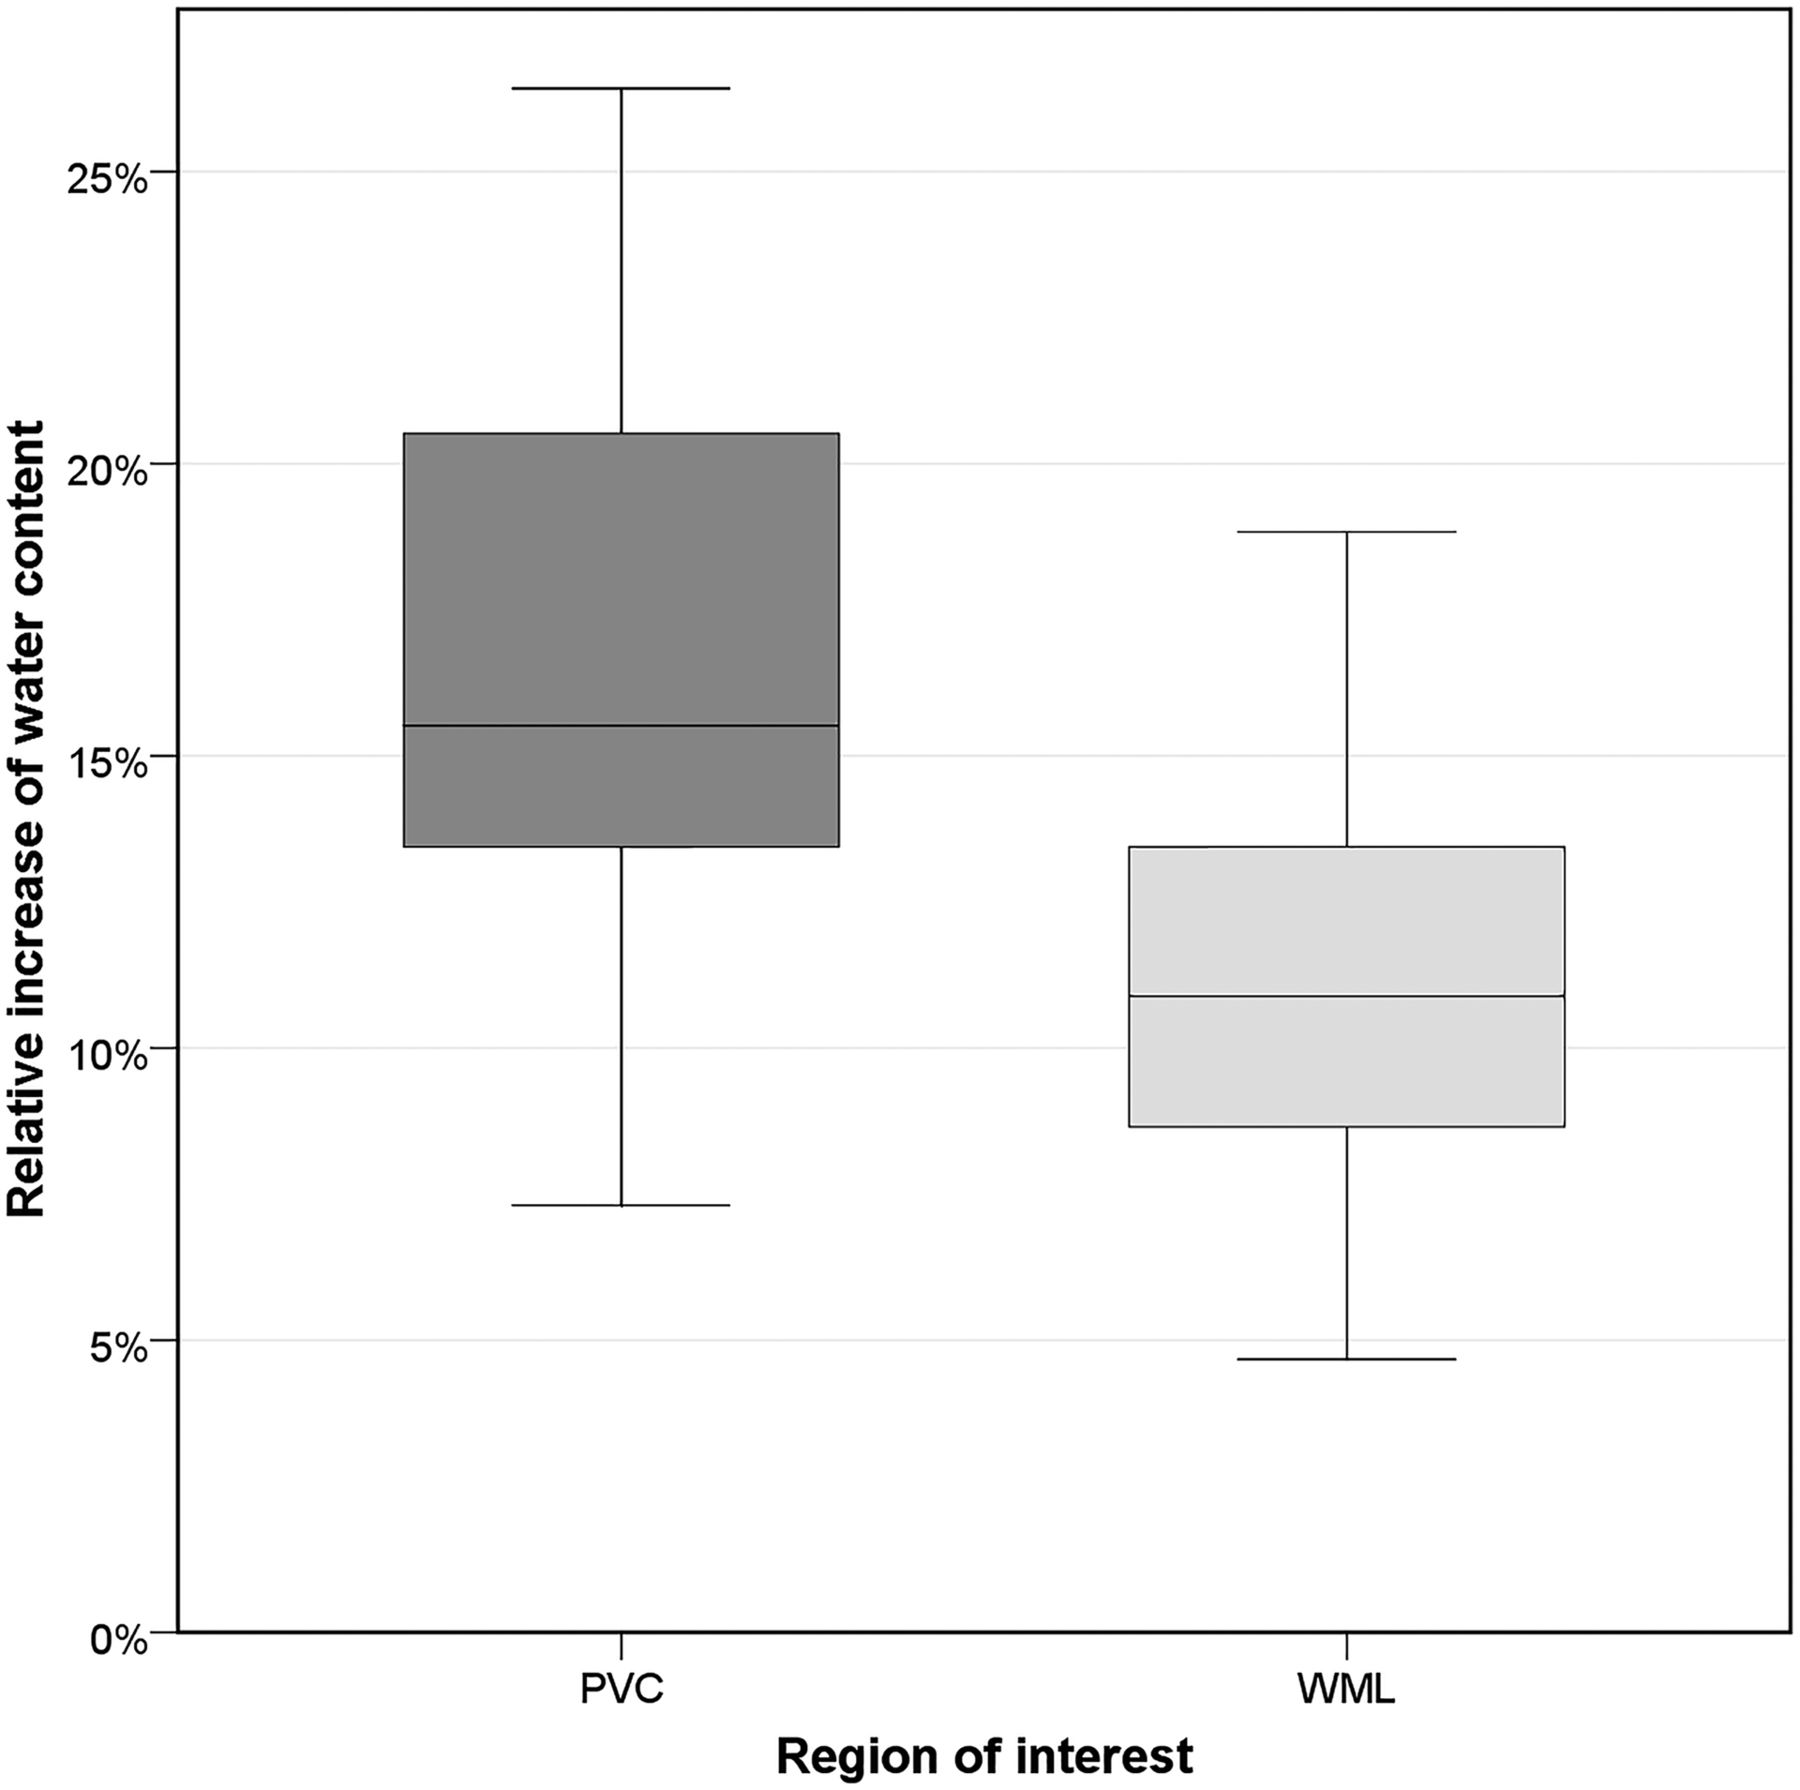
RESULTS: The water content of periventricular caps was significantly higher than that of white matter lesions (P = .002). Compared with normal white matter, the mean water content of periventricular caps was 17% ± 5% higher and the mean water content of white matter lesions was 11% ± 4% higher. Receiver operating characteristic analysis revealed that areas in which water content was 15% higher compared with normal white matter correspond to periventricular caps rather than white matter lesions, with a specificity of 93% and a sensitivity of 60% (P < .001). There was no significant correlation between the water content of periventricular caps and whole-brain volume (P = .275), white matter volume (P = .243), gray matter volume (P = .548), lateral ventricle volume (P = .800), white matter lesion volume (P = .081), periventricular cap volume (P = .081), and age (P = .224).
CONCLUSIONS: Quantitative MR imaging allows differentiation between periventricular caps and white matter lesions. Water content quantification of T2-hyperintense lesions may be a useful additional tool for the characterization and differentiation of T2-hyperintense diseases.
ABBREVIATIONS:
- iNPH
- idiopathic normal pressure hydrocephalus
- PVC
- periventricular cap
- WML
- white matter lesions
Periventricular caps (PVCs), smooth T2-hyperintense areas around the lateral ventricles (mostly the frontal and posterior horns, Fig 1), are a common finding on cranial MR imaging, especially in elderly patients. Pathologic studies have shown that PVCs do not correspond to ischemic-gliotic changes, but rather to an area of finely textured myelin associated with denudation of the ventricular ependymal lining.1 Because the ependyma provides a bidirectional barrier and transport system for CSF and interstitial fluid exchange, age-related ependymal denudation might impair normal transportation of interstitial fluid into the ventricles, leading to an accumulation of interstitial fluid, which converges from the surrounding white matter, around the frontal horns of both lateral ventricles.1 According to this theory, the increased T2 signal intensity in PVCs would reflect, at least in part, edematous rather than pure gliotic white matter changes. However, gliotic white matter changes caused by microvascular disease are also a frequent occurrence in the general population.2 Because conventional T2-weighted sequences do not allow one to differentiate between those 2 types of lesions, alternative imaging sequences are necessary to differentiate these 2 pathologies. Quantitative MR imaging allows the quantification of water content of brain lesions within a clinically acceptable acquisition time of a few minutes.3,4 For instance, it has been shown that quantitative water mapping allows one to detect an increase in cerebral water content in hepatic encephalopathy and to evaluate the surrounding edema in brain tumors.5,6

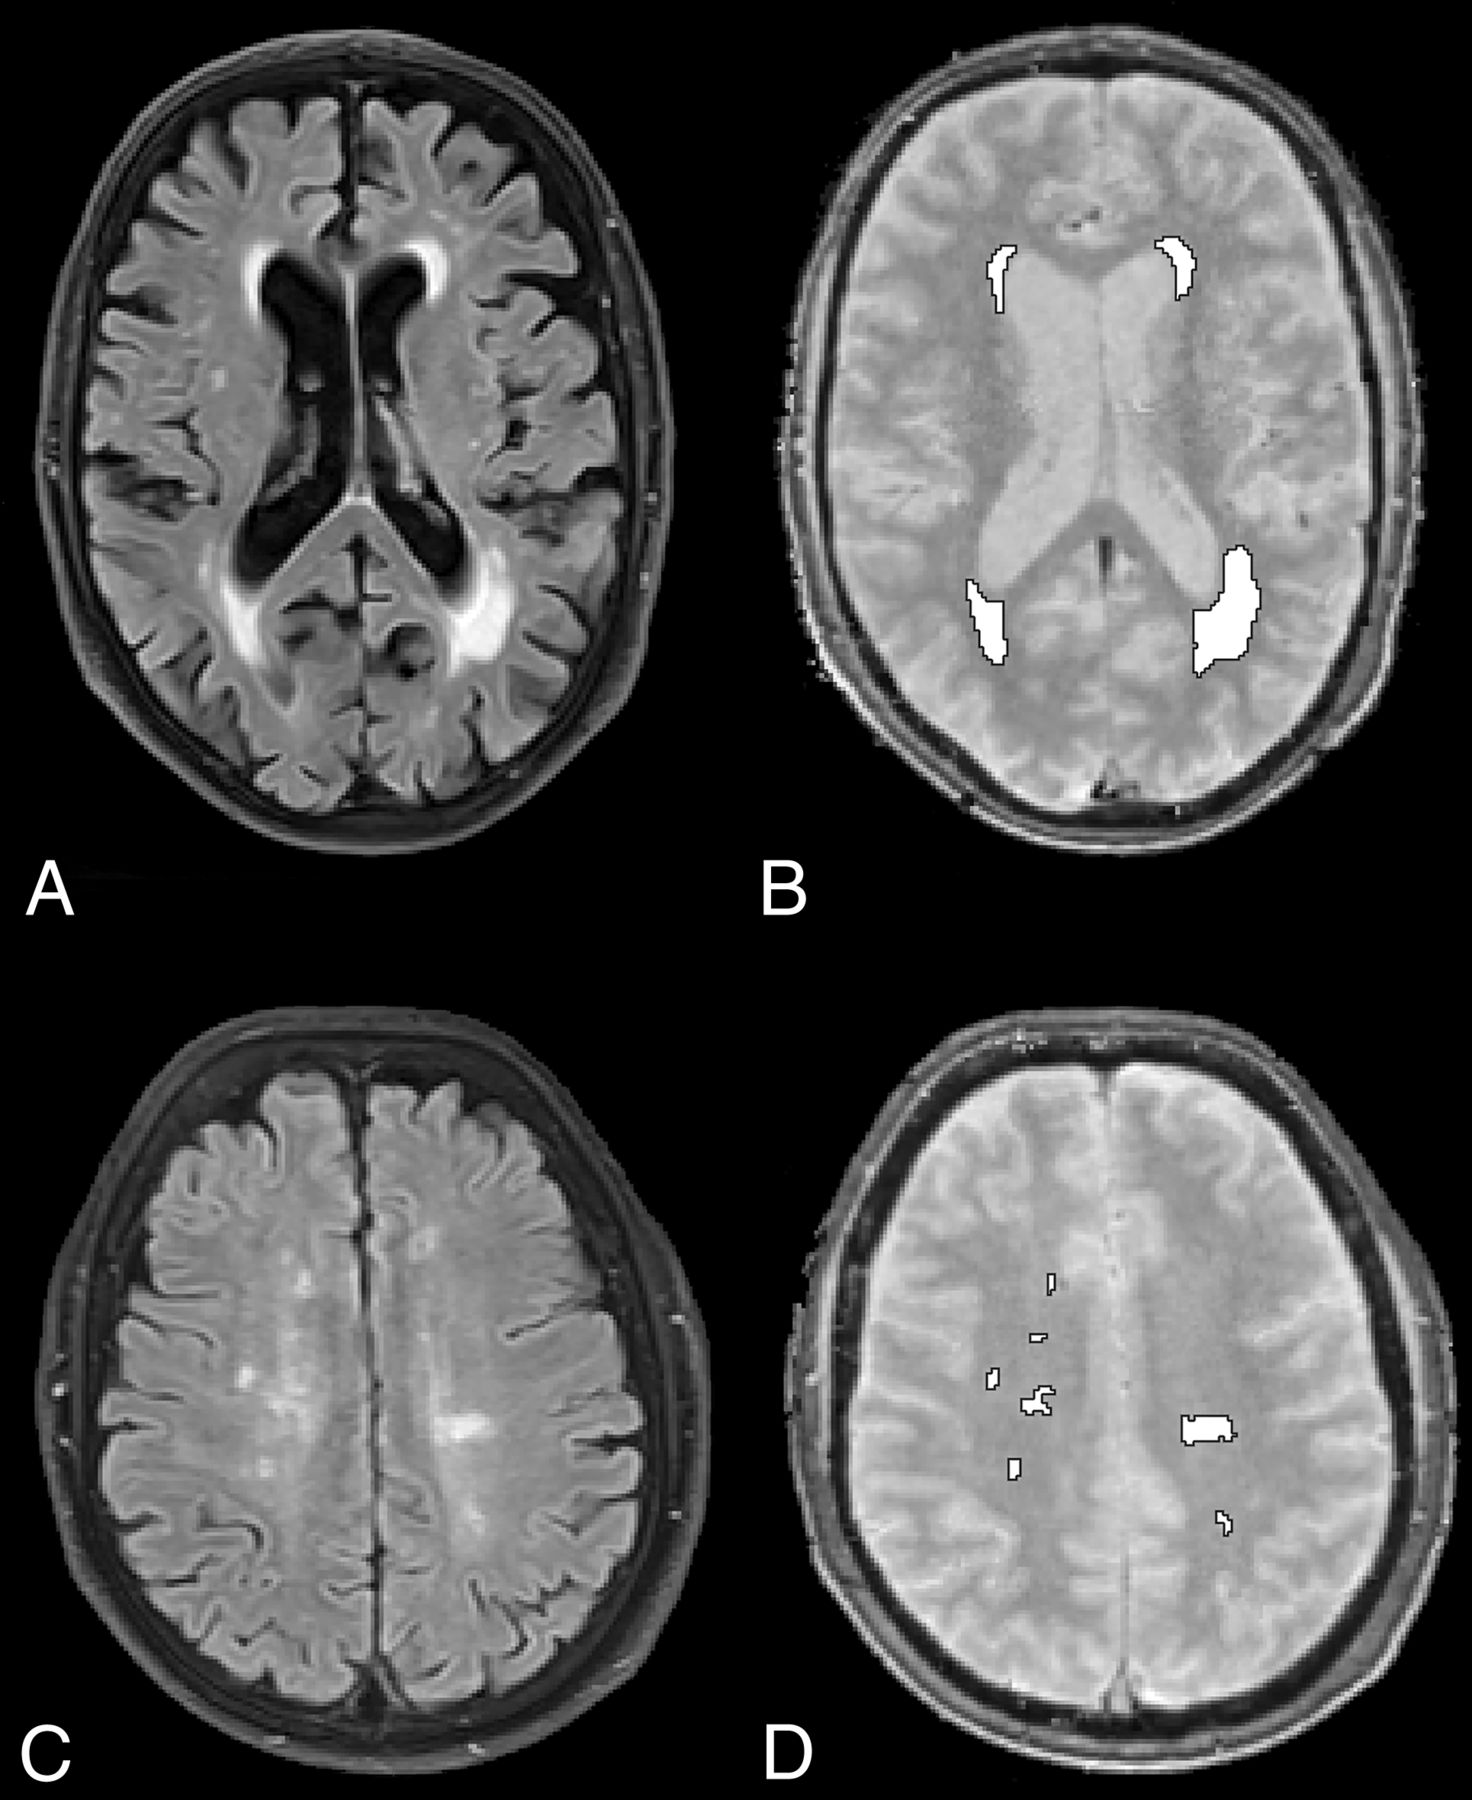
MR imaging acquisitions and segmentations. Exemplary T2-FLAIR (left) and water mapping (right) acquisitions and final segmentation (white ROIs). Periventricular caps (A and B) and gliotic white matter lesions (C and D) in 2 different patients.
We hypothesized that quantitative MR imaging allows differentiation between PVCs and microvascular white matter lesions (WML). Hence, the aim of this study was to investigate whether PVCs, representing interstitial fluid due to dysfunctional transependymal transportation, contain an increased water content compared with gliotic microvascular deep white matter lesions, using a quantitative water-mapping sequence.
Materials and Methods
After approval from our local ethics board (faculty of medicine, RWTH Aachen University), we prospectively scanned all patients who presented with neurovascular symptoms between May 2014 and February 2017 and who agreed to participate in our study (n = 177). For this analysis, we included all patients who had both PVCs and WML with a volume of at least .1 cm3. This cutoff was chosen to address lesions that are clearly assessable on clinical MR imaging with a typical slice thickness of 3–5 mm, thereby reducing partial volume effects on our measurements. We excluded patients with acute or subacute stroke adjacent to the investigated areas and patients with pathologies other than PVCs and WML, such as brain tumors or inflammation. This exclusion left 50 patients included in our study. No patient had clinical or radiologic signs of acute hydrocephalus or idiopathic normal pressure hydrocephalus (iNPH).
Our standard MR imaging protocol consisted, among others, of the following MR imaging sequences: DWI, FLAIR, T2*-weighted, T2-weighted (sagittal), and T1-weighted (coronal). All MR images were acquired on a 3T scanner (Magnetom Prisma; Siemens; Erlangen, Germany).
Specifications of our T2-FLAIR sequence were as follows: TR, 9000 ms; TE, 98 ms; flip angle, 150°; FOV, 230 mm; section thickness, 3 mm; matrix, 256 × 192; acquisition time, 3 minutes and 2 seconds.
For quantitative water content measurements, we used the manufacturer's 2D multiple-echo gradient-echo sequence acquired with TR = 5000 ms and a nominal flip angle of 25°. By using an acceleration factor for parallel imaging of integrated Parallel Acquisition Techniques (“iPAT” = 2), the acquisition time (TA) for whole-brain coverage was 4 minutes and 12 seconds. Other relevant parameters were the following: TE1, 3.34 ms; deltaTE, 2.85 ms; 12 echoes; resolution, 1 × 1 × 1.5 mm (50% slice gap); bandwidth, 510 Hz/px; partial Fourier factor, 6/8; number of slices, 84.3
Analysis
To delineate PVCs and WML, we used a semiautomatic segmentation approach to allow objective segmentation. Initially, we used the open-source deep learning framework DeepMedic (Version 0.6.1; https://biomedia.doc.ic.ac.uk/software/deepmedic/), which is used for automated segmentation, to segment the hyperintensities in the T2-FLAIR sequence.7 We trained the neural network with 30 cases of voxelwise manually annotated ROIs as “PVCs” and “WML,” depending on their morphology and location. We defined PVCs as smooth periventricular caps at the frontal and posterior horns of the lateral ventricles (grade 1 PVCs according to Thomas et al8), whereas irregular T2-hyperintense periventricular regions were not regarded as PVCs. WML were defined as patchy or confluent T2-hyperintense areas in the deep cerebral white matter. Areas where we could not clearly distinguish PVCs and WML were excluded altogether from our analysis. For our final analysis, 2 independent observers examined all segmented areas and adjusted the ROIs manually in a consensus reading, for example, to modify ROIs contiguous with the ventricles that could have been affected by partial volume effects. The final ROIs were then used in the water-mapping acquisitions to measure the quantitative water content of PVCs and WML. In addition, we investigated whether there was a gradient of water content from central periventricular white matter to more peripheral subcortical white matter by measuring 3 ROIs in the periventricular white matter, the centrum semiovale, and the subcortical white matter. Thus, we manually placed 3 respective ROIs in normal white matter on 1 axial slice adjacent to the examined T2 hyperintensities.
Statistical Analysis
After testing for data distribution with a Shapiro-Wilk test, we performed a paired Student t test to determine whether the water content between areas of PVCs and WML differed significantly. We conducted an ANOVA to assess whether there was a gradient between the central and peripheral water content. We performed a receiver operating characteristic analysis to determine the sensitivity and specificity of water content measurements for PVCs and WML distinction. We examined correlations between PVC water content and brain volume, lateral ventricle volume, lesion volume, and age using the Pearson correlation coefficient. Continuous parametric variables are presented as mean ± SD, and P values with an α level <.05 were considered statistically significant. All statistical analyses were calculated using the SPSS software package, Version 25 (IBM, Armonk, New York).
Results
The mean age of our 50 patients (21 women) was 74 ± 10 years (median, 74 years; range, 45–94 years). The average volume of the measured PVC ROIs was 2.3 ± 1.5 cm3 (median, 1.9 cm3; range, .6–7.3 cm3). The average volume of the measured white matter lesion ROIs was 4.6 ± 7.6 cm3 (median, 2.0 cm3; range, .2–46.3 cm3). The mean water content of healthy white matter was 69% ± 2% (median, 69.6%; range 65%–74%). There was no gradient between central and peripheral water content in healthy white matter, with a water content of 70% ± 3% (median, 70%; range, 65%–80%) in the periventricular white matter, 69% ± 2% (median, 69%; range, 64%–73%) at the centrum semiovale, and 69% ± 3% (median, 69%; range, 63%–74%) in the subcortical white matter (P = .122).
The absolute water content and the relative increase of water content of PVCs was significantly higher than that of WML (P = .002). The mean absolute water content in PVCs was 81% ± 2% (median, 81%; range, 77%–85%). The water content in PVCs was 17% ± 5% (median, 16%; range, 7%–26%) higher than that of normal white matter (Fig 2). The mean absolute water content in WML was 77% ± 2% (median, 77%; range, 71%–81%). The water content in WML was 11% ± 4% (median, 11%; range, 5%–19%) higher than that of normal white matter (Fig 2). The water content of PVCs was higher than that of WML in all patients. Lesion volume had no significant impact on water content in PVCs and WML (P = .953). Receiver operating characteristic analysis revealed that a 15% higher water content corresponded to PVCs rather than WML with a specificity of 93% and a sensitivity of 60% (P < .001, area under the curve = .842).

Relative increase of water content. The boxplot illustrates the relative increase of water content for periventricular caps and gliotic white matter lesions.
There was no significant correlation between the water content of PVCs and whole-brain volume (P = .275), white matter volume (P = .243), gray matter volume (P = .548), lateral ventricle volume (P = .800), WML volume (P = .081), PVC volume (P = .081), and age (P = .224).
Discussion
The microscopic nature of PVCs in patients without acute hydrocephalus is not fully understood. The literature suggests that PVCs might be secondary to dysfunctional transependymal transportation of interstitial fluid into the ventricles; thus, accordingly, it is expected that PVCs show higher water content compared with gliotic deep white matter lesions.1
In our study, we found that the water content of PVCs was indeed significantly higher than that of deep WML. Our receiver operating characteristic analysis revealed that a lesion with a 15% or higher water content compared with normal white matter corresponds to PVCs rather than deep WML, with an acceptable sensitivity and specificity. There was no significant correlation between the water content of PVCs and brain volume, lateral ventricle volume, lesion volume, and age. Because PVCs are located around the ventricles and WML are located peripherally, we investigated whether the water content difference was due to a water content gradient in healthy white matter with high water content in the periventricular areas and low content in the periphery. We assessed the water content in the respective regions and did not detect any such gradient, suggesting that the high water content in PVCs is, in fact, evidence of a histopathologic difference between deep WML and PVCs. Our study does not allow determining the exact pathophysiology of PVCs, in particular because our study lacks longitudinal imaging that could elucidate the etiology of PVCs. Hence, water content serves as a surrogate imaging marker that confirms pathologic studies that showed that there is increased water content accumulating from white matter surroundings or the intense venous network in this region.9,10 This work, therefore, serves as an in vivo validation of previous pathologic studies.
The results of this study may be translated to patients with iNPH and may help understand the pathophysiology of that disease: For instance, it is still unclear whether periventricular changes in patients with iNPH represent transependymal edema or ischemic gliosis. In fact, it has been suggested that iNPH is primarily driven by gliotic white matter infarction, which diminishes brain tissue compliance, especially because iNPH is associated with vascular risk factors such as diabetes and arterial hypertension.11⇓–13 On the other hand, abnormalities of CSF circulation are believed to be the primary cause of iNPH,14⇓–16 supported by the fact that clinical symptoms and the degree of white matter lesions improve in some patients after ventricular shunting, the latter possibly depending on whether these lesions were gliotic or edematous.17⇓–19 Theoretically, quantitative water mapping could be used in these patients to distinguish periventricular gliotic-ischemic from edematous white matter changes in an attempt to elucidate the underlying nature of these changes and eventually predict shunt-responsiveness.
Limitations
A major limitation of our study is the lack of an in vivo criterion standard for the distinction between gliotic and edematous T2 hyperintensities, which leads, to some extent, to a speculative interpretation of our data. In addition, it is not evident whether the presumably gliotic WML in our included patients are, in fact, caused by ischemia. To address this issue, we included only patients in whom microvascular ischemic gliosis was the most probable cause for their WML. Due to the study design, our study population consists solely of patients with neurovascular symptoms; inclusion of healthy, asymptomatic controls or patients presenting a wider range of symptoms would allow a better generalization of the findings. A strength of our study is the inclusion of patients with both PVCs and WML, which allows an intraindividual analysis. The fact that the water content of PVCs surpassed the water content of WML in every single patient underlines that averaging effects had no major impact on our results.
Conclusions
We found that the water content of periventricular caps was significantly higher than that of deep white matter lesions; the latter were most probably of microvascular origin. Our results show that a lesion with a 15% or higher water content compared with normal white matter corresponds to PVCs rather than WML. Inversely, this finding also implies that it is possible to use quantitative water mapping to distinguish gliotic white matter lesions from other T2-hyperintense lesions. Quantifying the water content of periventricular T2-hyperintense white matter changes may be a useful additional tool for the differentiation of T2 hyperintensities in iNPH or other diseases such as multiple sclerosis.
Footnotes
Disclosures: Martin Wiesmann—UNRELATED: Consultancy: Stryker Neurovascular; Grants/Grants Pending: Stryker Neurovascular*; Payment for Lectures Including Service on Speakers Bureaus: Bracco Imaging, Medtronic, Siemens, Stryker Neurovascular; Payment for Development of Educational Presentations: Abbott, ab medica, Acandis, Bayer Healthcare AG, Bracco Imaging, B. Braun Medical, Codman Neurovascular, Kaneka Pharma, Medtronic, Dahlhausen, MicroVention, Nvidia, Penumbra, phenox, Philips Healthcare, Route 92 Medical, Siemens, Silk Road Medical, St. Jude, Stryker Neurovascular.* *Money paid to the institution.
REFERENCES
- Received January 9, 2019.
- Accepted after revision March 11, 2019.
- © 2019 by American Journal of Neuroradiology


