
Abstract
BACKGROUND: The molecular profile of gliomas is a prognostic indicator for survival, driving clinical decision-making for treatment. Pathology-based molecular diagnosis is challenging because of the invasiveness of the procedure, exclusion from neoadjuvant therapy options, and the heterogeneous nature of the tumor.
PURPOSE: We performed a systematic review of algorithms that predict molecular subtypes of gliomas from MR Imaging.
DATA SOURCES: Data sources were Ovid Embase, Ovid MEDLINE, Cochrane Central Register of Controlled Trials, Web of Science.
STUDY SELECTION: Per the Preferred Reporting Items for Systematic Reviews and Meta-Analyses (PRISMA) guidelines, 12,318 abstracts were screened and 1323 underwent full-text review, with 85 articles meeting the inclusion criteria.
DATA ANALYSIS: We compared prediction results from different machine learning approaches for predicting molecular subtypes of gliomas. Bias analysis was conducted for each study, following the Prediction model Risk Of Bias Assessment Tool (PROBAST) guidelines.
DATA SYNTHESIS: Isocitrate dehydrogenase mutation status was reported with an area under the curve and accuracy of 0.88 and 85% in internal validation and 0.86 and 87% in limited external validation data sets, respectively. For the prediction of O6-methylguanine-DNA methyltransferase promoter methylation, the area under the curve and accuracy in internal validation data sets were 0.79 and 77%, and in limited external validation, 0.89 and 83%, respectively. PROBAST scoring demonstrated high bias in all articles.
LIMITATIONS: The low number of external validation and studies with incomplete data resulted in unequal data analysis. Comparing the best prediction pipelines of each study may introduce bias.
CONCLUSIONS: While the high area under the curve and accuracy for the prediction of molecular subtypes of gliomas are reported in internal and external validation data sets, limited use of external validation and the increased risk of bias in all articles may present obstacles for clinical translation of these techniques.
ABBREVIATIONS:
- AUC
- area under the curve
- DL
- deep learning
- MGMT
- O6-methylguanine-DNA methyltransferase
- ML
- machine learning
- SVM
- support vector machine
- WHO
- World Health Organization
- IDH
- isocitrate dehydrogenase
Gliomas account for approximately 33% of brain tumor diagnoses; among adults, >50% of these cases are high-grade gliomas.1,2 The 2021 World Health Organization (WHO) classification identified different forms of gliomas based on pathologic characteristics of biopsied or resected tumor and the molecular subtype.3 This method of diagnosis requires invasive sampling of the tumor, which risks surgery and the potential for tumor misclassification due to tumor heterogeneity with sampling bias.4,5 In addition, the inability to accurately predict tumor subtype before surgery can result in limited access to neoadjuvant therapies. Of note, the class of tumor affects a patient’s predicted survival as well as medical and surgical treatment options.3,6
Recent advancements in machine learning (ML) applications in neuro-oncology have shown promise in tumor segmentation,7,8 differentiating gliomas from other intracranial malignancies such as brain metastases9 and lymphomas,10 predicting glioma grade,11 and predicting the patient’s overall survival.12,13 Most of the published literature on applying ML to neuro-oncology demonstrates a high area under the curve (AUC) and accuracy in the internal testing data sets, but validation of algorithms on external data sets is limited to a very few studies. As a result, there is a limited translation of algorithms among different hospitals and study settings. In addition, previous systematic reviews have demonstrated that most of the literature is focused on small well-curated data sets with an over-representation of commonly used data sets, such as RSNA-ASNR-MICCAI Brain Tumor Segmentation (BraTS; https://www.kaggle.com/datasets/dschettler8845/brats-2021-task1) and The Cancer Imaging Archive (TCIA; https://wiki.cancerimagingarchive.net/display/Public/Collections).8⇓⇓⇓-12,14
This feature further limits translation of algorithms between different institutions. In addition, ML literature in neuro-oncology often scores low in established reporting guidelines such as Transparent Reporting of a Multivariable Prediction Model for Individual Prognosis Or Diagnosis (TRIPOD; https://www.equator-network.org/reporting-guidelines/tripod-statement/) and Checklist for Artificial Intelligence in Medial Imaging (CLAIM; https://pubs.rsna.org/doi/10.1148/ryai.2020200029) with high bias reported by the Prediction model Risk Of Bias ASsessment Tool (PROBAST).15⇓-17 These findings suggest that increased use of standardized reporting criteria in publications and the establishment of large databases of annotated images in individual hospitals are critically needed to translate useful algorithms into patient care and to bridge the gap between the diagnosis and targeted therapy. ML can potentially identify patterns that remain invisible to a radiologist’s clinical interpretation and can extract information from pretreatment imaging that can influence the implementation of neoadjuvant therapy and the extent of surgical resection.
Our study evaluated the literature that uses ML to predict molecular subtypes of gliomas, such as isocitrate dehydrogenase (IDH) mutation status and O6-methylguanine-DNA methyltransferase (MGMT) promoter methylation status, which can change treatment options for patients. As an example, IDH-mutant astrocytomas have better survival and different treatment options compared with glioblastomas that are uniformly IDH wild-type.3 Glioblastomas have dismal survival and require maximal resection to improve survival.18 Therefore, predicting IDH mutation on preoperative imaging can change the patient’s treatment strategy and outcomes. In addition, the prediction of MGMT methylation status can predict which patients will respond to temozolomide therapy and, therefore, would influence neoadjuvant options before resection.19 To guide medical care, the algorithm must have high precision and sensitivity and be translatable to multiple hospitals with different imaging protocols. The goal of our study was to critically evaluate the literature that reports different algorithms for predicting molecular subtypes of gliomas and to assess the potential obstacles to translating these algorithms into clinical practice.
MATERIALS AND METHODS
Study Selection
Literature screening for this systematic review conformed to the Preferred Reporting Items for Systematic Reviews and Meta-Analyses (PRISMA) guidelines, using Ovid EMBASE, Ovid MEDLINE, Cochrane Central Register of Controlled Trials, and the Web of Science Core Collection as databases. The study was registered with the Prospective Register of Systematic Reviews (PROSPERO, CRD42020209938). A clinical librarian collected data in September 2020, January 2021, and September 2021, respectively. The literature search strategy involved the use of keywords such as “artificial intelligence,” “machine learning,” “deep learning,” “radiomics,” “MR imaging,” “glioma,” “glioblastoma,” and related terms. We identified 12,470 studies (Fig 1A) and added them for further screening to the Covidence Software (Veritas Health Innovation).

A, Inclusion/exclusion criteria and resultant study data. Flow chart represents screening workflow and exclusion criteria to visualize the eligibility of studies. The search strategy included keywords “artificial intelligence,” “machine learning,” “deep learning,” “radiomics,” “MR imaging,” “glioma,” “glioblastoma,” and related terms. An independent librarian reviewed the data. We predefined 8 uniform exclusion criteria: 1) abstract-only, 2) no application of ML reported, 3) not an original article, 4) not published in English, 5) no investigation of glioma/glioblastoma, 6) unrelated to MR imaging, MR spectroscopy, or PET imaging, 7) no human research subjects, and 8) duplicates. B, Distribution of all patients per study included in training or validation of a predictive model. We excluded patients whose data were strictly used for models other than the prediction of molecular subtypes. The line indicates the mean number of patients. AI indicates artificial intelligence.
After removing 152 duplicates, a neuroradiology attending physician, a neuroradiology resident, and 3 graduate students screened 12,318 studies. Conflicting assessments were resolved by the board-certified neuroradiology attending physician after discussion with screeners. After abstract reviews, 10,995 studies were excluded due to a lack of ML and neuro-oncology applicability, resulting in 1323 full-text reviews. A secondary full-text review was conducted on 886 studies, by either a radiology resident or a graduate student, followed by a second review by a board-certified neuroradiologist attending physician.
We predefined 8 uniform exclusion criteria: 1) abstract-only, 2) no application of ML reported, 3) not an original article, 4) not published in English, 5) no investigation of glioma/glioblastoma, 6) unrelated to MR imaging, MR spectroscopy, or PET imaging, 7) no human research subjects, and 8) duplicates. Overall, 437 studies met ≥1 of the predefined exclusion criteria and were subsequently excluded (Fig 1A). In the end, for this systematic review, 85 studies were included that specifically analyzed molecular subtype prediction in glioma, using ML techniques based on pretherapy imaging. This resulted in 801 studies being excluded from further review.
Data Extraction
Data extraction was performed by 3 graduate students and 1 undergraduate in Excel (Microsoft 2022). Studies were reviewed twice, and disagreements were resolved in regular meetings with a supervising neuroradiology attending physician until a consensus was reached. Extracted information included article characteristics (title, authors, publication year), patient data (patient number, cohort sizes, data sources), tumor classification (tumor type, analyzed molecular subtypes), model characteristics (imaging data and best-performing ML algorithms), as well as validation techniques. Generally, accuracy results from the best-performing prediction pipeline were reported. If patient cohorts were split up within a study, different prediction results were reported. We accounted for the use of external validation if patient cohorts were geographically split. Data from the same source, solely split up by the time of inclusion, were classified as internal validation. To give more insight into the different validation types used, we split internal validation techniques into cross-validation and holdout-validation. For an overview of extracted data, see the Online Supplemental Data.
Meta-analysis
All studies reporting AUC and 95% confidence intervals were subjected to a meta-analysis using MedCalc for Windows, Version 20.009 (MedCalc software). Heterogeneity was examined using the Higgins I2 test, publication bias was evaluated using the Egger test, and the results of the quantitative analysis were illustrated with a forest plot (Online Supplemental Data).
Risk of Bias Assessment
Risk of bias was assessed using PROBAST.17 Per PROBAST guidelines, studies were classified into development, validation, or development and validation studies. All included studies established predictive models and, therefore, were at least considered development studies; those that additionally tested their developed model on an independent cohort were considered to have both development and validation.
PROBAST uses signaling questions across 4 distinct domains to evaluate potential biases in each study. The first domain (participants) pertains to the data sources and participant enrollment. The second domain (predictors) evaluates the definition and measurement of predictors and their association with the outcome. Domain 3 (outcome) addresses potential biases in defining and terminating the outcome in each study. Last, domain 4 (analysis) evaluates whether inappropriate analysis methods were used or important statistical considerations were overlooked.17 Additional information on the application of PROBAST can be found in the work of Moons et al,17 which is beyond the scope of this article. Signaling questions from each domain were assessed separately for development and validation cohorts. The average item scores from each study and the risk of bias for all 4 domains were evaluated using Excel (Microsoft).
RESULTS
After a full-text review of 886 studies, 85 studies published between 2016 and 2021 met the eligibility criteria of our analysis.
Patient Data
The mean patient number in all 85 studies was 165.32 (Fig 1B). Data were taken from single-center hospital data, public databases, or multicenter hospital data. The overall number of data sources included is higher than the total number of studies because 17 studies included patients from 2 sources, resulting in a total of 102 sources among the 85 studies. While 52% (n = 53/102) of patient data was obtained from single-center hospitals, 33% (n = 34/102) was from publicly available databases and 15% (n = 15/102) was from multiple institutions (Online Supplemental Data).
Description of Internal and External Validation Data Sets and Techniques
Of 85 studies, 7 reported >1 distinct model pipeline to predict glioma molecular subtypes, resulting in 95 analyzed pipelines.20⇓⇓⇓⇓⇓-26 The best performing model results for each study are reported for molecular alterations in gliomas, including IDH, MGMT, 1p/19q codeletion, histone H3 K27M, ATRX, TERT, and others. The results from external validation were reported. For studies with internal validation only, the holdout validation was prioritized over cross-validation. Techniques varied among leave-one-out-cross-validation, n-fold cross-validation to holdout, and external validation. In 5% (n = 5/95) of the articles, the validation cohorts were separated from the initial cohort by time only and were, therefore, re-classified as internal validation in our analysis. Overall, 81% (n = 77/95) used internal validation of any kind, while only 37% (n = 35/95) used forms of cross-validation and 39% (n = 37/95) used holdout validation. Only 19% (n = 18/95) reported accuracy from an external validation cohort.
We performed a Mann-Whitney U test on the studies that reported accuracy, AUC, sensitivity, or specificity to analyze whether statistically significant internal and external validation differences were present. No significant differences were found between both groups for all 4 categories (Table 1 and Fig 2).

Algorithm performance measurement in internal and external validation data sets. Percentages are reported as fractions to visualize measurements in 1 graph.
Mean performance measurements of all studies
Performance of Molecular Subtype Prediction
If studies had multiple predictions with the same model, the highest AUC and accuracy are reported. In internal validation studies, IDH mutation status was the most frequently evaluated molecular subtype, with the overall highest mean AUC and accuracy values of 0.88 and 85%, respectively. MGMT promoter methylation was reported in 12 studies as the best predicted subtype, with a mean AUC and accuracy of 0.82 and 80%. The 1p/19q codeletion was predicted in 9, with a mean AUC and accuracy of 0.84 and 85%. Prediction models for histone H3 K27M were identified in 6 studies with a mean AUC and accuracy of 0.80 and 81%. ATRX status was predicted in 1 study with an AUC and accuracy of 0.93 and 92%. TERT promoter mutation was predicted in 2 studies, resulting in a mean AUC and accuracy of 0.77 and 77%. Other subtypes included common subgroups like EGFR,27,28 p53,22 RB129 and VEGF,30 as well as a pooled accumulation of genetic information that was predicted as groups (Online Supplemental Data).31 Buda et al31 analyzed the prediction of pathologic biomarkers Ki-67, S-100, and glial fibrillary acidic protein,23 which were also included in this category. Overall, these studies achieved a mean AUC and accuracy of 0.77 and 82% (Fig 3A).
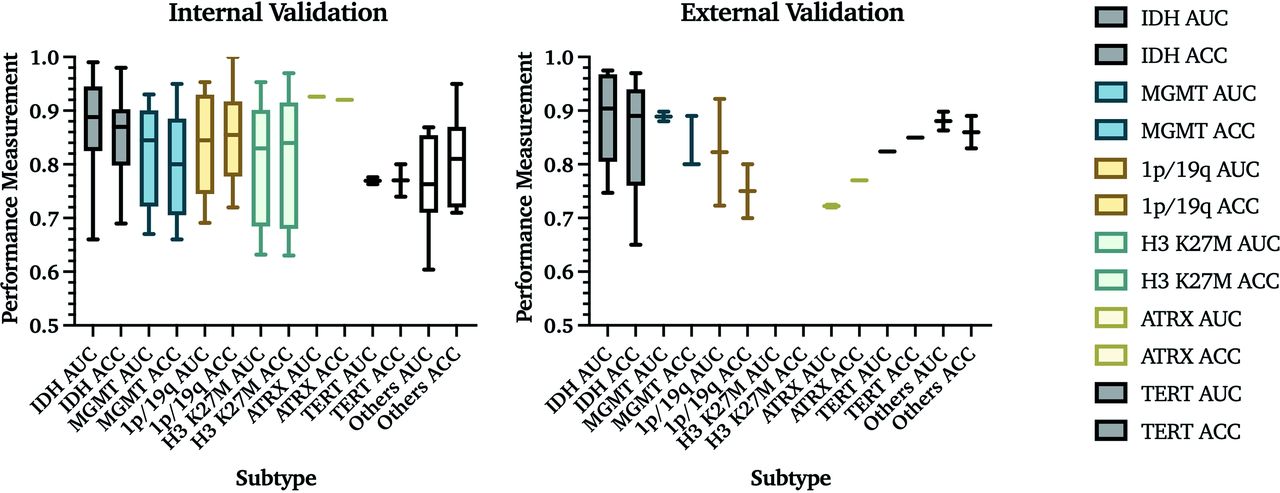
AUC and accuracy (ACC) results from internal and external validation studies. Results from 76 internal and 18 external validation studies are demonstrated on the basis of the molecular subtype that is being predicted. The central line in each result indicates the median value of the labeled subtype. Percentages are reported as fractions to provide visualization.
Among studies that used external validation, 7 studies predicted IDH status with a mean AUC = 0.89 and accuracy = 86%; 3 studies predicted MGMT promoter methylation with a mean AUC = 0.89 and accuracy = 83%; 2 studies predicted 1p/19q codeletion status with a mean AUC = 0.82 and accuracy = 75%; 2 studies predicted ATRX status with a mean AUC = 0.72 and accuracy = 77%; and 1 study predicted EGFR status with a mean AUC =0.82 and accuracy = 85%. Other molecular subtypes, such as PTEN (accuracy = 82.5%)32 and BRAF (AUC = 0.85)33 mutation status, were each evaluated in 1 study. No study with external validation predicted histone H3 K27M status (Table 2 and Fig 3A).
Types of algorithms used to predict the molecular subtypes of gliomas and the number of studies that used them
Algorithm-Based Prediction Models
Overall, of internally validated models, 35% (n = 27/77) included tree-based; 27% (n = 21/77), support vector machine (SVM); 32% (n = 25/77), neural networks; and 5% (n = 4/77), other classifiers. In externally validated models, 44% (n = 8/18) were tree-based; 39% (n = 7/18), SVM; 6% (n = 1/18), neural networks; and 11% (n = 2/18), other classifiers (Table 3 and Fig 4B).

Comparison of performance of different ML algorithms in internal and external validation data sets. A, In internal validation studies, 35% (n = 27/77) used tree-based; 27% (n = 21/77), SVM; 32% (n = 25/77), neural network; and 5% (n = 4/77), other classifiers. The section named “Others” includes machine and deep learning algorithms, which cannot be classified into these 3 groups, and mixed classifiers with characteristics of multiple techniques. Lines indicate the mean value. B, Comparison of ML and DL algorithms. This figure refers to SVM and tree-based algorithms as overall ML algorithms. At the same time, all neural network–based classifiers are DL classifiers. In internal validation studies, 68% (n = 52/77) used ML algorithms, and 32% (n = 25/77) used DL classifiers. The DL algorithms demonstrated higher AUCs and statistically significant internal validation data sets. In the 95 patient cohorts analyzed, 68 studies used classic ML classifiers for their predictive models, while 26 used DL networks. The comparison of algorithms in external validation data sets was limited due to the small number of studies that validated DL algorithms. ACC indicates accuracy.
Performance of algorithms
A neural network with a mean AUC and accuracy of 0.88 and 85% achieved the best overall prediction results. No statistically significant difference among all ML classifiers and neural networks was found with the Mann-Whitney U test. Tree-based algorithms and SVM performed slightly worse than neural networks with an AUC and accuracy of 0.82 and 82%, and 0.83 and 83%, respectively (Table 3).
In internal validation models, the overall mean AUC and accuracy for deep learning (DL) algorithms (0.82 and 82%) were higher than ML algorithms (0.88 and 86%) and were statistically significant by the Mann-Whitney U test (P = .02) (Fig 4B).
These results were not observed in external validation pipelines (Table 3).
Performance of Studies on the Prediction of IDH Mutation and MGMT Methylation Status
Mean AUC and accuracy for the prediction of IDH mutation status were 0.88 and 85% in internal validation studies and 0.85 and 86% in external validation studies. For the prediction of MGMT promoter methylation, AUC and accuracy in internal validation studies were 0.79 and 80% and 0.89 and 83% in external validation. While a P value of .02 indicated a statistically significant difference between AUC values for IDH and MGMT for internal validation cohorts, Mann-Whitney U tests did not show such a difference between accuracies, with a P value = .16 (Fig 5).

Performance measurements for the prediction of IDH and MGMT in internal and external data sets. A. AUC results for IDH mutation status and MGMT promoter methylation prediction. These data include all studies with IDH and/or MGMT prediction results, increasing the number of studies from 59 to 63. B, Accuracy results for IDH mutation and MGMT promoter methylation status.
Risk of Bias Assessment
A risk of bias assessment was performed per PROBAST guidelines (Fig 6 and Online Supplemental Data).17
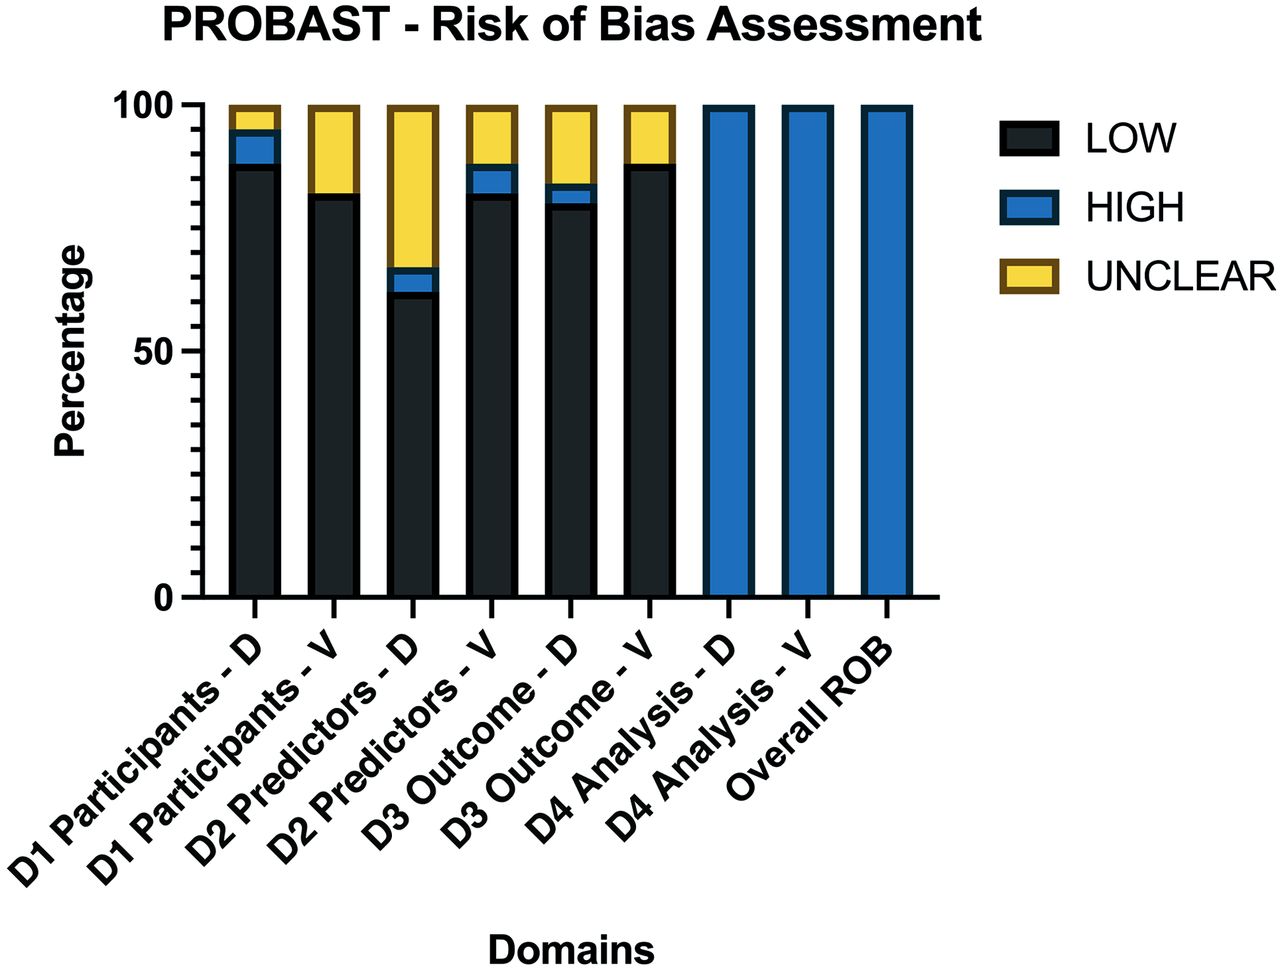
Average PROBAST scores of all 85 included articles. Domains were scored as high ROB if ≥1 item for each domain were scored as “No” or “Probably No.” PROBAST questions are assessed so that answering with no indicates ROB for this respective item. If 1 domain was considered a high ROB, the overall ROB of the study was considered high. As a result, each study was overall rated as having a high ROB. ROB indicates risk of bias; D, development studies; V, validation studies; D1, domain 1 participants; D2, domain 2 predictors; D3, domain 3 outcome; D4, domain 4 analysis.
The risk of bias was low in the participant, predictor, and outcome sections of development and validation studies. The risk of bias was high in all of the analysis sections of the studies, regardless of whether these were development or validation studies. The main reasons for high bias in the analysis sections were due to items 4.1 and item 4.4.
Item 4.1 assesses the number of patients relative to imaging features extracted, suggesting an overfitting issue. It scored as “no” in 77.64% (n = 66/85) of the studies. Additionally, item 4.4 suggesting a lack of reporting or incorrect handling of missing data, such as simple exclusion, was found in 98% (n = 83/85) of studies.
DISCUSSION
Diagnosis and treatment of gliomas are based on pathologic and molecular classifications outlined in the 2021 WHO Classification of CNS tumors. Noninvasive methods for image-based prediction of glioma molecular subtype on preoperative images are the next frontier in neuro-oncology because they will provide information before surgical intervention and have the potential to change treatment options for patients with brain tumors. Since 2017, published literature has significantly increased, showing high prediction results for this classification task. However, a thorough assessment of this literature to identify algorithms that can be used for clinical translation have yet to be performed.
Our systematic review shows that literature in this field has several limitations, which include low patient numbers (mean = 165.31), limited use of geographically distinct validation data sets (18.95%), and limited use of multicenter hospital data (14.71%). The most predicted molecular biomarkers were IDH and MGMT, which are critical for classifying glioblastoma from lower-grade gliomas and for predicting response to temozolomide therapy. Testing for these is standard of care in clinical practice. Therefore, these results are more available than other molecular biomarkers.
We show that DL algorithms result in significantly higher AUC values in internal validation studies than ML (P value = .02), leading us to recommend developing DL algorithms for future applications. Our review highlights the feasibility of accurately predicting glioma molecular subtypes; however, only some studies addressed the need for transparency and interpretability of these prediction models and demonstrated a high risk of bias. A unique aspect of our study is the broad inclusion criteria, which required screening of >12,000 abstracts before full-text review. Our study also contains the largest number of evaluated articles (n = 85) with the most characteristic features extracted (n = 18) (Online Supplementary Data).34 In our analysis, we extracted not only feature characteristics of patient data sets but also imaging sequences, including advanced imaging modalities, algorithms, and types of ML algorithms with outcome assessment on internal and external validation data sets.
In addition to a thorough feature-extraction process from individual articles, we performed bias analysis with the most relevant assessment tool currently available, PROBAST.17 Prior studies demonstrated that ML approaches for the evaluation of gliomas have significant deficiencies in reporting quality as assessed by TRIPOD,9⇓-11 aligning with our results of high bias. Unlike the previous systematic review, which had more restrictive inclusion criteria, our systematic review included 35 studies that did not report AUC (n = 21/95) or accuracy (n = 14/95) in evaluating their respective models. Our less restrictive inclusion criteria, inclusion of studies that did not report both AUC and accuracy allowed us to better evaluate the distribution of different ML approaches in this field. Furthermore, our review did not exclude studies with non-MR imaging modalities or those with missing data, resulting in a total of 44 studies being included in our analysis.34 While our findings generally agree with the results of prior work, we provide additional information on the differences in internal and external validation studies (conclusions), prediction performances of analyzed glioma molecular subtypes (section 4.4), and details of different image modalities with their corresponding performance metrics (Online Supplemental Data).
We recommend future studies evaluating ML algorithms in the imaging of gliomas to develop prediction algorithms based on larger data sets with geographically distinct data for model validation to provide generalizable results.35 Until now, most studies relied on single-center hospital data and publicly available data sets. We recommend building databases of annotated images in individual hospitals and considering federated learning.36,37 These changes will result in less reliance on publicly available data sets that are highly curated and will provide a diversity of hospital training data that will overcome the low data set patient number and allow translation of algorithms between different hospitals.38 Additionally, we recommend that journal editors require validation of data set results, despite the expected drop in AUC and accuracy. This is well-represented in the recent RSNA-MICCAIS AI challenge, which demonstrated that the highest prediction for MGMT methylation based on an unseen external validation set was an AUC of 0.62.39⇓⇓-42 Our literature review demonstrates 17 articles predicting MGMT methylation with AUC results ranging from 0.55 to 0.93 (mean, 0.81) in internal and external validation sets.
Some of the reasons for the inability to replicate these results could be low patient numbers in the reported studies, lack of description of model validation, high bias within the articles with the potential for overtraining, differences in segmentations among data sets, and differences in methods of MGMT methylation assessment between different hospitals. Future studies should consider that other pathologic testing protocols for molecular characterization at different hospitals and tumor heterogeneity with sampling bias can be a source of error because it is currently used as the criterion standard in ML algorithm development and, therefore, introduces reference bias in the respective findings.
Limitations
A limitation of this review includes analysis of studies with incomplete data, which resulted in unequal data analysis for criteria such as the accuracy of results. Additionally, the number of studies with external validation was low, limiting the generalizability of the findings and raising an important point for editors and authors to consider the need to include external validation data sets in their publications. Furthermore, publication bias was not assessed because it was considered beyond the scope of this review. Finally, we compared the best prediction pipeline each study had to offer, which might introduce bias in our findings despite our efforts to minimize bias in our analyses.
CONCLUSIONS
The results of prediction algorithms for molecular subtypes of gliomas in published studies demonstrate high AUC and accuracy. Still, there is an increased risk of bias based on the PROBAST assessment, which can result in poor data reproducibility. Improvement in reporting the quality of articles, development of large hospital-annotated data sets, and performance of external validation studies in future literature are critical for identifying algorithms that can be translated into clinical practice. This issue raises the need to develop novel tools for efficient data curation and annotation within the clinical workflow.
ACKNOWLEDGMENTS
The American Society of Neuroradiology Fellow Award 2018 was presented to M.A. This publication was made possible by KL2 TR001862 (M.A.) from the National Center for Advancing Translational Science, components of the National Institutes of Health, and the National Institutes of Health Roadmap for Medical Research. A.A. is a PhD student in the Investigative Medicine Program at Yale, which is supported by Clinical and Translational Science Awards grant No. UL1 TR001863 from the National Center for Advancing Translational Science, a component of the National Institutes of Health. A.A. holds securities in Hyperfine. M.L. is an employee and stockholder of Visage Imaging Inc and, unrelated to this work, receives funding from National Institutes of Health/National Cancer Institute R01 CA206180 and is a board member of Tau Beta Pi engineering honor society. Michael Sabel is a consultant for Novocure and Codman.
The content of this article is solely the authors’ responsibility and does not necessarily represent the official view of National Institutes of Health.
Footnotes
Disclosure forms provided by the authors are available with the full text and PDF of this article at www.ajnr.org.
Indicates open access to non-subscribers at www.ajnr.org
References
- Received February 27, 2023.
- Accepted after revision August 1, 2023.
- © 2023 by American Journal of Neuroradiology


Jump to section
Related Articles
Cited By...
- No citing articles found.