
Abstract
BACKGROUND AND PURPOSE: 3D reconstruction of a targeted area (“safe” triangle and Kambin triangle) may benefit the viability assessment of transforaminal epidural steroid injection, especially at the L5/S1 level. However, manual segmentation of lumbosacral nerves for 3D reconstruction is time-consuming. The aim of this study was to investigate the feasibility of deep learning–based segmentation of lumbosacral nerves on CT and the reconstruction of the safe triangle and Kambin triangle.
MATERIALS AND METHODS: A total of 50 cases of spinal CT were manually labeled for lumbosacral nerves and bones using Slicer 4.8. The ratio of training/validation/testing was 32:8:10. A 3D U-Net was adopted to build the model SPINECT for automatic segmentations of lumbosacral structures. The Dice score, pixel accuracy, and Intersection over Union were computed to assess the segmentation performance of SPINECT. The areas of Kambin and safe triangles were measured to validate the 3D reconstruction.
RESULTS: The results revealed successful segmentation of lumbosacral bone and nerve on CT. The average pixel accuracy for bone was 0.940, and for nerve, 0.918. The average Intersection over Union for bone was 0.897 and for nerve, 0.827. The Dice score for bone was 0.945, and for nerve, it was 0.905. There were no significant differences in the quantified Kambin triangle or safe triangle between manually segmented images and automatically segmented images (P > .05).
CONCLUSIONS: Deep learning–based automatic segmentation of lumbosacral structures (nerves and bone) on routine CT is feasible, and SPINECT-based 3D reconstruction of safe and Kambin triangles is also validated.
ABBREVIATIONS:
- ESI
- epidural steroid injection
- IoU
- Intersection over Union
- tESI
- transforaminal epidural steroid injection
Low back pain with a radicular component is a common ailment in many clinics and is a leading cause of disability and adds a great burden to health care costs globally.1,2 It is difficult to detect the specific etiology, but the pain is usually caused by inflammation of nerves due to mechanical compression or chemical irritation.3 Lumbar degenerative disease, including spinal stenosis and lumbar disc herniation, is a main culprit of low back pain and radicular symptoms. Before spinal surgery, epidural steroid injection (ESI) is an interventional option for the management of low back and radicular pain.4,5 Transforaminal epidural steroid injection (tESI) is a well-validated technique with merits of large distributions of injectate and superior short-term pain relief compared with an interlaminar or caudal approach.6,7 Typically, tESI is conducted via a “safe” triangle, while others prefer via a Kambin triangle because the safe triangle has been found to sometimes not be safe.8 The Kambin triangle is defined as an anatomic triangle with the nerve root (hypotenuse), traversing nerve root and/or facet joint (height), and superior border of a lower vertebra (base) as its components.9 The safe triangle is defined as the lower margin of the pedicle (base), the lateral border of the vertebral body (height), and the outer border of the exiting nerve (hypotenuse).10 Because the 2 triangles are 3D, the targeted area of tESI is variable from different views or even totally concealed by bony structures such as a high iliac crest, enlarged transverse process, and facet joint, especially at the L5/S1 level.10⇓–12 An increased area of the safe triangle and Kambin triangle should lead to more frequent successful outcomes of tESI.10 Complications of tESI such as intravascular injection and nerve root injury cause serious problems.13,14
X-ray fluoroscopy is the criterion standard to guide tESI.15 The bony landmark “Scotty dog” is identified to estimate the targeted area to present larger areas of the safe triangle or Kambin triangle. The C-arm machine is usually tilted to a certain angle to conduct an oblique fluoroscopy to identify the Scotty dog.16 However, x-ray fluoroscopy is incapable of providing information about soft tissues and localizing the needle tip in a real-time manner. Thus, CT fluoroscopy is introduced to guide the tESI because it can quickly and safely localize needles and minimize the risk of nerve injury.17 Usually, an initial CT scan with good image quality is obtained for viability assessment of the tESI, during which an ideal needle trajectory is planned on a single axial CT slice.18 Then, a CT fluoroscopy technique is used to guide the needle advancement on a single CT slice during which soft tissue is poorly presented on images.18 Therefore, a larger targeted area of needle advancement should reduce the risk of injuring the neurovascular structure. However, the CT plane is incapable of directly and quickly identifying an accessible trajectory targeting the largest safe or Kambin triangle, and sometimes the CT plane presents no accessible pathway on all axial slices. Instead, 3D construction of the safe or Kambin triangle may benefit the viability assessment of the tESI. Free manipulation of the 3D model will quickly identify an oblique needle pathway targeting the large safe triangle or Kambin triangle. However, manual segmentation of lumbosacral nerves for 3D reconstruction is time-consuming.
Recently, deep learning has gained substantial attention in the field of radiology.19⇓⇓–22 Deep learning algorithms can learn from large amounts of data using neural networks, frequently convolutional neural networks.23 Although convolutional neural networks were proposed decades ago, it is only in the past 7 years that deep learning has achieved great success due to massive available data, increased processing power, and rapid development of algorithms.23 The U-Net (https://lmb.informatik.uni-freiburg.de/people/ronneber/u-net/) is a kind of convolutional neural network that was developed for biomedical image segmentation by Ronneberger et al24 in 2015, and it has many applications in the segmentation of 2D images. In 2016, the same group developed a 3D U-Net (https://www.researchgate.net/publication/304226155_3D_U-Net_Learning_Dense_Volumetric_Segmentation_from_Sparse_Annotation) for volumetric segmentation as an extension architecture of the U-Net.25 Many studies have validated the segmentation performance of the 3D U-Net for volumetric medical images.26⇓–28 To the best of our knowledge, no studies are available on achieving automatic segmentation of lumbosacral nerves on CT. The aim of this study was to investigate the feasibility of automatically segmenting lumbosacral structures (nerves and bone) on CT with the 3D U-Net and the reconstruction of the safe and Kambin triangles.
Materials and Methods
This retrospective study was Health Insurance Portability and Accountability Act–compliant and approved by the institutional ethical committee of Shanghai Tenth People's Hospital before data extraction. A total of 50 patients with thin-layer CT covering the lumbosacral level from Shanghai Tenth People's Hospital were included in this study. All algorithms were developed and tested using Keras (Version 2.1.1 with tensorflow_backend.py; http://pydoc.net/Keras/2.1.2/keras.preprocessing.image/) in a personal computer (graphics processing unit: a Nvidia GeForce 1080Ti, https://www.nvidia.com/en-us/geforce/products/10series/geforce-gtx-1080-ti/, with 4 GB of memory and a 3.5-GHz Intel Core i7–4790 CPU with 8 GB of memory).
Manual Annotations
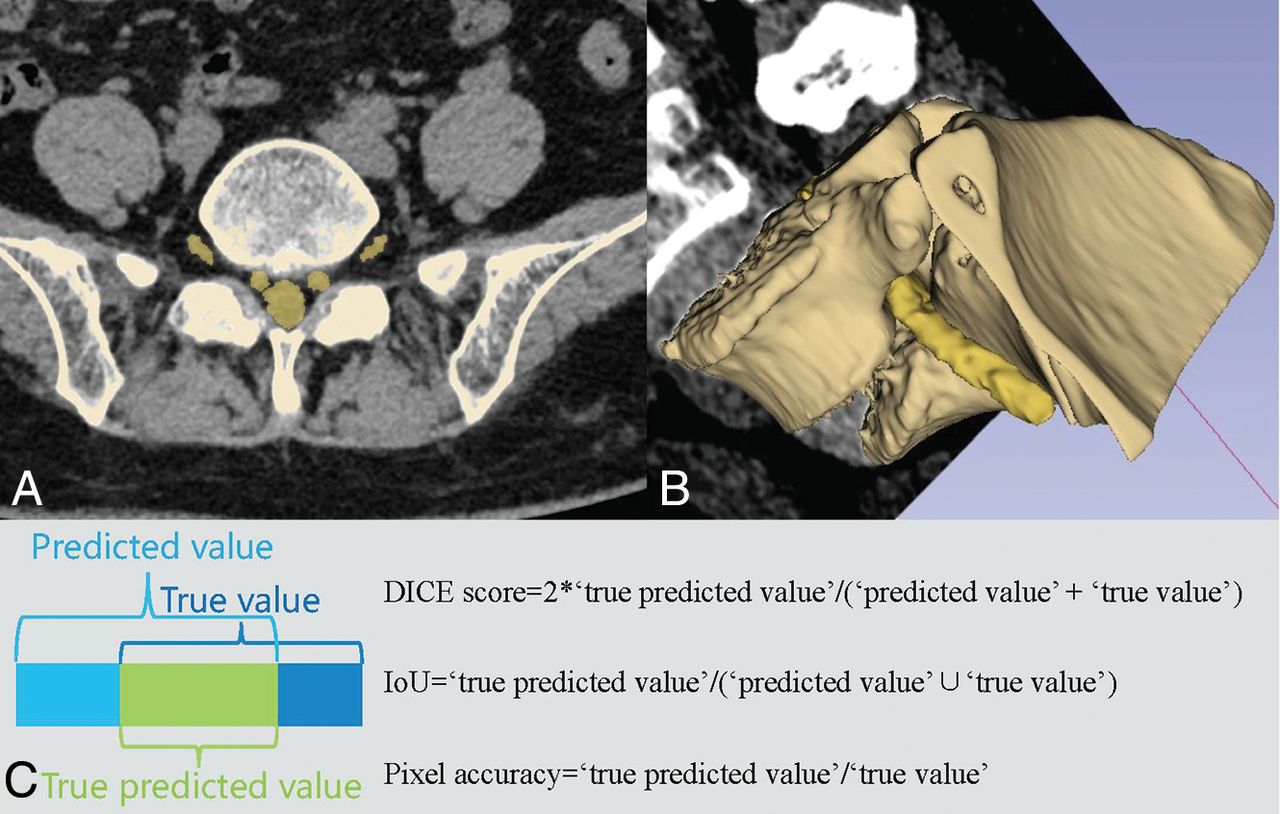
All data were manually segmented with Slicer 4.8 (http://www.slicer.org).29 Lumbosacral nerves and bones were meticulously segmented and labeled (Fig 1A, -B). A spine surgeon who is an expert in reading lumbar CT and had systematic training in Slicer manually segmented the nerves and bones. Then the segmented images were reviewed by an interventional radiologist and pain physician, both of whom are experts in CT-guided epidural steroid injection. Any disagreements of segmentation were solved by the 3 doctors voting. These manual annotations were regarded as the ground truth.

Manual segmentation and 3D reconstruction on Slicer. A, manual labels. B, 3D reconstruction with a coronal image. C, Illustrations of the Dice score, Intersection-over-Union, and pixel accuracy.
Data Preprocessing and Segmentation Assessment
All thin-layer CT scans were preprocessed using the following steps: resampling, cropping, and intensity normalization (On-line Appendix). Pixel accuracy, Intersection over Union (IoU), and the Dice score were used to assess the segmentation performance of lumbosacral structures (Fig 1C). The functions of these 3 indicators are as follows:
. Dice Score = 2 × True Predicted Voxels/(Predicted Voxels + True Voxels)
. IoU = True Predicted Voxels/(Predicted Voxels ∪ True Voxels)
. Pixel Accuracy = True Predicted Voxels/True Voxels.
Because the Dice score is the most common indicator in computer vision,30 the current study adopted it as the primary index to assess the segmentation performance.
Network Architecture
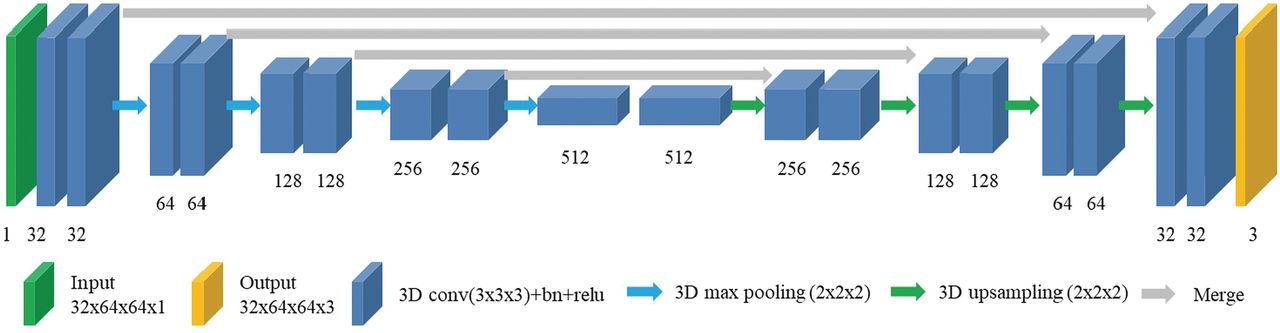
The 3D U-Net was adopted for multiclass segmentation of lumbosacral structures (Fig 2). The adopted network consists of 2 parts, the encoder and the decoder parts. The encoder part performs data analysis and feature-representation learning from the input data, and the decoder part generates segmentation results. There are also 4 shortcut connections (concatenations) between layers of equal resolution in the encoder and decoder paths. The last layer of the model is a 1 × 1 × 1 convolutional layer followed by a softmax layer (https://www.mathworks.com/help/deeplearning/ref/nnet.cnn.layer.softmaxlayer.html), with 3 output channels. The input of the model is 32 × 64 × 64 voxel patches of CT. The output is the corresponding probability mask, and its shape is 32 × 64 × 64 × 3. The whole architecture has 22,581,411 parameters. The developed model is named SPINECT because it aims to automatically segment multiple structures solely on the basis of spinal CT.

Schematic of the network architecture.
Training
During the training phase, a number of minibatch CT and manual labeling masks are randomly selected from the training dataset, and the image data are subjected to the standardization processing and the augmentation operation. As a result, the training data input to each training iteration is different, and this feature improves the generalization ability of the model. The convolutional layer parameters of 3D U-Net are initialized by the method of He et al.31 The size of the patch (depth × height × width) input to the 3D U-Net during training is 32 × 64 × 64 (unit:voxel); the minibatch is 4, which is optimized by the Adam optimization algorithm32; and the learning rate is 5e-4. We selected the Adam optimization algorithm instead of stochastic gradient descent for training the deep learning network because it was straightforward to implement and computationally efficient.
Five-Fold Validation
During model training, 1 validation was performed every 100 training iterations. Specifically, 6 cases were randomly selected from the validation dataset for standard processing. The standard processing included several sequential steps: 1) Set the voxel size to 1 mm by the nearest interpolation method, and 2) standardization. Then, we added random noise plus random horizontal and vertical flipping to augment the selected cases. A sliding window of 32 × 64 × 64 was used to traverse the data with stride = (20 × 40 × 40) to obtain the patch. The patch is input to the current model; then the model generates the corresponding probability mask. Finally, the automatic segmented mask is obtained with a combined algorithm (Table 1). The Dice score of each voxel class is obtained with comparison of the automatic segmented mask and the manually labeled mask. If the average of the Dice score is greater than the prior best Dice score by the current iteration, the current model parameters will be saved. We use a combined algorithm in which the patch-based CNN is applied at a sequence of patches of the data, and the resulting label probabilities are summed according to their voxel location. Subsequently, the labels are established by the probabilities.
Overview of the combined algorithm
Testing
The ratio of training, validation, and testing of the 50 cases from our local dataset is 32:8:10. A total of 10 cases randomly selected from the local dataset were tested on SPINECT. To validate the robustness of our trained model, we also conducted cross-dataset testing on 10 cases from an on-line imaging dataset (SpineWeb; http://spineweb.digitalimaginggroup.ca/).33 Pixel accuracy, IoU, and the Dice score were used to assess the segmentation performance of lumbosacral structures.
Radiographic Evaluation
To compare the difference between manually segmented masks and automatically generated masks, we present a random slice from each case. In addition, 3D rendering of manual masks before preprocessing, post-preprocessing masks, automatically generated masks, as well as smoothed 3D rendering of automatically generated masks (smoothing method: median; Kernel size: 1.5 mm) are also presented. To further investigate the segmentation performance of SPINECT, we measured both Kambin and safe triangles at the L5/S1 level on both sides on manually segmented and automatically segmented images (Fig 3). First, the Kambin triangle and safe triangle were visualized on Slicer with 3D rendering of manually and automatically segmented labels. Then, the Kambin triangle and safe triangle were set with the same angles between manually and automatically segmented images. Screenshots were obtained and imported into Image J software (Version 1.8.0_112; National Institutes of Health, Bethesda, Maryland) for area measurements of the Kambin and safe triangles. Two independent observers measured the area of the 2 triangles from manually and automatically segmented images. One month later, one of the observers measured the area of the 2 triangles again. The intraclass correlation coefficient was calculated to assess test-retest reliability and interobserver reliability of multiple measurements.

Measurement of safe and Kambin triangles. A, Schematics of the Kambin triangle. B, Schematics of the safe triangle. C, Measurement of the Kambin triangle on a manually segmented image. D, Measurement of the safe triangle on automatically segmented images.
Statistical Analysis
The generated labels from SPINECT were used to generate the 3D rendering of bones and nerves on Slicer. After testing the normal distribution (Shapiro-Wilk test), we used a paired Student t test to detect statistically significant differences of the safe and Kambin triangles between manually segmented images and automatically segmented images. All continuous data are presented as mean ± SD, and a P value <.05 is a statistically significant difference.
Results
Testing results revealed that SPINECT could achieve successful segmentation of multiple structures (bones and nerves) on CT (Fig 4). Quantitative segmentation accuracy is shown in Table 2. The average pixel accuracy for the bones was 0.940, and for the nerves, 0.918. The average IoU for the bones was 0.897, and for the nerves, it was 0.827. The Dice score for the bones was 0.945, and for the nerves, it was 0.905. In each validation fold, it took about 4 hours 35 minutes to finish the training of the segmentation net. After training, SPINECT requires a total RAM space of 305.384 MB, and it takes about 3.1 seconds (Nvidia GeForce 1080Ti) to complete an automatic segmentation on a single case (On-line Table). In total, it took about 13 seconds to process 1 set of CT data (from data uploading and data preprocessing to semantic segmentation) with a graphics processing unit (Nvidia GeForce 1080Ti), which is far less than the 30 minutes for manual segmentation. Besides, the segmentation performance of 10 cases from SpineWeb was similar to that of our testing dataset (Table 3).

Automatic and manually labeled masks.
Segmentation accuracy in 10 testing casesa
Segmentation accuracy in 10 testing cases from the open dataseta
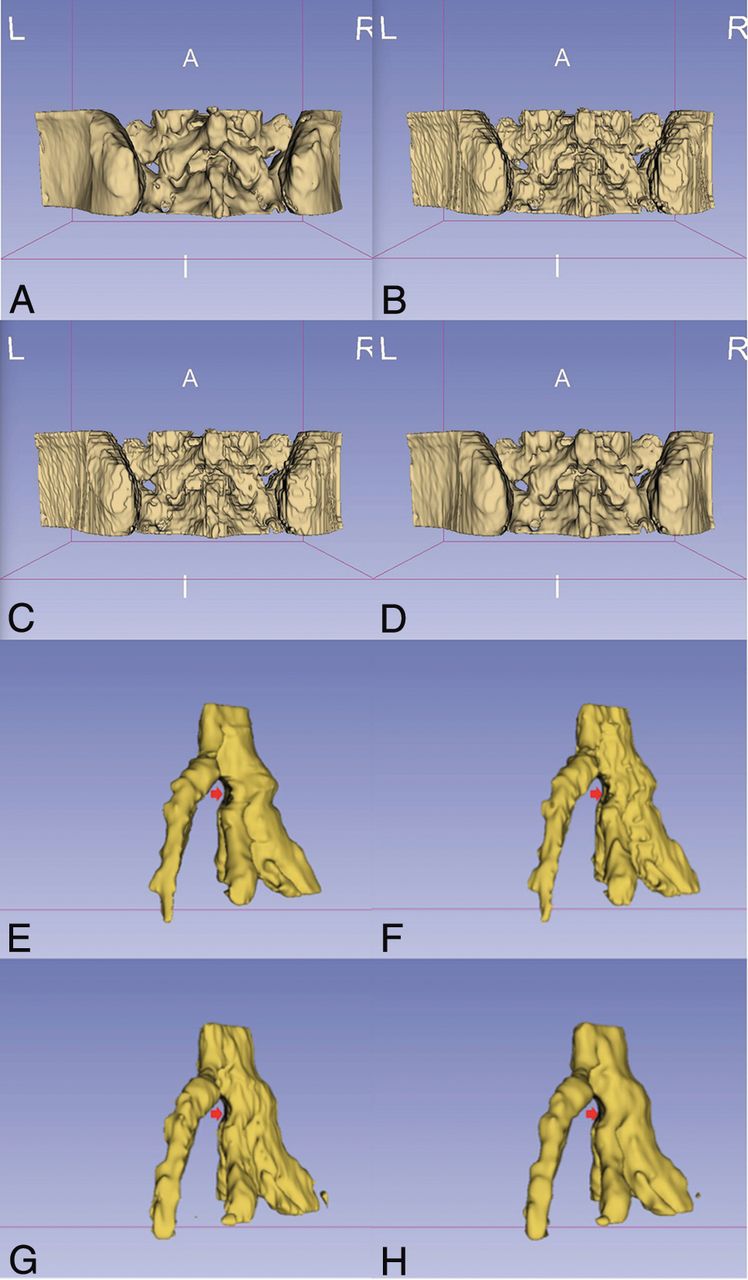
More important, there were no significant differences in the measured area of the safe or Kambin triangle between manual images and automatic images (Table 4). The area of Kambin triangle was 37.80 ± 20.90 mm2 on manual images and 36.41 ± 19.27 mm2 on automatic images (P = .302). The area of the safe triangle was 8.69 ± 2.24 mm2 on manual images and 8.56 ± 3.25 mm2 on automatic images (P = .792). The reliability test revealed strong test-retest reliability and interobserver reliability of multiple measurements (Table 5). As in Fig 5, 3D rendering of automatic masks was similar to that of post-preprocess masks, and 3D rendering of manual masks was similar to that of smoothed automatic masks. Moreover, dura compression was clearly present in the four 3D rendered images.
Measured area of the safe and Kambin trianglesa
Test-retest reliability and interobserver reliability of multiple measurements

3D rendering of automatic masks and manually labeled masks of bones and nerves. A, 3D rendering of manual masks before preprocessing. B, 3D rendering of post-preprocessed masks. C, 3D rendering of automatically generated masks. D, Smoothed 3D rendering of automatically generated masks. E, 3D rendering of manual masks before preprocessing (arrow indicates the compressed dura). F, 3D rendering of post-preprocessed masks (arrow indicates the compressed dura). G, 3D rendering of automatically generated masks (arrow indicates the compressed dura). H, Smoothed 3D rendering of automatically generated masks (arrow indicates the compressed dura).
Discussion
Knowledge of bony and neurovascular anatomy of the spinal foramen is essential when performing tESI.34 However, the Kambin or safe triangle has never been visualized before tESI. Thin-layer CT has great potential for reconstructing the safe and Kambin triangles, whereas manual segmentation of nerve roots is time-consuming. The current study has validated the feasibility of automatically segmenting lumbosacral structures (nerves and bone) on CT through deep learning and the 3D reconstruction of Kambin and safe triangles. To the best of our knowledge, this is the first study automatically segmenting lumbosacral nerves on CT through deep learning.
Reconstruction of the safe or Kambin triangle may benefit the viability assessment of tESI, especially at the L5/S1 level. Ideally, the needle trajectory is planned on an axial plane of conventional CT slices.10 However, trajectory planning could be difficult at the L5/S1 level in some cases due to the bony obstacles such as the iliac crest, facet joint, and transverse process (Fig 6). In that case, an accessible pathway could be found in an oblique perspective. However, operators may fail to quickly identify an oblique trajectory targeting the largest safe or Kambin triangle, even if the CT gantry can be tentatively angled caudally or cranially. Another option is to change the targeted area (eg, from the safe to the Kambin triangle) for trajectory planning.35 Nevertheless, axial CT slices are still incapable of presenting a large safe or Kambin triangle directly and quickly. Thus, 3D reconstruction of the safe or Kambin triangle may facilitate the viability assessment of tESI because it can quickly provide the specific perspective with a large targeted area. Ra and Min10 tried to identify an optimal angle of a nonaxial needle path with the largest area of the safe triangle for x-ray fluoroscopic guidance, but others thought a specific needle path is dictated by specific patient anatomy and cannot be consistently predicted using a constant angle. With free manipulation of 3D-rendering models, an oblique needle path could be planned when a large area of the safe triangle or Kambin triangle is presented (Fig 6C, -E). Our study also quantified the area of the safe or Kambin triangle, which might also help assess the viability of specific approaches. The area of the safe triangle ranged from 4 to 18 mm2 in our series, which is similar to that in the previous study.10 The area of the Kambin triangle at the L5/S1 level ranged from 10 to 84 mm2 in our series, which is smaller than the results from other studies36,37 because others removed the facet joint for measurement. More important, the measurements of triangles in our study confirmed no significant differences between manually segmented images and automatically segmented images, which validates the 3D reconstruction based on SPINECT in medical indicators.

3D model–based viability assessment of a transforaminal epidural steroid injection. A, Inaccessible trajectory to the safe triangle on an axial CT slice. B, Minimal space of the safe triangle on the posterior 3D model. C, Accessible oblique trajectory to the safe triangle on the 3D model. D, Inaccessible trajectory to the Kambin triangle on axial CT slice. E, Accessible trajectory on the 3D model. F, Oblique trajectory-guided nonaxial CT plane.
Nerve segmentation is essential for visualizing the safe and Kambin triangles because the exiting nerve root is the hypotenuse of the 2 triangles. Physicians usually recognize the Scotty dog to estimate the location of the safe and Kambin triangles under the guidance of x-ray fluoroscopy because the exiting nerve root has not yet been outlined. Moreover, only after multiple attempted punctures will contrast be injected to show the epidural and perineural flow, which may finally outline the nerve root sheath and epidural flow. Thus, x-ray fluoroscopy fails to demonstrate the detailed location of the exiting nerve root before punctures. The main advantage of CT is that it is good at precisely locating the needle placement using 3D imaging of soft tissues and osseous anatomy.38 Moreover, CT fluoroscopy is also capable of demonstrating real-time contrast flow. Nevertheless, nerve segmentation is not yet available on the current CT workstations for ESI. Diffusion tensor imaging or the MR neurography technique may be useful to enhance the spinal nerves for diagnosis and surgical planning.37,39 However, DTI or MR neurography scanning can be lengthy and costly and is not practical for ESI. In this current study, however, we have achieved automatic and precise segmentation of lumbosacral nerves on routine CT and successfully visualized the safe and Kambin triangles with segmented bones and nerves.
As more medical imaging datasets are created by medical experts, the application of deep learning in radiology is growing because of its excellent performance in recognition and segmentation. While bony structures are easily identified in intraoperative practice, deep learning may enable rapid recognition and precise segmentation of important soft tissue. Moreover, all paraspinal structures (eg, nerves, vessels, discs, muscles, ligaments) may also play an important role in procedure planning, spinal navigation, and even robotic surgery in the near future. The current study has shown that thin-layer CT is a good candidate for segmenting nerves, which discloses the substantial potential of CT in segmenting spinal soft tissue. Moreover, the performance of SPINECT further supports the findings of other similar studies using U-Net and its variants for semantic segmentation of biomedical images.40,41 We adopted the 3D U-Net instead of the 2D U-Net because 3D U-Net can adopt the information between slices of the CT volume. However, the U-Net has limitations of class imbalance and decreased segmentation accuracy. Because the voxels of background, bone, and nerve are quite different, small structure (nerve) tends to have a lower Dice score compared with large structures (bone and background) in semantic segmentation. Thus, we adopted the weighted softmax cross-entropy loss function, and the outcomes seemed to be acceptable. Feng et al42 used the U-Net to segment the spinal cord on thoracic CT with a Dice score of 0.89, which is similar to our study with a Dice score of 0.905 for lumbosacral nerves. Novikov et al43 segmented bones on CT on the basis of the U-Net with a Dice score of 0.95, which is similar to our study with a Dice score of 0.945 for lumbosacral bones. Furthermore, SPINECT segments lumbosacral nerves and bones in about 13 seconds, which is much shorter than the 30 minutes needed for manual segmentation. In summary, the developed model has the potential to be adopted in the workflow of spinal interventions and minimally invasive spine surgery.
The current study has limitations. First, this pilot study only conducted segmentation on the L5/S1 level because it is one of the most difficult levels for spinal intervention and even for minimally invasive spine surgery. SPINECT will be developed and tested on more levels (eg, L3/L4, L4/L5) and different spinal regions (eg, thoracic, cervical) in the near future. Second, although small vessels surrounding the foramen are critical for tESI, we did not segment pertinent vessels because they were not clear on noncontrast CT. However, semantic segmentation of multiple structures (eg, discs, large vessels, muscles, ligaments) will be integrated into SPINECT. Third, while the subject number and segmentation accuracy are acceptable, more cases may be needed for the accuracy to be further improved. Last, the automatic location of CT planes through deep learning may also help physicians in planning ESIs, and a large observational study exploring its feasibility is also on the way.
Conclusions
Deep learning with a 3D U-Net can effectively segment spinal nerves and bones from routine CT. The results of this study suggest that our proposed SPINECT can be used to segment spinal nerves on CT seemingly within near-human expert performance, which is reliable for reconstructing Kambin and safe triangles for tESI.
Acknowledgments
We thank our colleagues (Tie Y, Jagadeesan J, Mehrtash A, Zhou H, Kapur T, Kikinis R) in Brigham and Women's Hospital for professional comments and suggestions. We also appreciate the revision contribution by Xiaofei Guan from the Burke Neurologic Institute.
Footnotes
G. Fan and H. Liu contributed equally to the study.
Disclosures: William M. Wells—RELATED: Grant: National Institutes of Health, Comments: P41*; UNRELATED: Employment: Brigham and Women's Hospital, Massachusetts Institute of Technology; Grants/Grants Pending: National Institutes of Health, Comments: P41, R01s.* Shisheng He—RELATED: Grant: Shanghai Shenkang Hospital Development Center.* *Money paid to the institution.
This work is supported by the China Scholarship Council (201706260169), Shanghai Hospital Development Center (16CR3017A), and National Institutes of Health grant P41EB015898 (W.M.W.).
Indicates open access to non-subscribers at www.ajnr.org
REFERENCES
- Received January 14, 2019.
- Accepted after revision April 16, 2019.
- © 2019 by American Journal of Neuroradiology


