
Abstract
BACKGROUND AND PURPOSE: Recent flow dynamics studies have shown that the eccentricity of the spinal cord affects the magnitude and characteristics of the slow bulk motion of CSF in the spinal subarachnoid space, which is an important variable in solute transport along the spinal canal. The goal of this study was to investigate how anatomic differences among subjects affect this bulk flow.
MATERIALS AND METHODS: T2-weighted spinal images were obtained in 4 subjects and repeated in 1 subject after repositioning. CSF velocity was calculated from phase-contrast MR images for 7 equally spaced levels along the length of the spine. This information was input into a 2-time-scale asymptotic analysis of the Navier-Stokes and concentration equations to calculate the short- and long-term CSF flow in the spinal subarachnoid space. Bulk flow streamlines were shown for each subject and position and inspected for differences in patterns.
RESULTS: The 4 subjects had variable degrees of lordosis and kyphosis. Repositioning in 1 subject changed the degree of cervical lordosis and thoracic kyphosis. The streamlines of bulk flow show the existence of distinct regions where the fluid particles flow in circular patterns. The location and interconnectivity of these recirculating regions varied among individuals and different positions.
CONCLUSIONS: Lordosis, kyphosis, and spinal cord eccentricity in the healthy human spine result in subject-specific patterns of bulk flow recirculating regions. The extent of the interconnectivity of the streamlines among these recirculating regions is fundamental in determining the long-term transport of solute particles along the spinal canal.
ABBREVIATION:
- SSAS
- spinal subarachnoid space
A major feature of CSF flow in the spinal subarachnoid space (SSAS) is its periodic oscillation. The volume of oscillations of the blood flowing in and out of the rigid cranial vault causes the intracranial pressure to change in a time-periodic fashion with each heartbeat.1⇓–3 This pressure fluctuation drives CSF periodically in and out of the compliant spinal canal, as needed to ensure that the sum of the volumes of the brain, CSF, and intracranial blood in the rigid cranial vault remains constant (the so-called Monro-Kellie doctrine).4,5 Because of the slenderness of the spinal canal, the CSF flow velocity in the SSAS is aligned with the spinal cord. The limited compression of the venous and fatty tissue in the epidural space that surrounds the dura mater allows the spinal canal to accommodate a stroke volume ΔV ∼ 1 mL during each intracranial pressure pulsation, much smaller than the total volume V ∼ 60–90 mL of CSF contained in the SSAS.
As revealed by imaging studies using radionucleotides injected into the SSAS,6⇓⇓–9 in addition to the oscillatory flow, there is a steady bulk flow of CSF with much smaller velocities. Our recent studies10,11 combining multiscale asymptotic analyses of the Navier-Stokes equations with controlled experiments in canonical in vitro models of the SSAS have shed light on the physical mechanisms responsible for the establishment of this slow bulk motion. In particular, it has been shown that in addition to the oscillatory flow with a zero time average, the motion of the fluid particles is affected by a small velocity correction resulting from the combined effects of fluid inertia (the so-called “steady streaming”) and spatial gradients of amplitude of the axial pulsation (the so-called “Stokes drift”). Thus, the mean Lagrangian velocity obtained by filtering out the high-frequency ebb and flow of periodic oscillations exhibits a small steady component (the sum of the steady streaming velocity and the Stokes drift velocity) that is responsible for the bulk motion observed in previous imaging studies.6⇓⇓–9
Our analyses have shown that the bulk flow in the SSAS depends on the specific geometry (anatomy) of the SSAS, the frequency of the intracranial pressure pulsation, and the compliance of the spinal canal. In particular, it was demonstrated that the eccentricity of the spinal cord plays a major role, with the resulting flow being directed in opposite directions in the narrow and wide parts of the canal.10 Because the slow bulk motion is responsible for the convective transport of solute molecules,10,11 anatomic differences and changes in physiologic parameters are suspected of greatly affecting the rate at which solute particles are transported along the spinal canal. Thus, the main goal of the current study was to use our recently developed mathematical analysis to investigate how subject-specific anatomic differences affect the slow bulk flow of the CSF, providing improved understanding of the mechanisms regulating the transport of molecules and drugs along the spinal canal.
Materials and Methods
General Outline
We used our recently developed mathematical formulation10,11 to compute the average Lagrangian bulk motion of solute particles in healthy volunteers. To apply the model, we first obtained from MR imaging measurements all of the input parameters: the subject-specific anatomy of the SSAS, the frequency of the intracranial pressure pulsation, and an estimation of the distribution of compliance (elasticity) of the spinal canal. In the following text, we describe the methodology used to obtain these parameters from MR imaging measurements, along with the salient features of the mathematical model. For a detailed description of the mathematical model, the reader is referred to our previous publications.10,11 Note that our approach is not that of a traditional computational fluid dynamics simulation in which the Navier-Stokes equations are marched in time. Instead, by leveraging the disparity in time scales between the intracranial pressure oscillations and bulk motion, we obtained a set of time-independent equations to directly compute the velocity field of the bulk motion. These equations and the methods used to solve them are fully accessible by any potential user. Also note that the assumptions and analytic techniques used in the model have been verified by means of measurements in an in vitro simplified phantom model.10 Finally, although our methodology uses patient-specific input, variations in physiologic conditions for the duration of the experiment are not taken into account and might significantly affect the predicted CSF bulk flow, as has recently been shown in the context of numerical simulations of hemodynamic flow.12⇓⇓–15
Mathematical Model for CSF Flow in the Spinal Canal
The long-term transport of a solute in the spinal canal results from the competition between advection by the bulk motion of the CSF and the molecular diffusion of the drug. The extent of the latter is limited by the small value of the diffusivity of drugs used in intrathecal therapies, of the order 10−10 m2/s. Our recent studies demonstrate that the concentration of the solute in the SSAS is only a function of the longitudinal and azimuthal position in the canal, c(x, s), whose evolution is governed by the transient convective equation,
 where UL(x, s) and WL(x, s) are the width-averaged Lagrangian velocities in the longitudinal and azimuthal direction, respectively.11
The computation of UL and WL in each subject requires as input the spatial distributions of the canal width, h(x, s), the perimeter length of the spinal cord, ℓ(x), and the compliance, γ(x, s).11 The methodology used to obtain these functions h(x, s), ℓ(x), and γ(x, s) for each subject on the basis of MR imaging measurements is outlined below.
Acquisition of Anatomic Data and CSF Oscillatory Velocity with MR Imaging
In this institutional review board–approved study conducted at the Huntington Medical Research Institutes, MR imaging data collection and analysis of CSF oscillatory and bulk flow were performed in presumptively healthy subjects. Health Insurance Portability and Accountability Act standards for the management of subjects were followed in the procedure. Volunteers who had good health, normal pulse and respiratory rates, and no spinal disorders were recruited. The MR images obtained in the subjects were reviewed by a neuroradiologist to confirm the absence of spinal pathologies. Cobb angles were measured to determine the degree of cervical lordosis as the angle between the inferior endplate of the C2 vertebra and the inferior endplate of the T4 vertebra, and the degree of thoracic kyphosis, as the angle between the superior endplate of the T4 vertebra and the inferior endplate of the T11 vertebra.
All imaging was performed with a 3T Signa scanner (software Version HD23; GE Healthcare, Milwaukee, Wisconsin) using a 16-channel head/neck/spine receiver coil. No contrast was administered. High-resolution isotropic (0.5 mm) 3D fast spin-echo T2-weighted (TR = 2500 ms, TE = 111 ms, bandwidth = 83.3 kHz, FOV = 25.6 × 25.6, matrix = 256 × 256, NEX = 2, slice thickness = 1 mm) images were obtained using 3 overlapping sets in the sagittal plane to cover brain-to-cervical, thoracic, and lumbar spine regions (Fig 1A). Total scan time was approximately 40 minutes. The image sets were segmented in the axial orientation using the semiautomatic threshold-based segmentation tool of the open-source program ITK-SNAP (Version 3.6.0; www.itksnap.org).16 Matlab (MathWorks, Natick, Massachusetts) was used to extract the 3D position of the pia and dura mater (Fig 1B, -C). The cord perimeter ℓ(dFM) was measured as a function of the longitudinal distance from the foramen magnum, dFM. The width h of the SSAS was projected on the spinal cord to obtain a map h(dFM, dMP), where dMP is the azimuthal distance from the midline of the posterior spinal cord (Fig 1D). We applied a Gaussian smoothing filter in the cervical region to remove high-frequency noise in h originating from imperfections in the segmentation. In the lumbar region, the cauda equina was represented as a single tapered structure, continuous with the spinal cord, with a cross-section equal to the sum of that of all nerve roots. Dimensionless coordinates (x, s) were introduced to facilitate comparison of the results corresponding to different subjects, with the axial coordinate x = dFM / L defined by scaling the longitudinal distance with the total length of the canal L (measured from the foramen magnum to the end of the dural sac) and the azimuthal coordinate, s = 0.5 + dMP/ℓ, defined by scaling the azimuthal distance with the local cord perimeter ℓ (Fig 1F).
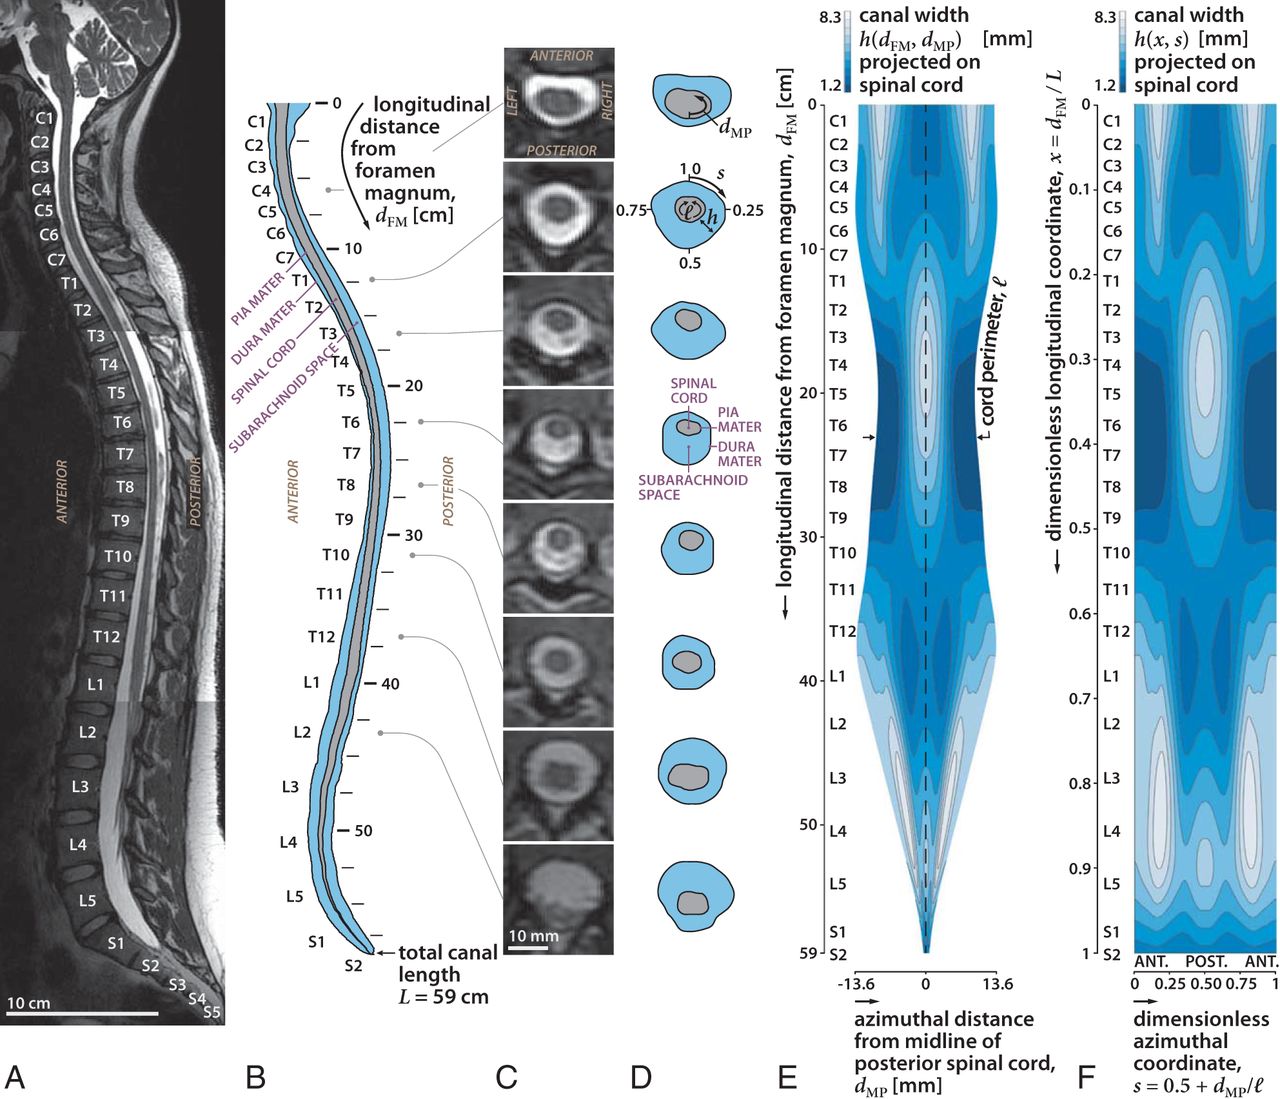
Sagittal T2-weighted MR image of the spine in subject 1 in the supine position (A), diagram of the sagittal images (B) and axial images (C), diagrams of the images at selected locations along the spine (D), width of the SSAS projected onto a 2D plane obtained by unrolling the space (E), and 2D map of the width of the SSAS after converting the length and circumference to dimensionless units (F). Length of the canal (x) is the fraction of the distance between the foramen magnum and the termination of the SSAS. The azimuth location in the canal (s) is the fraction of the rotation clockwise from the anterior midline. ANT and POST refer to the anterior and posterior regions of the SSAS, respectively. The width of the SSAS is greater anteriorly in the cervical region and posteriorly in the thoracic region, consistent with the different degrees of spinal cord eccentricity.
For illustration, the results of the above-described methodology and the relevant anatomic features will be discussed for subject 1 (Table). An important relevant anatomic feature—common to all subjects—is the change in the eccentricity of the spinal cord along the canal. The position of the spinal cord relative to the dura membrane within the anteroposterior plane varies along the canal (Fig 1). Observe in Fig 1A that the midline diameter of the SSAS on the posterior side (s = 0.5) exhibits, at its most cephalic end, a narrow region from C1 to C6, a wider region from C6 to T10, a moderately narrow region from T10 to L4, and, finally, a moderately wider region from L4 to S2 (Fig 1D, -E). Conversely, the anterior SSAS (s = 0 or, equivalently, s = 1) exhibits moderate widening in the cervical region (C1 to C7), it narrows from C7 to T11, and finally enlarges gradually toward the caudal end. Although all subjects share this common feature, they exhibit small-but-important changes in the locations where the cord eccentricity changes from posterior to anterior, and these will be shown in the following text to greatly affect the pattern of bulk CSF flow in each patient.
List of characteristic anatomic parameters for each subject
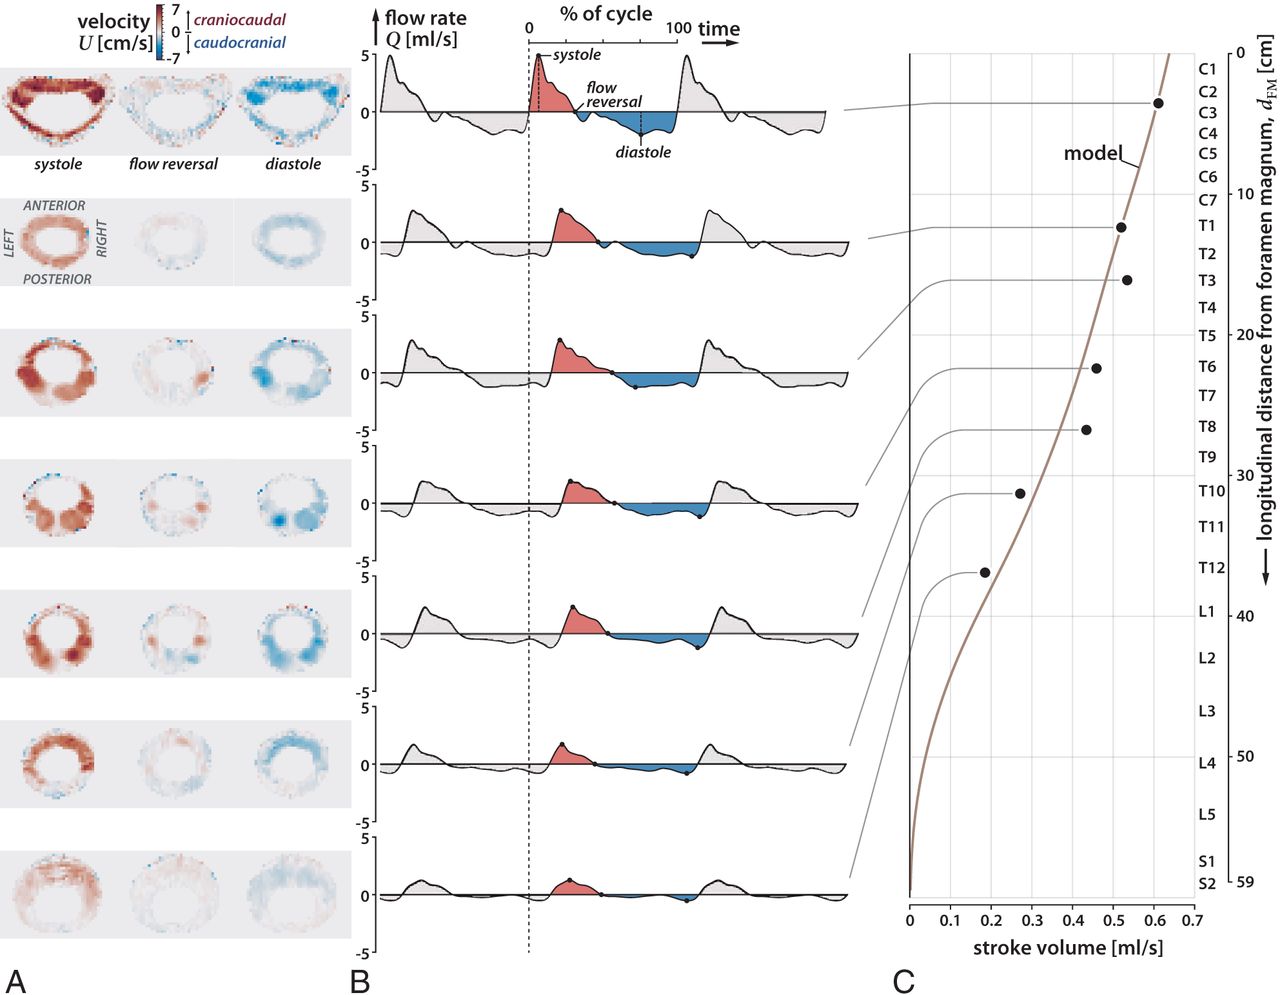
CSF flow velocity data were acquired at 7 vertebral levels (C3, T1, T3, T6, T8, T10, T12) (Fig 2) using phase-contrast MR imaging with respiratory and cardiac gating, and with a slice orientation perpendicular to the CSF flow direction. The imaging protocol consisted of a 2D single-shot gradient recalled-echo sequence with a slice thickness of 5 mm and an in-plane resolution of 0.5469 × 0.5469 mm. The specific imaging parameters include TR/TE = 18/6.66 ms, flip angle = 20°, and velocity encoding = 10, 4, 5, 6, 6, 6, 3 cm/s for the respective vertebral levels. At each level, 30 cardiac phases were obtained.17 During the acquisition, the heart rate of the subjects was 54–66 bpm. The MR phase and magnitude data were processed with in-house Matlab code to obtain the 2D distribution of longitudinal velocity U0 in the SSAS for 30 cardiac phases at the 7 x-locations (Fig 2A). These velocity fields were then numerically integrated over the area of the SSAS to obtain the flow rate that passes through each section x as a function of time t, Q(x,t) = ∫U0dA (Fig 2B). Finally, numerically integrating Q(x, t) over the complete cardiac cycle yields the craniocaudal decay of the stroke volume ΔV(x) = (1/2)∫|Q(x, t)|dt (Fig 2C).

Axial MR images of oscillatory flow velocity in 7 locations in the spine (C3, T1, T3, T6, T8, T10, T12) at systole, reversal of flow, and diastole for subject 1 (A), plot of CSF flow rate over 3 cardiac cycles at the 7 locations, using as a reference time the beginning of systole at the C3 level (dashed line) (B), and plot of the variation of the stroke volume of the oscillations of the CSF over the length of the spinal canal (C). During the cardiac cycle, systolic flow (shaded red) has greater velocity and shorter duration than diastolic flow (shaded blue). Oscillatory CSF flow rates diminish in the craniocaudal direction along the spine with the stroke volume diminishing to zero at the sacral end of the spine. CSF flow oscillatory velocities are greater in the anterior (s = 0) and anterolateral regions of the cervical subarachnoid space (s = 0.25 and s = 0.75) than in the posterior subarachnoid space (s = 0.5).
The measured velocity fields for subject 1 at each location are plotted in Fig 2A at the instance in time corresponding to the peak systolic velocity, peak diastolic velocity, and first flow reversal. The temporal evolution of the CSF flow rates at these locations is plotted in-phase in Fig 2B, where we used as a reference time the beginning of systole at the C3 vertebral level (indicated by the dashed line). These measurements allow estimation of the speed of the elastic wave propagating along the spinal canal and consequently the mean value of the canal compliance. The stroke volume ΔV(x) at each measurement plane computed by integrating the flow rate during 1 cardiac cycle is shown in Fig 2C. Note that the stroke volume decreases monotonically in the craniocaudal direction, with smaller slopes in the cervical and upper thoracic regions, indicating a more compliant canal in the thoracic and lumbar regions compared with the cervical region, which is consistent with an increased presence of fatty and soft tissues.18 Because of the strong coupling of the oscillatory flow at all levels—the wavelength of the elastic wave being comparable with the length of the spinal canal—accurate flow predictions can be obtained even without the use of velocity measurements at the lumbar level, which generally have a low signal-to-noise ratio.
Once the anatomic functions h(x, s) and ℓ(x) are determined, one still needs to determine the compliance of the canal γ(x, s). As previously mentioned, its mean value, which determines the effective wave speed of the elastic wave that propagates craniocaudally along the canal, is inferred from the phase shift in Q(x, t) between different vertebral levels (Fig 2B). The spatial variation can be obtained in an iterative fashion by comparison with the model computations. The computational procedure was started by using a presumed distribution γ(x, s) in computing from the mathematical model,10 the leading-order oscillatory flow, and the craniocaudal decay of the stroke volume, ΔV(x). The comparison of the latter with the craniocaudal decay of the measured stroke volume led to an updated guess for γ(x, s), which was iteratively adjusted to minimize departures between experimental measurements and theoretic predictions. In the case of subject 1, the final compliance distribution was found to be accurately represented by a slowly varying function, γ(x, s) = 14.3 [0.8 + 0.3 tanh (4x − 0.2)] m/MPa, which leads to predictions in excellent agreement with the measurements, as shown in Fig 2C. This function γ(x, s), along with the anatomic functions h(x, s) and ℓ(x), constitute the subject-specific information needed as input to the mathematical model.
Subjects of Study
We studied 4 healthy subjects without known anomalies of the spinal canal. Subject 1 was a 25-year-old woman who was first examined in the supine position and then again with cushions under her shoulders with an extended hip to change the degree of cervical and lumbar lordosis. Subject 2 was a 36-year-old man; subject 3, a 38-year-old man; and subject 4, a 23-year-old woman. The input data for subject 1 (in both body positions) and subject 2 were fully acquired in our study: The subjects underwent MR imaging in the supine position to obtain the spinal canal anatomy, and the primary oscillatory CSF flow was measured with MR phase contrast, using the aforementioned techniques. For subject 3, we obtained the anatomic image set from Ackerman, 1998,19 and proceeded with the segmentation to obtain the spinal anatomy. Subject 4 corresponds to the subject in Khani et al, 2018,20 whose segmented spinal geometry and the craniocaudal decay of the stroke volume, ΔV(x), were already available. Because no velocity measurements were available for subject 3, to be able to apply our model, we used for this subject the compliance distribution γ(x, s) obtained for subject 1, together with a nominal heart rate of 60 bpm. The Table shows a list of characteristic anatomic parameters for each subject: namely, the total canal length L, the average characteristic cord perimeter ℓc, and canal width hc over the thoracic region, and the Cobb angles corresponding to cervical lordosis and thoracic kyphosis.
Results
CSF Bulk Lagrangian Motion
Figure 3 shows the streamlines and direction of the width-averaged mean Lagrangian velocity field (UL, WL) for subject 1, obtained from the mathematical model. These streamlines are also the paths followed by the solute particles in the SSAS, with decreasing spacing between streamlines corresponding to increasing speeds. The resulting flow patterns show the existence of 3 distinct regions of recirculating flow where the fluid particles may remain trapped for long periods. Hereafter, we will refer to these regions as “Lagrangian vortices.” The 3 vortices, separated by streamlines that are nearly horizontal, are approximately located from C1 to T4, T4 to T11, and T11 to the caudal end of the SSAS. The lowest speed is found in the near-core regions of the vortical patterns of closed streamlines. In the upper cervical Lagrangian vortex, the bulk flow is caudocranial in the wider anterior subarachnoid space and craniocaudal in the narrower posterior space. On the other hand, in the intermediate thoracic region, the flow is craniocaudal in the anterior narrow space and caudocranial in the posterior wider space. These flow directions are reversed again in the third lumbar vortex with the CSF flowing caudocranial in the anterior wider space and craniocaudal in the posterior space.
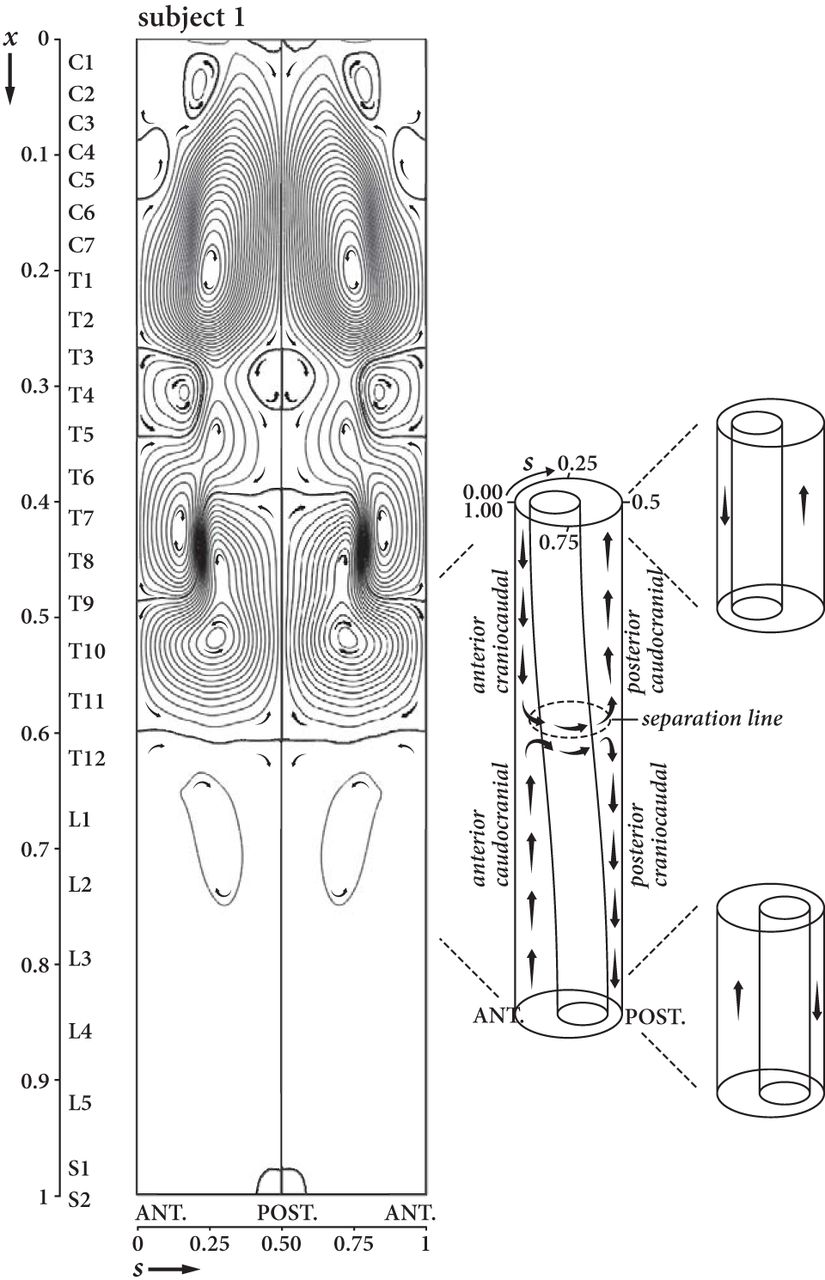
Streamlines and direction for bulk (mean Lagrangian) flow of the CSF in the SSAS in subject 1 in the supine position projected onto the 2D dimensionless plane with anterior midline SSAS at s = 0 and the posterior one at s = 0.5. Higher densities of streamlines near the posterior and anterior regions of the subarachnoid space indicate greater local bulk flow velocity. Bulk flow has multiple regions of patterns of circular flow where the fluid particles get trapped for long periods of time (Lagrangian vortices). Flow longitudinally in the SSAS occurs in the anterior and posterior subarachnoid space. In the lateral subarachnoid space (s = 0.25 and s = 0.75), flow is horizontally oriented where streamlines are present or essentially stagnant where streamlines are sparse. Subject 1 has 3 major pairs of Lagrangian vortices, 1 pair anatomically centered on C7, the second on T10, and the third on L1. Smaller Lagrangian vortices are also present. Where vortices contact each other, the mean Lagrangian flow in the adjacent vortices is in the same direction. Direction of flow along the spinal axis depends on cord eccentricity (sketch to the reader's right). In the cervical region, bulk flow occurs in a cephalad direction in the anterior subarachnoid space and in the caudal direction in the posterior subarachnoid space. In the thoracic region, bulk flow occurs in a cranial direction in the anterior subarachnoid space and in the cephalad direction in the posterior subarachnoid space. These flow directions are reversed again in the third lumbar vortex pair, with the CSF flowing caudocranially in the anterior wider space and craniocaudally in the posterior space.
As indicated in the sketch of Fig 3, the directions of the bulk flow along the spinal axis are correlated with cord eccentricity. In the cervical region, the Lagrangian vortex rotates clockwise to the reader's left and counterclockwise to the reader's right. The direction of rotation of these vortices is reversed in the thoracic region and once again in the lumbar region. The velocity of the bulk flow varies between vortices, being 2–3 orders of magnitude (100–1000 times) smaller in the lumbar than in the cervical region. The formation of these closed recirculating Lagrangian vortices can be understood in view of our recent modeling studies and experiments conducted in phantom models,10,11 in which we analyzed the bulk motion of the CSF in a simplified geometry consisting of 2 long cylinders with nonzero constant eccentricity along its length. The resulting bulk Lagrangian motion was seen to be directed in opposite directions in the narrow and wide parts of the SSAS. In the human SSAS, the eccentricity is not constant, exhibiting 2 changes along the spinal axis (Fig 1B, -D). At the location where the eccentricity changes from posterior to anterior and vice versa, the craniocaudal CSF flow in the narrow anterior part collides with the caudocranial flow from the wide anterior part, deviating the flow in the azimuthal direction toward the posterior section and forming the Lagrangian vortices, as indicated schematically in Fig 3.
Differences in Bulk Flow between Subjects
Although the existence of closed recirculation regions is a common feature for all subjects (Fig 4), there are important differences in the topology of these regions between different subjects and body positions. In subject 1, small variations in the body position, which reduced cervical lordosis by 8° and reduced thoracic kyphosis by 10°, resulted in a decrease in the number of Lagrangian vortices in the thoracic part of the SSAS. Subject 2 exhibits a large thoracic vortex that extends from T3 to L2, together with an intense region of bulk recirculating flow from C7 to T3. In subject 3, a complicated pattern of multiple Lagrangian vortices extends from C1 to T8, whereas caudally from T8, only a very weak bulk motion is observed. This metameric distribution of bulk flow velocity is even more emphasized in subject 4, for which the region of intense bulk flow is limited to a single vortex extending between C6 and T3.

Streamlines and direction for bulk (mean Lagrangian) flow in subject 1 in the first and second positions and in 3 other subjects. In subject 1, bulk flow patterns change with the change in spine position. The other subjects illustrate variations of the pattern of bulk vortices, which generally have greater numbers of streamlines (higher magnitude of the bulk flow velocity) in the cervical and upper thoracic region and the least in the lumbar region (lower magnitude of the bulk flow velocity). Generally, different vortex rotations are present in the cervical, thoracic, and lumbar regions though the patterns differ.
Our results indicate that the long-term transport of solute particles, which occurs along the streamlines shown in Fig 4 with a velocity proportional to the local streamline interspacing, changes drastically between different subjects and subject postures. In all cases, the location and spatial extent of these Lagrangian vortices are strongly correlated with the location where the eccentricity of the spinal cord changes from posterior to anterior and vice versa.
Discussion
Our analysis shows that CSF bulk flow in the SSAS, responsible for the convective transport of solute particles, exhibits distinct patterns (Lagrangian vortices) in the cervical, thoracic, and lumbar regions. The location and interconnectivity of these zones strongly depend on cord eccentricity. The bulk flow velocity varies from region to region along the spinal canal, being higher in the Lagrangian vortices closer to the foramen magnum and progressively lower in the thoracic and lumbar regions, where velocity is 2–3 orders of magnitude (∼100–1000 times) smaller than in the cervical region. Bulk flow patterns and velocities vary from individual to individual and with posture, suggesting that these differences may be the most important factor in the variability of the movement of solutes and drugs in the SSAS.
Our study has a small number of subjects exhibiting anatomic variations that are probably within the normal range. The analysis needs to be extended to a larger number of subjects to investigate reproducibility and to determine how specific variations in spine curvature and spine pathology affect flow. Future studies should also consider modulation of the intracranial pressure by the respiratory cycle, resulting in a smaller additional component of the oscillation of the CSF in the spinal canal at a lower frequency (12–18 cycles per minute in adults).21⇓–23 In our analysis, we have assumed that the compliance of the canal varies only with the longitudinal distance along the canal. There might be an additional azimuthal dependency associated with the nonuniform distribution of fatty tissue along the perimeter of the canal. Our mathematical model also does not account for the effects associated with the presence of microanatomic features, such as nerve roots and denticulate ligaments, which may contribute to additional local mixing, especially in the cervical region where velocities are greatest,20, 24⇓–26 thereby promoting interaction between adjacent Lagrangian vortices.
Our flow analysis, showing peaking of oscillatory flow in the midline anterior to anterolateral subarachnoid space in the mid and upper cervical spine, is in agreement with previous observations.4,27 Previous reports have illustrated a craniocaudal flow of CSF in the anterior subarachnoid space and in a caudocranial direction in the posterior subarachnoid space.6 Some previous publications have illustrated more complex bulk CSF flow such as a sinuous caudocranial current.8 The mechanism by which CSF has a net bulk flow in both craniocaudal and caudocranial directions and the presence of Lagrangian vortices have not, to our knowledge, been reported previously.
Conclusions
Bulk flow is key to the normal functioning of the CNS and to the transport of drugs, anesthetics, and chemotherapeutic agents in the SSAS. The existence of Lagrangian vortices, in which fluid particles may be retained for long periods, can have important implications for intrathecal drug delivery.28,29 Studies of flow patterns in a subject can potentially benefit intrathecal drug-delivery protocols, for example, through the identification of optimal injection sites to place a drug centrally into a Lagrangian vortex or into a cephalad- or caudal-oriented bulk stream. Patient posture has also been shown to affect the motion of the CSF and the dispersion of the drug in the spinal canal.30,31 It is clear that the knowledge acquired through patient-specific analyses of bulk CSF motion on the grounds of rigorous mathematical theory and subject-specific anatomic measurements can help improve the effectiveness and predictability of intrathecal drug delivery treatments in the future.
Footnotes
C.M.-B. acknowledges the financial support provided by the Spanish MINECO (Secretaría de Estado de Investigación, Desarrollo e Innovación) through grant DPI2017-88201-C3-2-R, co-financed by the European Regional Development Fund (ERDF).
REFERENCES
- Received February 22, 2019.
- Accepted after revision May 8, 2019.
- © 2019 by American Journal of Neuroradiology


