
Abstract
BACKGROUND AND PURPOSE: When mapping the ischemic core and penumbra in patients with acute ischemic stroke using perfusion imaging, the core is currently delineated by applying the same threshold value for relative CBF at all time points from onset to imaging. We investigated whether the degree of perfusion abnormality and optimal perfusion parameter thresholds for defining ischemic core vary with time from onset to imaging.
MATERIALS AND METHODS: In a prospectively maintained registry, consecutive patients were analyzed who had ICA or M1 occlusion, baseline perfusion and diffusion MR imaging, treatment with IV tPA and/or endovascular thrombectomy, and a witnessed, well-documented time of onset. Ten superficial and deep MCA ROIs were analyzed in ADC and perfusion-weighted images.
RESULTS: Among the 66 patients meeting entry criteria, onset-to-imaging time was 162 minutes (range, 94–326 minutes). Of the 660 ROIs analyzed, 164 (24.8%) showed severely or moderately reduced ADC (ADC ≤ 620, ischemic core), and 496 (75.2%), mildly reduced or normal ADC (ADC > 620). In ischemic core ADC regions, longer onset-to-imaging times were associated with more highly abnormal perfusion parameters–relative CBF: Spearman correlation, r = –0.22, P = .005; relative CBV: r = –0.41, P < .001; MTT: – r = –0.29, P < .001; and time-to-maximum: r = 0.35, P < .001. As onset-to-imaging times increased, the best cutoff values for relative CBF and relative CBV to discriminate core from noncore tissue became progressively lower and overall accuracy of the core tissue definition increased.
CONCLUSIONS: Perfusion abnormalities in ischemic core regions become progressively more abnormal with longer intervals from onset to imaging. Perfusion parameter value thresholds that best delineate ischemic core are more severely abnormal and have higher accuracy with longer onset-to-imaging times.
ABBREVIATIONS:
- AUC
- area under the ROC curve
- OTI
- onset to imaging
- rCBF
- relative cerebral blood flow
- rCBV
- relative cerebral blood volume
- ROC
- receiver operating characteristic
- Tmax
- time-to-maximum
Imaging of the mismatch between ischemic core and penumbra is now a proved means to identify late-presenting patients with acute ischemic stroke who will benefit from intravenous thrombolysis 4.5–9 hours after onset1 and endovascular thrombectomy 6–24 hours after onset.2,3 A favorable mismatch profile is a small ischemic core of irreversibly infarcted tissue and a large penumbra of threatened-but-salvageable tissue. Conversely, large ischemic core volume on DWI or CT perfusion imaging and a small volume of salvageable penumbral tissue on multimodal MR imaging or CT are associated with unfavorable clinical outcomes.4⇓-6
When DWI is used to define the ischemic core, the volume and degree of ADC change directly reflect the total duration and intensity of ischemia experienced from stroke onset until the moment of imaging. Accordingly, the volume of tissue with low ADC values reflects both the time from stroke onset to imaging (OTI) and the varying degrees of hypoperfusion during this interval.7,8
However, when perfusion imaging is used to define the ischemic core, the situation is very different. Perfusion imaging primarily provides a physiologic snapshot of 1 moment in time, indexing the physiologic conditions present at the time of imaging rather than integrating total ischemia time and intensity until imaging. Preclinical studies in stroke animal models have found that the degree of cerebral blood flow impairment worsens with time in infarct core regions,9,10 suggesting that perfusion parameters used to distinguish core from noncore may vary as OTI time intervals vary. Studies in patients with acute ischemic stroke have not elucidated well whether the perfusion value thresholds that best demarcate irreversible infarcted core from salvageable penumbra tissue are time-invariant or time-dependent.
Studies of perfusion imaging strategies for identifying infarct core have found that when comparing different perfusion parameters, the degree of relative cerebral blood flow (rCBF) reduction is the best variable to use.11 Commonly, the threshold of rCBF of <30% is used for detecting ischemic core. This perfusion threshold has been defined regardless of time from onset.
The purpose of this study was to evaluate whether optimal perfusion thresholds for ischemic core vary with OTI time.
MATERIALS AND METHODS
Subjects
In a prospectively maintained registry, we identified consecutive patients with acute ischemic stroke between July 2011 and October 2016 meeting the following eligibility criteria: 1) treatment with IV tPA and/or endovascular thrombectomy, 2) both DWI and PWI performed before reperfusion therapy, 3) occlusion of the ICA or MCA M1 segment on initial MR angiography, and 4) witnessed onset while awake permitting reliable assessment of clinical onset time. Patients who received IV tPA from an outside hospital and were then transferred to our center were included if the initial MR angiography showed ICA or M1 occlusion. The study was approved by the institutional review board in David Geffen School of Medicine at University of California Los Angeles for conduction under a waiver of consent for a minimal-risk study analyzing clinically collected data.
Image Acquisition and Processing
During this study, standard care at our institution included using MR imaging as the initial technique for assessment of patients with acute ischemic stroke whenever possible. If a patient had a contraindication to MR imaging, such as a pacemaker or cardiorespiratory instability, CT was instead performed. MR imaging studies were performed on a 1.5-T (Magnetom Vision+, Sonata or Symphony) or 3-T (Magnetom Trio) MRI (Siemens Medical Systems, Erlangen,Germany). The standard stroke MR imaging protocol included DWI, gradient recalled-echo, FLAIR, PWI, and MR angiography of the cervical and intracranial vessels. MR imaging without PWI was performed if the patient was not eligible for contrast, such as having contrast allergy or renal dysfunction. DWI was obtained with 2 levels of diffusion sensitization (b values = 0 and 1000 s/mm2, 5- to 7-mm section thickness, and no gap). PWI was performed using an axial dynamic gradient-echo echo-planar perfusion-weighted se-quence. If indicated, tPA was started in the scanner after the DWI and gradient recalled-echo sequences and before the remaining acquisitions, to expedite therapy initiation.
PWI data were postprocessed using Olea Sphere (Olea Medical). The arterial input function in each patient was automatically selected, with the selection reviewed by the imaging analyst. If the automatically selected arterial input function was not in an appropriate location, another arterial input function was selected manually in the proximal segment of the MCA contralateral to the occlusion side. The Oscillation Singular Value Decomposition (oSVD) technique was used as a deconvolution method, and the deconvoluted perfusion parameters (CBF, CBV, MTT, and time-to-maximum [Tmax]) were calculated.
Quantitative Analysis
For quantitative analysis, a vascular neurologist (T.Y.) who was blinded to clinical data and other images including FLAIR images, assessed the imaging data. Quantitative measurement of ADC and perfusion values was performed with imaging software (Horos, Version 3.1.2; Horos Project; https://horosproject.org/), using small circular ROIs with areas of 50 mm2. First, 10 ROIs were placed on ADC images in anatomically defined regions over the MCA territory, similar to those defined by the ASPECTS, at 2 section levels, 1 at the level of the thalamus and basal ganglia and 1 just rostral to the ganglionic structures. The 10 ROIs were located at the caudate, lentiform, internal capsule, insular ribbon, inferior anterior MCA cortex (M1), MCA cortex lateral to the insular ribbon (M2), inferior posterior MCA cortex (M3), superior anterior MCA cortex (M4), superior lateral MCA cortex (M5), and superior posterior MCA cortex (M6) (Fig 1). Then ROIs of the same size and location were placed on the PWI maps, including CBF, CBV, MTT, and Tmax images. If an ROI placement included pixels of large vessels or artifacts, the ROI was moved manually, avoiding these elements at the discretion of the operator’s visual analysis, using a maximum CBF threshold value of 70 or 80 mL/100 × g. We used rCBF for the CBF evaluation because previous studies have shown that rCBF is superior for assessing ischemic lesions to absolute CBF11 and rCBF is more widely used in the clinical care of patients with acute stroke. rCBF was calculated as ipsilateral CBF/contralateral CBF; and contralateral CBF was measured in the mirrored region. Relative CBV (rCBV) was similarly calculated and used for CBV evaluation. Finally, we used rCBF, rCBV, MTT, and Tmax for analysis as perfusion values.

ROI placement. ROIs are shown as green circles on the ADC map (left) and black and white CBF map (middle). The color-coded CBF map is shown on the right. In addition to these maps, identical ROIs were placed on CBV, MTT, and Tmax maps.
Statistical Analysis
All ROIs were categorized between 2 groups according to ADC values; ROIs with ADC < 620 were assigned to the moderate-to-severely reduced ADC group, and ADC ≥ 620, to the normal-to-mildly reduced ADC group. The χ2 test for categoric variables and a Wilcoxon rank sum test for continuous variables were used to compare the study characteristics associated with the ADC categories. To assess the relationship between PWI values and time from onset to MR imaging, we performed a Spearman correlation coefficient analysis between each PWI value and the OTI time. Because multiple ROIs were included for a patient, Huber-White standard errors clustered on patient identifiers were used to account for within-person correlations. In addition, patients were divided into 3 groups according to the OTI time: <180 minutes, 180–360 minutes, and >360 minutes. A Wilcoxon rank sum test was performed to compare PWI values between each time group. To evaluate whether accuracy and optimal thresholds for defining ischemic core are dependent on time, receiver operating characteristic (ROC) curve analysis for ADC < 620 was performed in each time group. The area under the ROC curve (AUC), sensitivity, and specificity were calculated for each PWI value. The best cutoff points were calculated using the Youden Index, assigning equal weights to specificity and sensitivity. We used χ2 statistics to compare the AUC between each OTI time group. Statistical analysis was performed using JMP Pro 13.0.0 statistical software (SAS Institute) and STATA 15.1 (StataCorp). P < .05 indicated a significant difference.
RESULTS
During the study period, 472 patients were treated with IV tPA and/or endovascular thrombectomy, among whom 228 had acute ICA or M1 occlusion. Of these, 74 underwent CT rather than MR imaging, 37 had MR imaging but without PWI sequences, 8 had poor-quality MR imaging acquisitions due to body movement or artifacts, and 43 had unclear onset times. Accordingly, 66 patients met the full study inclusion criteria, and 660 ROIs were analyzed. A flow diagram for inclusion in this study is shown in On-line Fig 1.
The median age of patients was 74 years (interquartile range, 64.5–83 years). Forty patients (60.6%) were women. Occlusion location was the ICA in 30 patients (45.4%), the proximal M1 in 15 patients (22.7%), and the distal M1 in 21 patients (31.8%). Laterality was left-sided occlusion in 34 (51.5%) and right-sided in 32 patients (48.5%). The mean baseline NIHSS score was 15.4 ± 8.2. Atrial fibrillation was present in 42 (63.6%) patients. The median time from onset to DWI was 162 minutes (interquartile range, 94–325.5 minutes; range, 69–664 minutes).
ROIs with Low and Normal ADCs
Of 660 ROIs, 164 (24.8%) were categorized to severely-moderately reduced ADC, and 496 (75.2%), to mildly reduced–normal, with characteristics shown in On-line Table 1. Severely-moderately reduced ADC regions were characterized by more frequent left-brain laterality and more frequent involvement of lentiform, internal capsule, and insular ribbon regions and less frequent involvement of the posterior MCA cortex regions, lower rCBF, lower rCBV, and higher Tmax. Time from onset to imaging did not differ among the ADC groups.
ROC curve analysis for ischemic core regions (ADC ≤ 620)
Relationship Between Each PWI Value and Time from Onset to MR Imaging
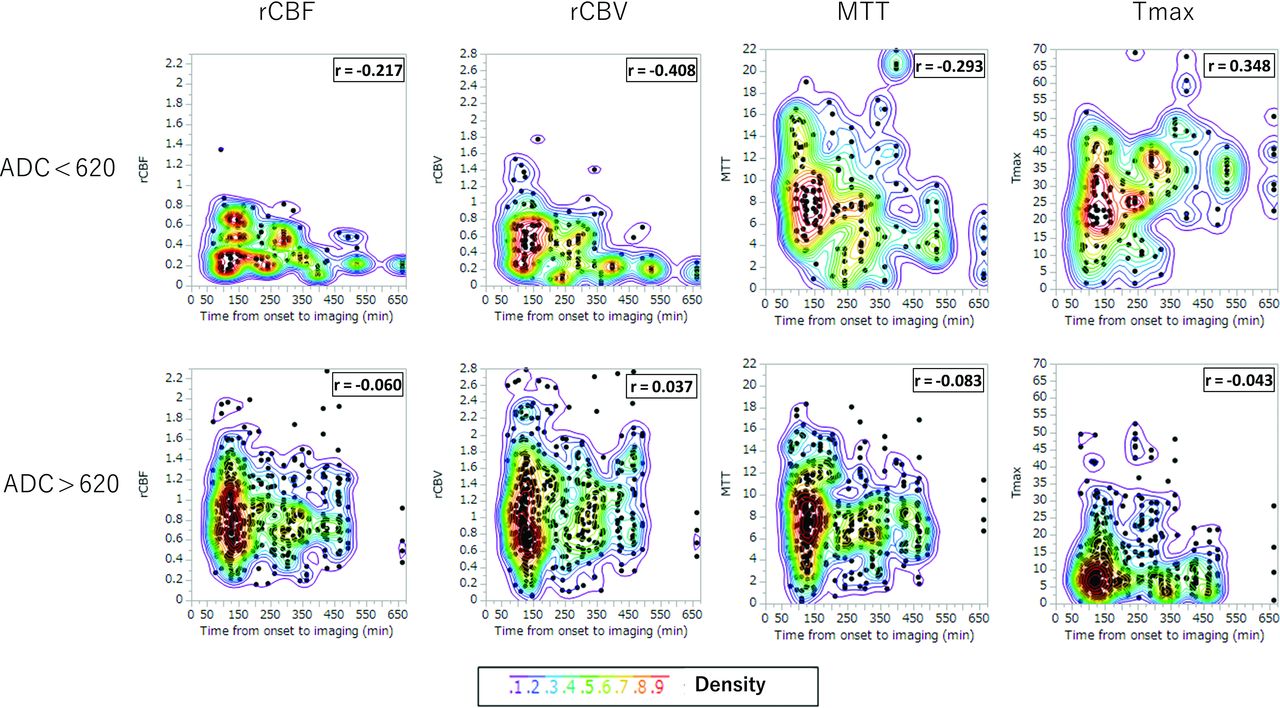
Figure 2 shows the relation between OTI time and perfusion parameters. In ROIs with severely-moderately reduced ADC, longer OTI time was associated with more greatly reduced rCBF (Spearman correlation, r = −0.217, P = .005), rCBV (r = −0.408, P < .001), and MTT (r = −0.293, P < .001), and more greatly prolonged Tmax (r = 0.348, P < .001) (On-line Table 2). Huber-White standard errors clustered on patient identifiers showed the same correlation in rCBF (P = .029), rCBV (P = .006), and Tmax (P = .001); however, there was no significant correlation in MTT (P = .231). In contrast, no significant relationship was noted in both a Spearman correlation coefficient analysis and Huber-White standard errors between OTI and perfusion parameters in mildly reduced–normal ADC areas.

Scatterplot of ROI perfusion parameter values and onset-to-imaging time for 660 ROIs, separately for severely-moderately reduced ADC (ADC ≤ 620, upper row) and mildly reduced–normal ADC (ADC > 620, lower row). Colors indicate the density of points, increasing from blue to green to yellow to red.
To evaluate broad regional effects, we clustered ROIs into an MCA cortical group (M1–M6) and a deep group (caudate, lentiform, internal capsule, insular ribbon). The association of OTI and perfusion parameters was present for all 4 perfusion parameters for the deep group and 3 of 4 perfusion parameters for the MCA cortical group (rCBV, MTT, and Tmax, but not rCBF; On-line Table 2 and On-line Fig 2).
Considering the 3 OTI categories (<180 minutes, 180–360 minutes, >360 minutes), similar patterns were seen in the continuous analysis of OTI. Longer OTI time windows were associated with lower rCBF, rCBV, and MTT and higher Tmax in regions with severely-moderately reduced ADC (Fig 3).

Boxplots of perfusion parameters according to categoric time from onset to imaging, <180 minutes (n = 33), 180–360 minutes (n = 21), and >360 minutes (n = 12). The asterisk indicates statistical significance (P < .05) in a Wilcoxon rank sum test between each onset-to-imaging time group.
ROC Curve Analysis
In ROC analysis, perfusion parameter ability to identify ROIs with ADC < 620, rCBF, rCBV, and Tmax all performed comparably with AUC of 0.89 (95% CI, 0.86–0.91), 0.85 (95% CI, 0.81–0.88), and 0.85 (95% CI, 0.81–0.88) (Table). In contrast, the MTT did not reach statistical significance. With regard to the relation between OTI time, both the predictive performance and the best threshold values for rCBF, rCBV, and Tmax changed across the 3 OTI time windows. The predictive accuracy of the parameters improved; for example, the AUCs of rCBF for <180 minutes, 180–360 minutes, and >360 minutes were 0.85 (95% CI, 0.79–0.89), 0.90 (95% CI, 0.85–0.93), and 0.97 (95% CI, 0.93–0.98). In addition, for rCBF and rCBV, the best threshold increased to more severely abnormal values with longer OTI times. For example, for rCBF, the best thresholds for <180 minutes, 180–360 minutes, and >360 minutes were reductions of 72%, 60%, and 48%. In contrast, for Tmax, the best thresholds were similar for <180 minutes (the best thresholds 18.6) and >360 minutes (18.7) and higher for 180–360 minutes (22.2).
DISCUSSION
This study of patients with acute ischemic stroke imaged between 1 hour 9 minutes to 11 hours 4 minutes from the defined onset time had 3 notable findings regarding the relation between OTI time and cerebral perfusion parameters: First, in regions that had progressed to irreversible infarction (ADC < 620), perfusion parameter values varied with OTI time, with long OTI times associated with more severely reduced rCBF and rCBV and more severely prolonged Tmax, as well as a shorter MTT. In contrast, perfusion parameters did not vary with time to imaging in regions with relatively preserved tissue bioenergetics. Second, the accuracy with which rCBF, rCBV, and Tmax perfusion parameters could define the ischemic core improved with longer OTI times. Third, the best thresholds to apply to these perfusion parameters to distinguish infarct core from tissue with relatively preserved ADC were increasingly abnormal values with longer OTI times.
These findings were achieved, in part, by the use in the current study of MR perfusion imaging to investigate the ability of perfusion parameters to delineate ischemic core. Most prior studies of perfusion-defined core have focused on CT perfusion imaging, which lacks the more direct assessment of infarct core afforded by diffusion MR images.12⇓–14 By evaluating perfusion parameters with MR imaging instead of CT acquisitions, we were able to compare perfusion findings with concurrently obtained diffusion MR images. In contrast, CT studies must use follow-up imaging after successful reperfusion to distinguish retroactively tissues that were core versus noncore, an approach with greater noise arising from incomplete reperfusion in many cases and from further progression of infarct during the interval between initial perfusion imaging and therapeutic reperfusion. As a result, most CT perfusion studies evaluating the temporal influence on CT perfusion thresholds for infarct core have focused on variations in the time interval from imaging to reperfusion, rather than the time interval from onset to imaging.
Several prior MR imaging studies have evaluated the aspects of the relationship between diffusion and perfusion findings on initial imaging but did not study the variation with OTI. For example, studies have found the following: Low ADC values are associated with low PWI CBF values;15 PWI measures of ischemia severity can differentiate ischemic core from penumbra with good accuracy;16 and rCBF is a well-performing perfusion parameter for assessing infarct core.11 Our non-OTI-related findings that showed that rCBF had the highest AUC for infarct core are consonant with these prior investigations. In previous studies using CT perfusion and DWI, the best rCBF thresholds to distinguish ischemic core ranged widely, from 16%17 to 50%.18 Our finding that the best threshold value varies with OTI helps to explain these discrepancies. The optimal cutoff point of rCBF values for identifying infarct core in our study tended to be less severely abnormal than those in previous reports. Several reasons could explain this difference. Most prior studies obtained CT perfusion first, followed by DWI, so the identified parameter cutoffs reflect not only infarct core present at the time of perfusion imaging but also infarct core evolving in the interim. Varied trajectories of infarct growth during this interval would improve cerebral blood flow so that cerebral ischemia infarct progression could transpire between the imaging timepoints.
Some prior studies determined thresholds discriminating tissue status at the individual voxel level while we evaluated discrimination of 10 distinct ROIs within the MCA territory. Averaging of perfusion values arising from individual voxels with ADC values higher than the rest of the ROIs would tend to increase threshold values. Some previous studies derived rCBF and rCBV values using automatically selected ROIs in the contralateral hemisphere that were not manually reviewed and revised to avoid inclusion of voxels within large vessels. Intravascular contralateral voxels would cause contralateral CBF and CBV values to be artifactually high and thereby cause rCBF and rCBV values to be artifactually low.
The worsening of perfusion parameters in infarct core regions with longer times since onset likely reflects several physiologic processes. The progressive extent of infarction within infarct core regions, including loss of islands of bioenergetically preserved tissue, leads to reduced metabolic demand for blood flow. Progressive ischemic injury to vascular endothelial tissues within infarct core regions leads to greater compromise of cerebral flow autoregulation, as well as capillary-arteriolar swelling with loss of vessel lumen and increased vascular resistance to flow. In addition, in some patients, progressive collateral failure arises because patients with mild cardiomyopathy are unable to sustain indefinitely increased cardiac output as a component of the stress response to the acute physiologic alteration. Our findings in human patients are consistent with preclinical animal stroke model studies also showing that CBF declines with longer time from onset.9,10 Our results showed that the stronger association of OTI and CBF was found in the basal ganglia rather than the cortical region. There was a tendency of CBF to decline with longer time from onset in cortical regions, but it was not statistically significant. A previous animal study also showed a significant decrease with time of the CBF in the caudate and putamen, whereas the cortex showed no significant decline.9 Because CBF depends on some factors such as leptomeningeal collaterals, these results indicate that the CBF decline in basal ganglia core regions directly reflects these physiologic processes.
The findings of this study have potential implications for clinical practice. In patients with acute ischemic stroke in whom ischemic core is being defined by perfusion rather than diffusion parameters, most commonly with CT imaging, the accuracy of the ischemic core definition will increase with longer OTI times. Clinicians should recognize that maps of the ischemic core in patients imaged early after onset will be less reliable. In addition, because the best perfusion parameter threshold values for delineating ischemic core vary with time from onset, CT perfusion imaging protocols may be optimized using cutoff values specific to each patient’s time from the definite or best-estimated clinical onset time. In addition, our findings have potential applicability for MR imaging strategies as well. In patients with undocumented onset time, when regions with low ADC values still have relatively high rCBF and rCBV values, it is likely that the actual time of onset was recent.
This study has strengths and limitations. Strengths include rater review and revision of the placement of small circular ROIs for matched analysis of DWI and PWI. These small ROIs permitted sampling of defined anatomic regions, avoidance of overlap with other ROIs, and exclusion of large vessels and artifacts, avoiding confounds that can arise from unsupervised automatic ROI placement. A limitation is that this was a retrospective study for prospectively collected consecutive patients and single-reader-evaluated images. The reader was well-trained for MR imaging and perfusion imaging and blinded to clinical data; however, this feature may be a limitation of this study. Another limitation is that the ROIs included both gray and white matter. Although superficial and deep lesion sites could be analyzed separately, analysis of pure gray matter and pure white matter voxels was not possible. An additional limitation is that most OTI times analyzed were in the first 8 hours after onset. This is the time when most patients eligible for reperfusion therapy present, but exploration of temporal effects in later time periods 8–24 hours after onset was limited. In addition, the ADC threshold of 620 used to distinguish ischemic core from noncore is known to not perfectly discriminate these regions. This threshold was selected because multiple studies have demonstrated that it is among the best-performing ADC cutoff points and it is the threshold most widely used for MR core imaging in routine clinical practice.
CONCLUSIONS
We showed relationships between perfusion and time from onset. Perfusion values in normal-to-mildly reduced ADC areas have no relationship with the time from onset. In contrast, each perfusion value in a low ADC area depends on time. The accuracy and optimal thresholds for ischemic core in perfusion images depend on time. Thus, time from onset should be considered for evaluating the ischemic core using perfusion imaging modalities.
Acknowledgments
We thank the patients who participated in this research and their families as well as Yasuyuki Kaga (EPS Corp) for advice with statistical analysis.
Footnotes
Paper previously presented, in part, at Annual Meeting of the International Stroke Conference, Honolulu, Hawaii 2019; February 6–8.
Disclosures: Yannan Yu—UNRELATED: Employment: Stanford University; Grants/Grants Pending: Stanford University. David S. Liebeskind—UNRELATED: Consultancy: Cerenovus, Genentech, Medtronic, Stryker, Vesalio, Comments: Imaging Core Lab.
References
- Received March 22, 2020.
- Accepted after revision June 29, 2020.
- © 2020 by American Journal of Neuroradiology


Jump to section
Related Articles
Cited By...
- No citing articles found.