
Abstract
BACKGROUND AND PURPOSE: Cortical amyloid quantification on PET by using the standardized uptake value ratio is valuable for research studies and clinical trials in Alzheimer disease. However, it is resource intensive, requiring co-registered MR imaging data and specialized segmentation software. We investigated the use of deep learning to automatically quantify standardized uptake value ratio and used this for classification.
MATERIALS AND METHODS: Using the Alzheimer’s Disease Neuroimaging Initiative dataset, we identified 2582 18F-florbetapir PET scans, which were separated into positive and negative cases by using a standardized uptake value ratio threshold of 1.1. We trained convolutional neural networks (ResNet-50 and ResNet-152) to predict standardized uptake value ratio and classify amyloid status. We assessed performance based on network depth, number of PET input slices, and use of ImageNet pretraining. We also assessed human performance with 3 readers in a subset of 100 randomly selected cases.
RESULTS: We have found that 48% of cases were amyloid positive. The best performance was seen for ResNet-50 by using regression before classification, 3 input PET slices, and pretraining, with a standardized uptake value ratio root-mean-square error of 0.054, corresponding to 95.1% correct amyloid status prediction. Using more than 3 slices did not improve performance, but ImageNet initialization did. The best trained network was more accurate than humans (96% versus a mean of 88%, respectively).
CONCLUSIONS: Deep learning algorithms can estimate standardized uptake value ratio and use this to classify 18F-florbetapir PET scans. Such methods have promise to automate this laborious calculation, enabling quantitative measurements rapidly and in settings without extensive image processing manpower and expertise.
ABBREVIATIONS:
- AD
- Alzheimer disease
- ADNI
- Alzheimer’s Disease Neuroimaging Initiative
- AUC
- area under the curve
- ROC
- receiver operating characteristic
- SUVR
- standardized uptake ratio value
- SPM
- Statistical Parametric Mapping
- RMSE
- root-mean-square error
- PPV
- positive predictive value
- NPV
- negative predictive value
Alzheimer disease (AD) has a large clinical impact and continues to increase in prevalence.1 While clinical judgment is essential to make the diagnosis of AD, the use of physiologic biomarkers can play an important role in ambiguous cases or to track the status of disease over time. One hallmark pathology of AD is the deposition of amyloid beta.2⇓-4 Besides the measurement of biomarkers in CSF,5 a widespread method to detect amyloid plaques is the use of PET. Recent studies6,7 have shown that the radiopharmaceutical 18F-AV-45 (florbetapir) can be used to detect amyloid beta deposition in PET scans in vivo and noninvasively, as it exhibits high affinity-specific binding to amyloid plaques.
PET imaging assessment is often performed solely in a qualitative fashion, where scans are classified as positive or negative depending on whether there is visual uptake of amyloid tracer in the cerebral cortex. However, if quantification is desired, several steps of processing are usually needed. For example, co-registered MR imaging scans may be used to identify relevant brain regions for the purposes of segmentation. One popular method for quantitatively assessing amyloid is based on cortical amyloid beta load in 4 regions (frontal, anterior/posterior cingulate, lateral parietal, and lateral temporal cortex), normalized by uptake in the whole cerebellum, a metric known as the standardized uptake value ratio (SUVR).8,9 While straightforward conceptually, in practice this is a laborious task, requiring precise co-registration, segmentation, and intensive quality control that can take many hours per case, and which is prone to errors.
We show that we can automate amyloid SUVR measurement by using a deep network and then use this to perform classification. Our approach does not require MR imaging, by using data from the PET scan only. We show that the performance is comparable to more complicated current state-of-the-art methods10,11 with an accuracy of over 95%, and we explore the importance of the number of input PET slices and pretraining with ImageNet. Finally, we show that while this task is feasible for human readers, the trained network is more accurate.
MATERIALS AND METHODS
Patient Data
We obtained all available 18F-AV-45 (florbetapir) PET scans from the Alzheimer’s Disease Neuroimaging Initiative (ADNI) as of August 2019. From the available data, we used the “advanced search” function to select the following data (“AV45 Coreg, Avg, Std Img and Vox Siz, Uniform Resolution”), which represents the co-registered average of the 20 minute acquisition that was then resized to have a uniform voxel size, with a uniform size of 160 × 160 in-plane and 96 axial slices. We downloaded all available scans in Neuroimaging Informatics Technology Initiative file format, as well as the UC Berkeley AV45 analysis to obtain SUVR (“SUMMARYSUVR_WHOLECEREBNORM”) for each case, a number which ranged roughly between 0.8 and 2.0.10,11 This calculation for each case requires many separate postprocessing steps, including registration to the patient’s MR imaging by using Statistical Parametric Mapping (SPM; http://www.fil.ion.ucl.ac.uk/spm/) software, skull-stripping, and cortical and subcortical ROI segmentation by using FreeSurfer (http://surfer.nmr.mgh.harvard.edu), and then the use of a weighted mean to calculate the final SUVR value with respect to a specific reference region. A histogram of distribution values can be viewed in Fig 1. Joshi et al12 proposed that a cutoff of 1.11 can be used to classify scans into amyloid positive and negative cases, because this value exceeds the upper 95% confidence interval for healthy subjects.
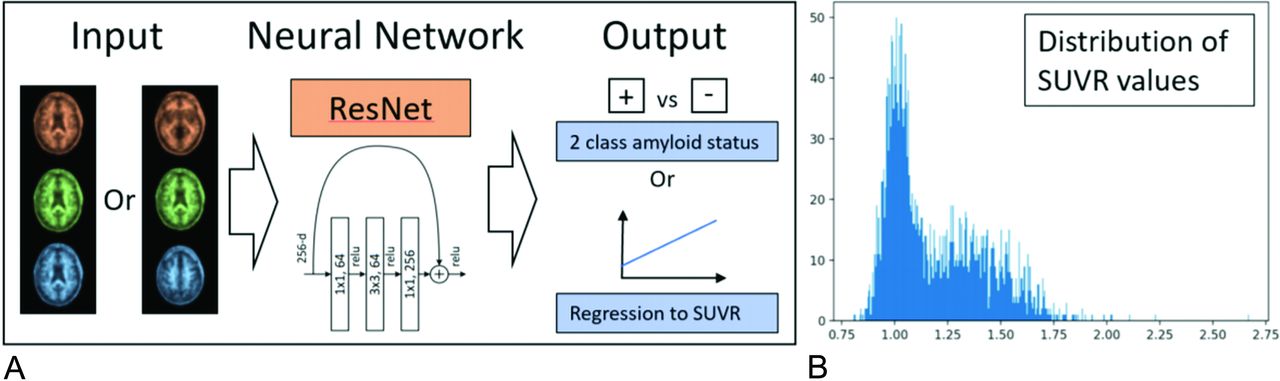
A, The input to ResNet consists of 3 or more input channels. In the case of 1 section prediction, the section is copied to all 3 color channels. If 3 slices are used as input, each color channel has an individual section. The input layer can be modified to include more slices as well. The convultional neural network can be used to predict amyloid status directly or to measure SUVR (regression). B, Histogram of all SUVR values from the cases included in this study (n = 2582).
Deep Learning Implementation
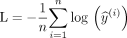
Our code was implemented in Python by using PyTorchr (https://pytorch.org/).13 We chose a residual neural network14 as our deep learning architecture. We chose a neural network depth of 50 layers, also referred to as ResNet-50. To identify whether a deeper network could improve performance, we also assessed performance by using a deeper convultional neural network with 152 layers (ResNet-152). The standard ResNet architecture ends with a layer for distinguishing 1000 differing classes. We changed this number to 2 classes when our aim was to predict amyloid status (classification), and used a log softmax activation function with a loss function based on negative log likelihood:
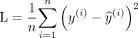
To modify ResNet for prediction of the SUVR (regression), the last, fully connected layer was changed to a single output only that is linear without any subsequent activation function. This output was then used to calculate a mean squared error loss:
During training, Adam15 was used to optimize the neural network’s parameters based on its loss via back propagation. We investigated various hyper-parameters for training and settled on an initial learning rate of 0.0001, 30 epochs, and a 10x decrease of learning rate every 10 epochs. The batch size was set to 32. Based on our data, 1 epoch resulted in 65 iterations. Experiments were run on a Stanford high-performance computing server with 32 CPU cores and 6 Nvidia GK210 graphics processors. Training ResNet-50 and ResNet-152 with the use of 1 graphics processor took 22 and 38 minutes, respectively. We additionally researched the potential benefits of transfer learning16,17 by fine-tuning ResNet weights that were pretrained by using the ImageNet dataset of natural images.18 When using ImageNet weights, we adjusted the standard deviation and mean of each channel to match the distribution of ImageNet data.
We also modified the ResNet architecture to accept a higher number of slices for input by altering the first convolutional layer. The original first layer transforms 3 input channels into 64 feature channels via 7 × 7 convolutional filters. We adjusted this layer to accommodate the number of input channels we desired. When using randomly initialized weights, we followed the standard PyTorch initialization routine for ResNet.13 When using pretrained ImageNet weights, we copied the 3-channel weights to the multiple of input channels we created. Because activations get added up, we divided the copied channel weights by number of copies created. When extending from 3 to 9 channels for example, we would divide the weights of all input channels by 3 because the activations of all input layers get added up for 1 convolution. This way, simply copying the 3-channel input to the additional channels added would result in the same activation map. We did not use 3D convolutions, as the selected slices were not adjacent and as we wanted to compare pretrained ImageNet weights.
We split the data into random subsets for training (80%, n = 2066) and testing (20%, n = 516), ensuring that all samples of 1 specific subject are in 1 subset only to avoid training and testing on the same individuals. We normalized the data before we fed it into the neural network as follows: we subtracted the mean and divided by the standard deviation of each channel individually. When using 1 section only, we chose section 50 out of 96 (slices are zero indexed). Section 50 was chosen as it is a central brain section covering the deep gray regions and cortex of many different brain lobes, ideal for assessing amyloid uptake in cortex. When training ResNet with 3 slices, we chose slices with a distance of 10 to the original section, in our case slices 40, 50, and 60. We also tested a distance of 20, as well as a distance of 40. In this preliminary test, a distance of 10 yielded the best result. For an input of 9 slices, we sampled linearly spaced slices from the entire PET scan. To this end, slices 10, 20, 30, 40, 50, 60, 70, 80 and 90 were selected. For 27-section input, the slices used were: 0, 3, 7, 10, 14, 17, 21, 25, 28, 32, 35, 39, 42, 46, 50, 53, 57, 60, 64, 67, 71, 75, 78, 82, 85, 89 and 93. Training was performed 5 times with different “seeds,” meaning that each distinct experiment varies with respect to train/test splits, initializations, and the order of training batches, to allow us to understand variability in the network.
Comparison with Human Readers
To establish the accuracy of expert human readers on this task, we enlisted 3 readers (neuroradiologist, joint nuclear medicine/radiology resident, and nuclear medicine physician), all of whom have been certified to read amyloid PET scans. They were asked to read 100 randomly selected cases from the test set as positive or negative, based only on the single gray-scale center section image as described previously. They were also timed on this task. We then compared the human readers’ performance with respect to the ground truth by using the binarized SUVR threshold method. Additionally, human performance was compared with ResNet-50, initialized via ImageNet weights, and by using the regression approach.
Statistical Analysis
The metrics for each experiment are an average over 5 seeded runs. If not stated otherwise, we calculate metrics based on test set prediction performance. Accuracy is calculated based on the standard threshold of 0.5 for binary classification, and at an SUVR threshold of 1.11 for regression. Calculation of sensitivity, specificity, positive predictive value (PPV), and negative predictive value (NPV) are calculated based on the stated thresholds. To statistically compare the different models on accuracy, sensitivity, and specificity, we constructed a linear mixed-effects model to determine the effects of model type (binary classification directly or with regression), depth of network (ResNet-50 versus ResNet-152), use of ImageNet pretraining (yes, no), and number of input slices (1, 3, 9, and 27).
RESULTS
In the 2582 18F-florbetapir PET scans, the mean SUVR value was 1.19 [IQR 1.01–1.36] (Fig 2). When differentiated by amyloid status by using the SUVR 1.11 threshold, 49.8% of samples were amyloid positive. The samples were acquired from 62 different sites and 40 different types of scanners.

ROC curves test results. A, shows performance for 1-section and 3-section input data for binary classification. B, displays performance for 1- and 3-section classification via regression. All configurations use pretrained ImageNet weights.
Single Section Prediction: Binary Amyloid Status Classification
Instead of using regression, in this section we present results of training simply on the binarized categories (positive/negative) based on SUVR (Table 1). Using ResNet-50 with random weights and a single section as input, we achieved a training set accuracy of 99.95% (0.05% SD) and a test set accuracy of 92.8% (1.2% SD). Maximizing Youden J statistic yields an index of 0.865. The mean sensitivity and specificity are 89.8% and 95.9%, respectively. The area under the receiver operating characteristic curve (AUC ROC) is 0.974. Using ImageNet pretrained weights slightly improved results, achieving an accuracy of 93.4%. AUC ROC increased to 0.982, while the Youden J statistic slightly increased to 0.876. Sensitivity increased from 89.8% to 91.2%. Specificity was essentially unchanged by pretraining: 95.7% versus 95.9%.
Various test metrics for binary classification. Performance reflects mean of 5 separate seeded runs
Single Section Prediction: Regression for Amyloid Classification
For random weight initialization, regression converges to a root-mean-square error (RMSE) for SUVR prediction of 0.108 (0.014 SD). Translating this performance into amyloid status prediction by using the 1.11 cutoff value, we achieve a test set accuracy of 85.7% (2.2% SD), with Youden J statistic of 0.775 (0.044 SD). Significantly better results were achieved by using ImageNet initialization: an RMSE of 0.059 (0.005 SD) and a test accuracy of 93.8% (1.0% SD). The Youden J statistic reaches 0.896 (0.017 SD) and the AUC is 0.986 (0.007 SD). Details are found in Online Table 1.
At best performance, we misclassified approximately 25 of the 516 amyloid scans that were evaluated in the test set. For the method with best prediction (ie, regression, pretrained weights, 3 slices), we evaluated the errors in these cases and found that SUVR value predictions were generally very close to the SUVR 1.11 threshold cutoff and that the predictions of the model were still very close to ground truth. This may reflect the inherent noise in the measurement to some extent. We found that the highest RMSE (worst regression predictions) appeared in high SUVR ground truth values (>1.6). Looking at the amyloid status positive data in the test set, we find that 12% have SUVR greater than 1.6. A higher RMSE (0.117) was seen in these cases. We furthermore find that the top 10% largest RMSE regression errors had an average ground truth SUVR of 1.40. This lower accuracy for high SUVR values is not relevant to amyloid status prediction as all these cases are well over the binarization threshold.
Comparison of Different Models
Details of the mixed-effects model are shown in Table 2. There was no effect of a deeper network (152 versus 50 layers). However, there was an effect of the classification method (with regression being superior to direct binarization), pretraining (superior by using initialization with ImageNet weights), and number of input slices (see below). The ResNet-50 model by using regression, pretraining, and 3 slices as input was the best model. The analysis on input slices showed no differences among the different cases (1, 3, 9, or 27 slices) for specificity. For accuracy and sensitivity, there were significant differences between 1 and 9 or 27 slices, but no differences between 3 and 9 or 27 slices, making 3 section input the optimal choice. This is detailed in Online Table 2. Figure 3 shows performance for different combinations of pre-training, input slices, and tasks (binary classification vs. regression). Online Table 3 shows the performance of the ResNet-152 network in detail. Online Table 4 shows details of the linear mixed-effects model related to the number of input slices.
Linear mixed-effects model analysis of different methods for classifying amyloid PET imaging

Classification performance as a function of number of input slices. All results reflect the average of 5 seeded runs.
Human Reader Evaluation
An example of 10 of the 100 randomly selected reader cases is shown in Fig 4 to give a sense of the data that are being input to the network and that the human readers had available for analysis. The 3 readers performed well on the task, with accuracy of 86%, 89%, and 90%, respectively (Table 3). This compared with an accuracy of 96% for the ResNet-50, single section input, pretrained, regression model. All 4 deep network “misses” in this dataset were cases where the ground truth SUVR was very close to the 1.11 cutoff value, within 0.03 U in all cases. There were 8/100 cases in which all 3 readers classified the case opposite to the ground truth SUVR classification (6 positive and 2 negative cases based on SUVR ground truth). In these cases, the network classified them correctly 87.5% of the time (7/8 cases). The mean time for the humans to assess the 100 cases was 8.2 minutes.
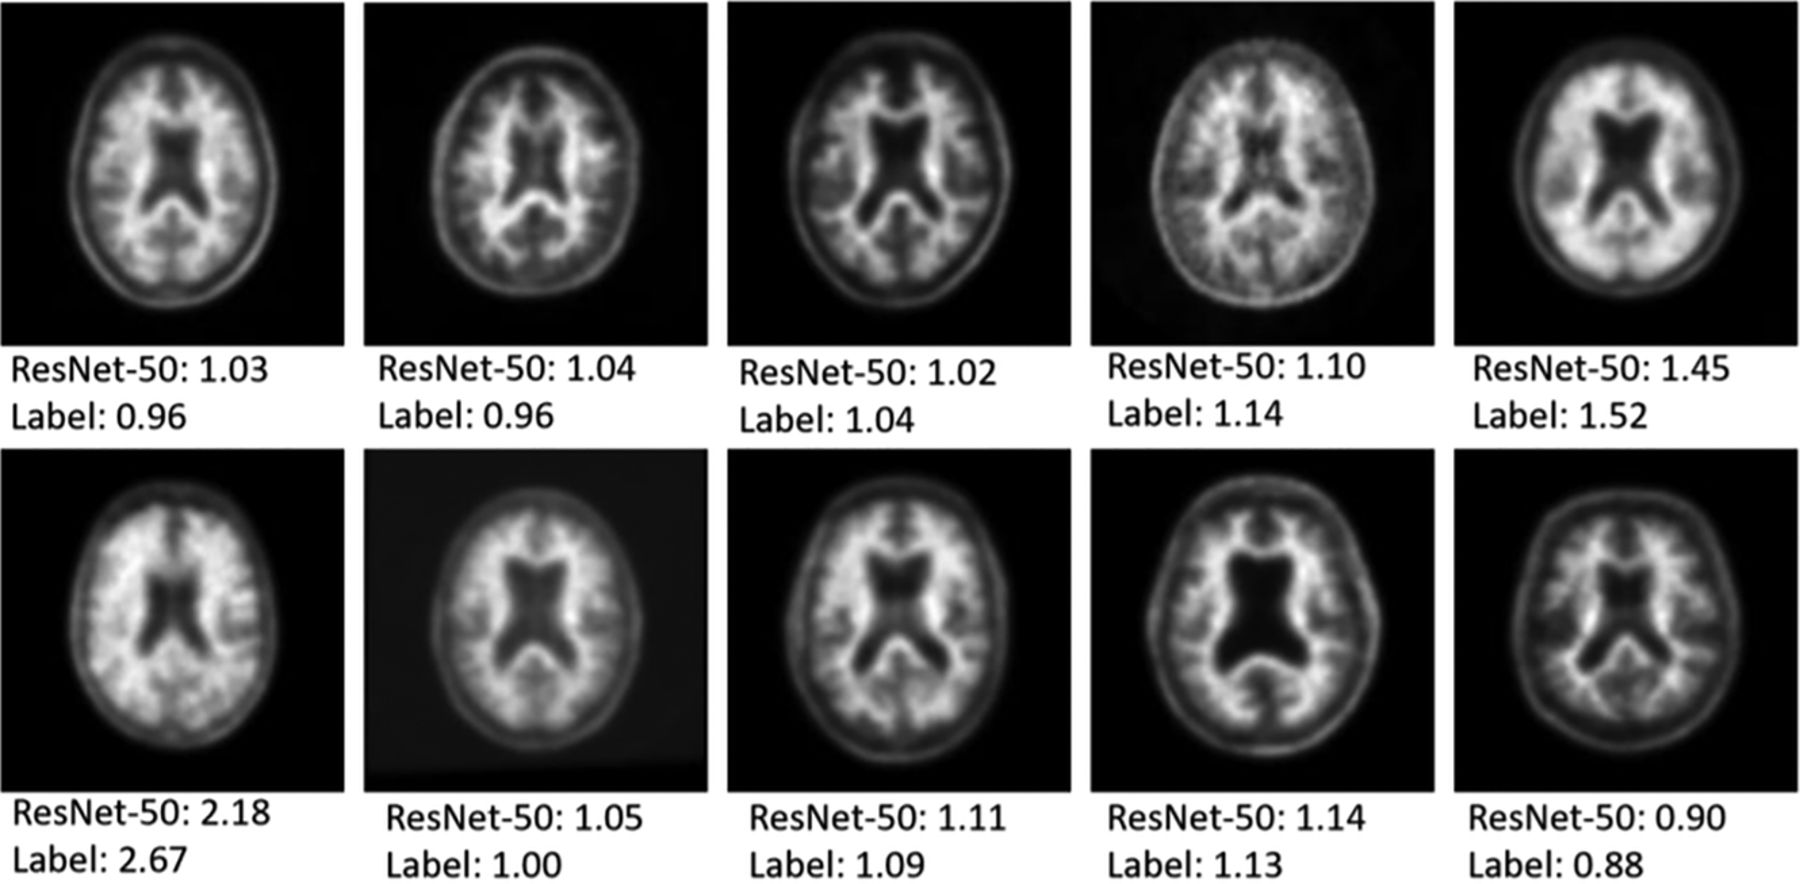
Examples of PET scans used for single section prediction. The top number represents the prediction of the network while the bottom number is the ground truth manual SUVR measurement from the ADNI data base.
Comparison of prediction performance for 100 randomly selected test set samples
DISCUSSION
In this work, we demonstrate that the use of deep learning has tremendous potential to simplify analysis of 18F-florbetapir PET scans, with the best models yielding greater than 95% accuracy on a large, balanced collection of studies collected at multiple sites and on multiple scanners. This is of value because it can help inform visual readings, allowing a fairly accurate assessment in the absence of human expertise. It should also enable more rapid quantitative assessment, which is useful for large-scale studies and longitudinal analysis. We have shown that a single central section is sufficient for high performance and that increasing the number of slices used as inputs to the model accrues only modest improvements. We demonstrated that if the network is set up as a regression task (ie, predicting SUVR and then from that classifying into positive and negative cases), that pretraining with ImageNet natural images can improve performance and improve training stability. Envisioning this as a regression task also allows a quantitative measure of error to ground truth, allowing the network to be more accurate across a wide range of SUVR values, not just those near the SUVR threshold that separates positive and negative cases. As such, it can be applied to cases across the severity spectrum, where classification may not change but quantitative variation in cortical amyloid uptake is present. Lastly, we found that increasing the capacity of the network from 50 to 152 layers did not appreciably improve performance, making this a memory efficient process. It is possible that if more data become available, a more complex model might show benefits, a common trend in deep learning classification tasks.19
Measurement of quantitative cortical amyloid uptake is important to both validate visual reads as well as to assess longitudinal changes over time. Currently, this requires a laborious process that includes MR imaging-based cortical and cerebellar segmentation by using FreeSurfer, typically requiring hours to days of processing time and human interaction, followed by co-registration of PET images into the MR imaging native space. Direct prediction is much more efficient, as evidenced by our network requiring 3 seconds to process 100 cases. As larger AD trials become the norm, this improved efficiency should be of benefit to rapidly assess outcomes and to reduce the costs of clinical trials.
It was surprising to us that adding more PET slices did not significantly improve performance. This suggests there is information on a single axial section located near the middle of the brain that enables the prediction of SUVR (which requires information from outside this section). This has the advantage of reducing the storage needs and preprocessing of PET, while also limiting the amount of data required by the model for training. It might even allow for thin-ring detectors that are being developed as MR imaging inserts for PET/MR imaging to be used.20 Our clinical reader study suggests that humans were not as good at extracting this information from a single section, with even consensus reads showing inferior performance compared with the model. Of interest, there were 8 cases in which all 3 readers disagreed with the ground truth SUVR classification; in 7 of these, the model classified the case correctly. The human readers tended to call positive cases with atrophy as negative, a known challenge with amyloid interpretation. The model could therefore be useful to support and potentially improve expert decisions with regard to binary amyloid reading, though this would require more study.
Only limited prior literature exists demonstrating deep learning performance for this task, in much smaller datasets. For example, Kang et al21 showed in a small cohort of 176 patients that they could train a VGG network to classify amyloid status with 89%–92% accuracy, though the ground truth in these cases was determined by a (single) visual read by using the brain amyloid plaque load criteria. Cattell et al22 showed 96% accuracy in a group of 264 studies by using predefined image intensity gradients combined with a support vector machine with the ground truth defined visually by 3 readers. Most other studies applying deep learning to the ADNI data base have focused on using PET imaging (FDG and amyloid) to predict clinical categories (normal, mild cognitive impairment, AD, etc.).23⇓⇓-26 While this is surely interesting, clinical assessments are known to be subjective, as evidenced by the recent results of the Imaging Dementia-Evidence for Amyloid Scanning (IDEAS) trial.27 Predicting a relevant quantitative feature such as SUVR is objective and could find use in data mining, clinical trial assessments, and longitudinal analysis.
There are several limitations to this work. While it is by far the largest study of this task, it is unclear whether the conclusions of the paper might change as more data become available (ie, deeper networks may in fact perform better given enough data). Also, the network here is not predicting a clinical judgment, but rather information that could be obtained analytically from the data itself, begging the question of whether a deep learning–based method is required for this task. The analytic process is extremely time-consuming and requires considerable expertise in image processing; the current method could be immediately used by sites without these capabilities. Furthermore, many research centers do not routinely acquire MR imaging scans and there may be challenges in co-registering PET images to older MR imaging scans of the patient, because there may be interval changes, particularly in brain atrophy. Finally, we cannot determine precisely why the performance is so good and what the remaining limitations might be; this is a problem inherent to deep learning, where visualization of the network’s inner workings is a known challenge.28 Some preliminary work we did looking at saliency maps showed that the network broadly uses the entire image, rather than focusing on the cortical ribbon as might be expected. However, given that the estimates of errors in SUVR due to the co-registration step in the traditional postprocessing methods (0.03–0.07) is on the same level of that found by using the pretrained deep learning method (0.04–0.06), showing any improvement on this metric might be limited by the ground truth accuracy.29
CONCLUSIONS
We have trained multiple deep networks showing the ability to classify and estimate SUVR on 18F-florbetapir PET imaging with good accuracy by using the large ADNI dataset. Such methods have promise for automating this laborious calculation, enabling quantitative measurements rapidly and in settings without extensive image processing manpower and expertise.
ACKNOWLEDGMENTS
Data collection and sharing for this project was funded by the Alzheimer's Disease Neuroimaging Initiative (ADNI) (National Institutes of Health Grant U01 AG024904) and DOD ADNI (Department of Defense award number W81XWH-12–2-0012). ADNI is funded by the National Institute on Aging, the National Institute of Biomedical Imaging and Bioengineering, and through generous contributions from the following: AbbVie, Alzheimer’s Association; Alzheimer’s Drug Discovery Foundation; Araclon Biotech; BioClinica, Inc.; Biogen; Bristol-Myers Squibb Company; CereSpir, Inc.; Cogstate; Eisai Inc.; Elan Pharmaceuticals, Inc.; Eli Lilly and Company; EuroImmun; F. Hoffmann-La Roche Ltd and its affiliated company Genentech, Inc.; Fujirebio; GE Healthcare; IXICO Ltd.; Janssen Alzheimer Immunotherapy Research & Development, LLC.; Johnson & Johnson Pharmaceutical Research & Development LLC.; Lumosity; Lundbeck; Merck & Co., Inc.; Meso Scale Diagnostics, LLC.; NeuroRx Research; Neurotrack Technologies; Novartis Pharmaceuticals Corporation; Pfizer Inc.; Piramal Imaging; Servier; Takeda Pharmaceutical Company; and Transition Therapeutics. The Canadian Institutes of Health Research is providing funds to support ADNI clinical sites in Canada. Private sector contributions are facilitated by the Foundation for the National Institutes of Health (www.fnih.org). The grantee organization is the Northern California Institute for Research and Education, and the study is coordinated by the Alzheimer’s Therapeutic Research Institute at the University of Southern California. ADNI data are disseminated by the Laboratory for Neuro Imaging at the University of Southern California.
Footnotes
Data used in the preparation of this article were obtained from the Alzheimer’s Disease Neuroimaging Initiative (ADNI) database (adni.loni.usc.edu). As such, the investigators within the ADNI contributed to the design and implementation of ADNI and/or provided data but did not participate in analysis or writing of this report. A complete listing of ADNI investigators can be found at: http://adni.loni.usc.edu/wp-content/uploads/how_to_apply/ADNI_Acknowledgement_List.pdf.
Disclosures: Greg Zaharchuk—RELATED: Grant: Stanford ADRC, Human-centered AI program*; Provision of Writing Assistance, Medicines, Equipment, or Administrative Support: Nvidia, Comments: GPU donation*; UNRELATED: Grants/Grants Pending: various NIH projects, GE Healthcare, Bayer Healthcare*; Payment for Development of Educational Presentations: GE Healthcare; Stock/Stock Options: Equity, Subtle Medical. *Money paid to institution.
References
- Received December 13, 2019.
- Accepted after revision March 21, 2020.
- © 2020 by American Journal of Neuroradiology


