
Abstract
BACKGROUND AND PURPOSE: Preclinical evidence points toward a metabolic reprogramming in isocitrate dehydrogenase (IDH) mutated tumor cells with down-regulation of the expression of genes that encode for glycolytic metabolism. We noninvasively investigated lactate and Cr concentrations, as well as intracellular pH using 1H/phosphorus 31 (31P) MR spectroscopy in a cohort of patients with gliomas.
MATERIALS AND METHODS: Thirty prospectively enrolled, mostly untreated patients with gliomas met the spectral quality criteria (World Health Organization II [n = 7], III [n = 16], IV [n = 7]; IDH-mutant [n = 23]; IDH wild-type [n = 7]; 1p/19q codeletion [n = 9]). MR imaging protocol included 3D 31P chemical shift imaging and 1H single-voxel spectroscopy (point-resolved spectroscopy sequence at TE = 30 ms and TE = 97 ms with optimized echo spacing for detection of 2-hydroxyglutarate) from the tumor area. Values for absolute metabolite concentrations were calculated (phantom replacement method). Intracellular pH was determined from 31P chemical shift imaging.
RESULTS: At TE = 97 ms, lactate peaks can be fitted with little impact of lipid/macromolecule contamination. We found a significant difference in lactate concentrations, lactate/Cr ratios, and intracellular pH when comparing tumor voxels of patients with IDH-mutant with those of patients with IDH wild-type gliomas, with reduced lactate levels and near-normal intracellular pH in patients with IDH-mutant gliomas. We additionally found evidence for codependent effects of 1p/19q codeletion and IDH mutations with regard to lactate concentrations for World Health Organization tumor grades II and III, with lower lactate levels in patients exhibiting the codeletion. There was no statistical significance when comparing lactate concentrations between IDH-mutant World Health Organization II and III gliomas.
CONCLUSIONS: We found indirect evidence for metabolic reprogramming in IDH-mutant tumors with significantly lower lactate concentrations compared with IDH wild-type tumors and a near-normal intracellular pH.
ABBREVIATIONS:
- ATP
- adenosine triphosphate
- CRLB
- Cramer-Rao Lower Bound
- 2-HG
- 2-hydroxyglutarate
- IDHmut
- isocitrate dehydrogenase mutant
- IDHwt
- isocitrate dehydrogenase wild-type
- MM
- macromolecules
- NHE1
- sodium-hydrogen antiporter 1
- pHi
- intracellular pH
- PRESS
- point-resolved spectroscopy sequence
- SVS
- single-voxel spectroscopy
- WHO
- World Health Organization
As first described by Otto Warburg in the 1930s, many tumor cells show increased glycolysis even in the presence of oxygen, likely through the activation of the key signaling phosphatidylinositol-3 kinase/protein kinase B-pathway and hypoxia-inducible factor α activation.1,2 In addition, some tumor cells show mitochondrial defects and are dependent on glycolytic adenosine triphosphate (ATP) production.3⇓⇓⇓⇓-8 Glycolytic cancer cells use overexpressed and/or overactivated H+‐ATPases,9⇓⇓-12 sodium-hydrogen antiporter 1 (NHE1) of the SLC9A family,13⇓⇓⇓-17 carbonic anhydrases IX and XII,18,19 and monocarboxylate‐H+ efflux cotransporters of the SLC16A family20⇓⇓-23 to export protons and Lac produced by lactate dehydrogenases as glycolytic end products.24 As a result, the proton gradient between the intracellular and extracellular space is reversed, causing an acidification of the extracellular space. The death of surrounding normal brain cells in an acidic environment increases the infiltrative potential of cancer cells.11,25
Mutations in the isocitrate dehydrogenase (IDH) 1 or IDH 2 genes define a subgroup of gliomas with prolonged overall survival and slower growth in comparison with IDH wild-type (IDHwt) tumors of the same grade.26 A profound alteration in the epigenetic profile of these tumors (G-CIMP phenotype) is considered the basis of their specific behavior. There is increasing evidence that these tumors are less glycolytic than IDHwt tumor cells.
Chesnelong et al27 were able to show an IDH mutation–dependent silencing of lactate dehydrogenase A in vitro in conjunction with down-regulation of hypoxia-inducible factor α through 2-hydroxyglutarate (2-HG) dependent promotion of hypoxia-inducible factor α degradation, examining human glioma tissues and brain tumor stem cells with pyrosequencing-based DNA methylation analysis. Using carbon 13 (13C) MR spectroscopy, the same group found that, unlike in glioblastoma cells, hyperpolarized (1-13C) Lac produced from (1-13C) pyruvate was not elevated in IDH1-mutant (IDH1mut) glioma cells. This finding was associated with lactate dehydrogenase A and monocarboxylate transporter 1 and 4 silencing.28 Izquierdo-Garcia et al29 investigated Lac levels in vitro in genetically engineered cell models transducted with a lentiviral vector coding for the wild-type IDH1 gene and for the R132H IDH1-mutant gene using 1H-MR spectroscopy. They found that intracellular Lac levels dropped significantly in the IDHmut cells compared with IDHwt (extracellular not investigated).
In accordance with these results, Khurshed et al30 observed in vitro in HCT116 IDH1wt/R132H knock-in cells that IDHmut cancer cells show a higher basal respiration compared with IDHwt cancer cells. Consequently, inhibition of the IDH mutation shifted the metabolism by decreasing oxygen consumption and increasing glycolysis. IDHwt glioma cells seem to have a typical Warburg phenotype, whereas in IDHmut glioma cells, the tricarboxylic acid cycle is the predominant metabolic pathway.
Chromosomal losses of 1p and 19q, which are observed in oligodendroglial tumors, seem to be frequently associated with IDH gene mutations.31 Codependent effects of 1p deletion and IDHmut-dependent NHE1 gene promotor methylation lead to silencing of the NHE1 gene. As a result, these tumors are more sensitive to the acid load resulting from active glycolysis. Genes of other key enzymes in glycolysis such as the glucose transporter solute carrier family 2 member 1 (SLC2A1) and the Lac transporter solute carrier family 16 member 1 (SLC16A1) are also located on 1p and affected by the 1p/19q codeletion.27
All of these results suggest a metabolic reprogramming in IDHmut tumor cells with a down-regulation of the expression of genes that encode for glycolytic metabolism.30 The aim of this study was to investigate resulting metabolic profiles in patients in vivo, by noninvasively analyzing Lac concentrations and intracellular pH (pHi) in a cohort of patients with gliomas with known molecular status.
MATERIALS AND METHODS
Study Design
We prospectively enrolled 38 patients with mostly untreated World Health Organization (WHO) II–IV gliomas. All subjects provided written informed consent, and the study was approved by our institutional review board (Ethics Committee, University Hospital Frankfurt, Germany, project No: SIN-04–2014). IDH mutation status was determined by immunostaining (IDH1 Anti-IDH1 R132 antibody), Infinium Human Methylation 450 BeadChip analysis,32 or DNA sequencing.
MR Imaging
MR imaging experiments were performed on a clinical 3T MR imaging scanner with a double-tuned 1H/31P volume head coil.
MR imaging protocols included the following sequences:
T2-weighted TSE in 3 orthogonal planes.
3D T1-weighted gradient echo.
1H decoupled 31P MR spectroscopic imaging with 3D chemical shift imaging.
2D 1H-MR spectroscopic imaging.
Two 1H single-voxel spectroscopy (SVS) point-resolved spectroscopy sequence (PRESS) measurements at TE = 30 ms and TE = 97 ms with optimized echo spacing for detection of 2-HG from the tumor area as defined on T2WI TSE.
The 2 SVS sequences were acquired from identical target positions, typically with volumes of 8 mL (20 × 20 × 20 mm), with minimal inclusion of healthy-appearing tissue and avoiding necrosis. Voxels were positioned on T2-weighted images with prior knowledge of previously acquired standard MR imaging, which included T1-weighted images after use of gadolinium-based contrast agent. Voxel placement was adjusted in 3 orthogonal planes. Details on the acquisition protocol of the sequences evaluated in this report are listed in Table 1.
Acquisition protocol of sequences evaluated in this report
Data Analysis
Spectra were reviewed independently by 2 experienced MR imaging specialists (E.H., U.P., both with >10 years of experience in MR spectroscopy) for quality, and spectra of insufficient quality (large line width, insufficient signal-to-noise, large artifacts at visual inspection) were not included in the analysis. For all remaining cases, the full width at half maximum of the Cr or Cho signal was below 0.1 ppm. Mean signal-to-noise ratio, defined here as the ratio of the maximum in the spectrum-minus-baseline over the analysis window to twice the root-mean square deviation (residuals), was 11 ± 3.8 for TE = 30 spectra and 9.8 ± 3.4 for TE = 97 spectra. Cramer-Rao Lower Bounds (CRLBs) of Cr and Cho as given by LCModel (Version 6.3-1C; http://www.lcmodel.com/) were below 15% (Cr: 97% of cases <10%; Cho: 93% of cases <10%).
1H data were analyzed in the frequency domain with LCModel.33 For single-voxel sequences at TE = 30 ms and TE = 97 ms, a 3D volume-localized basis set was simulated using NMRScopeB which is implemented in jMRUI (Version 5.2; www.mrui.uab.es/mrui/mrui_download/).34 The basis data set included 2-HG, NAA, glutamate, Cr, glutamine, Cho, mIns, and Lac in addition to the dataset for simulation of the macromolecules (MM) and lipids as provided by LCModel. We deliberately chose only 8 main metabolites in addition to MM and lipids to be included in the basis set. According to the principle of parsimony, a model with more parameters is less likely to reproducibly predict in vivo datasets with highly varying metabolites.35
Simulation was based on the assumption of a 20 × 20 × 20 mm volume, homogeneously filled with the respective metabolites. The basis set was validated with phantom data. Individual metabolite concentrations (Lac, total Cr) were calculated using the phantom replacement technique described by Tofts36 based on signal amplitudes at TE = 97 (Lac) and TE = 30 (total Cr). The correction factors cT1 and cT2 at 3T were determined from previously published data.37,38 Because the Tofts formula only provides a global correction for coil loading for transmit/receive coils and does not take local B1 variations into account, which are usually observed at 3T, the presented method can only be regarded as an estimate of the absolute concentrations. Consequently, the values must be considered as laboratory units resembling absolute concentrations in micromoles. PRESS at TE = 97 ms was primarily aimed at 2-HG detection39 but showed little-to-no lipids and MM in the Lac spectral region and the Lac peak as an inverted pseudosinglet. It was, therefore, used for Lac quantitation. For Cr quantitation, the short TE was chosen as an optimal detection time to avoid signal loss by increased T2-weighting.
pHi in predefined tumor voxels was determined from the chemical shift difference between inorganic phosphate and phosphocreatine, following the approach by Petroff et al40 as described in our previous publications.24,41
Statistics
Statistical analysis was performed with Statistica (Version 7.1; StatSoft). Lac/Cr signal ratio, absolute Lac and Cr concentrations, as well as pHi were compared using a 2-tailed unpaired t test (IDHmut versus IDHwt; IDHmut WHO II versus IDHmut WHO III [Lac only]; IDH mut and chromosomal losses 1p/19q versus IDHmut without chromosomal losses 1p/19q [Lac only]). Results were considered significant at P < .05.
RESULTS
Patient Characteristics
Overall, 30 patients completed the full MR imaging examination, and MR spectroscopy data met the quality criteria (WHO II [n = 7], III [n = 16], IV [n = 7]). Twenty-three tumors were IDHmut, and 7 tumors were IDHwt as determined by immunostaining (IDH1 R132H antibody) and/or Infinium Human Methylation 450/850K BeadChip analysis and/or gene sequencing. While there was 1 anaplastic astrocytoma, IDH wild-type (WHO III), all other IDH wild-type tumors corresponded to WHO IV. Tumors from 9 patients showed chromosomal losses of 1p and 19q as determined by fluorescence in situ hybridization and/or Infinium Human Methylation 450/850K BeadChip analysis. One patient with an IDHmut diffuse astrocytoma was excluded from SVS data analysis due to artifacts from extracranial lipid signals, while 1 patient with an IDHwt glioblastoma was excluded from Lac analysis due to considerable interference between Lac and lipids leading to CRLBs above 30% for Lac. Three patients had undergone partial resection before study inclusion, one had been treated with chemotherapy (temozolomide), and one, with radiation therapy (one of the patients with partial resection). All of the pretreated patients were those with IDHmut gliomas. Partial resection was performed 4, 14, and 44 months before study inclusion. Details on patient characteristics are listed in Table 2.
Details on patient characteristics meeting MR spectroscopy quality criteria
Representative Data
Voxel positioning on T2WI, representative in vivo single voxel MR spectroscopy spectra at TE 97 ms and TE 30 ms for tumor tissue with and without IDH mutations and with or without chromosomal losses of 1p and 19q is shown in Fig 1. MR spectroscopy data include the original spectrum, LCModel spectral fit, estimated baseline, and the individual components Lac, Cr, Lip13b, and MM12. Representative 31P MR spectroscopy spectra for tumor tissue with and without IDH mutation are shown in Fig 2. Details on voxel size for 1H SVS, tumor size, and tumor location are listed in the On-line Table.

Voxel positioning on T2WI and representative in vivo single-voxel MR spectroscopy spectra at TE = 97 ms and TE = 30 ms for tumor tissue. MR spectroscopic data include original spectrum, LCModel spectral fit, estimated baseline, residual and individual components, Lac, Cr, 2-HG, Lip13b, and MM12 when applicable. Patient A shows evidence of possible codependent effects of 1p deletion and IDH mutations on cell metabolism, with a particularly small lactate signal. With only 1 secondary (IDHmut) glioblastoma in our cohort (patient B), we were unable to statistically compare the effects between IDHmut and IDHwt glioblastoma as well as IDHmut WHO III and WHO IV gliomas. The relatively high Lac signal of patient B suggests additional effects of highly malignant features such as a selective advantage of tumors cells with higher rates of glycolysis in neovascularized, hypoxic regions and tumor cell necrosis.

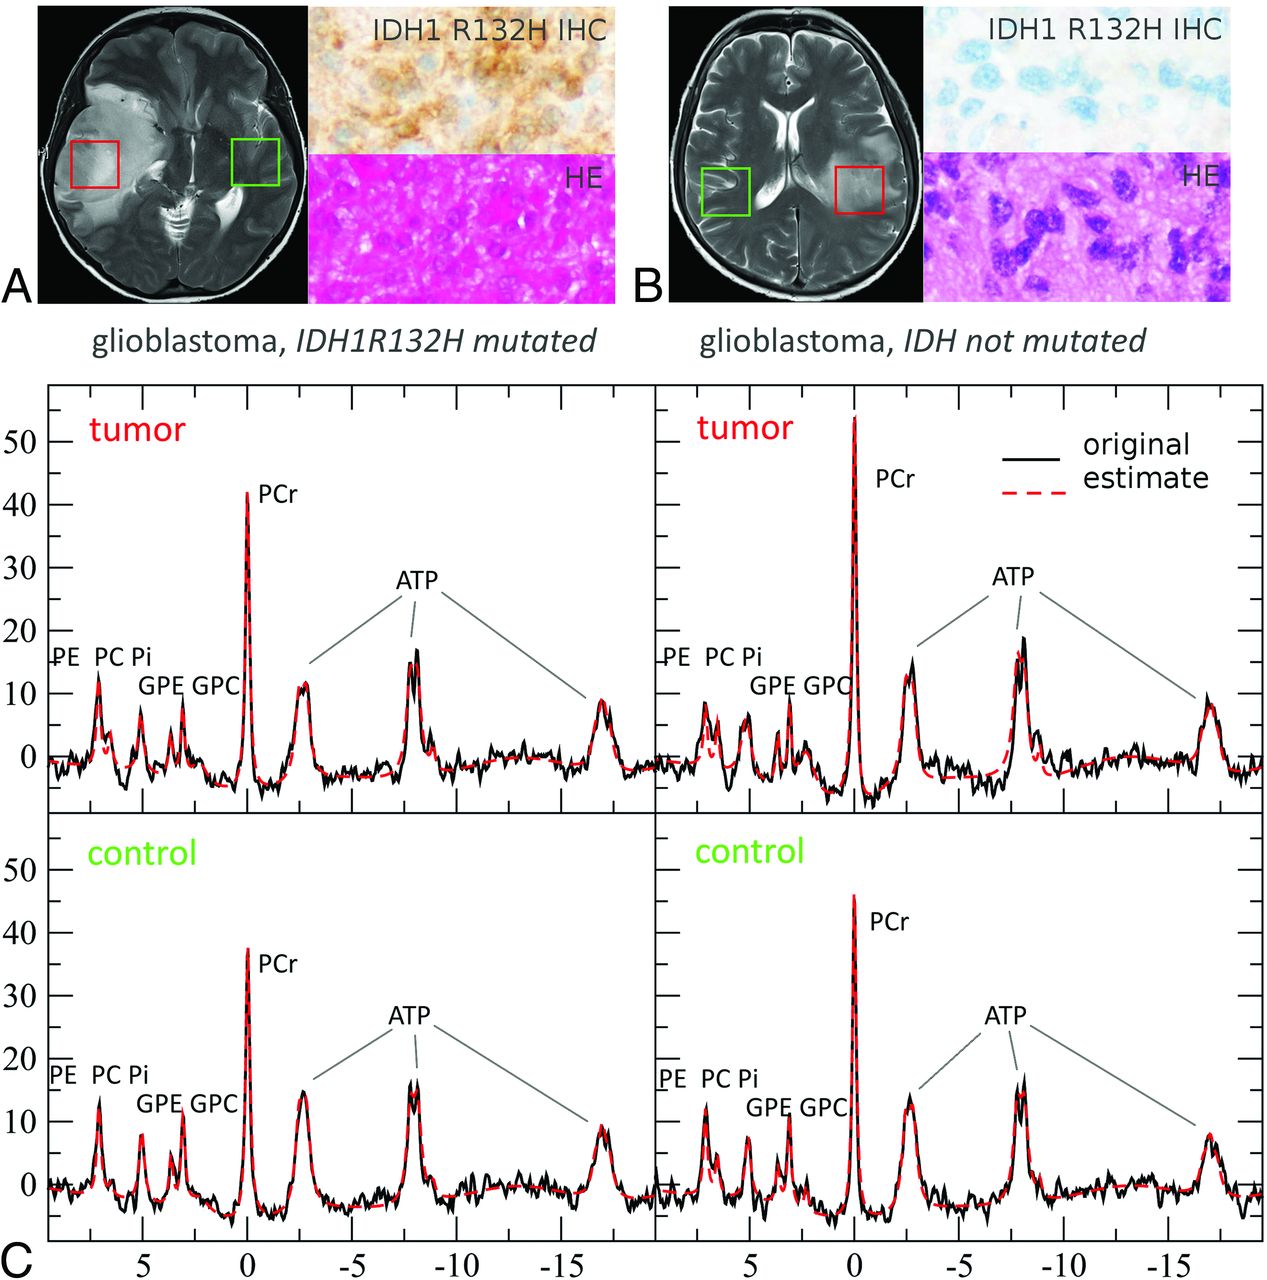
Representative 31P MR spectra (MR spectroscopy) for tumor tissue with and without IDH mutation at 3T. In the upper row (A and B), green (control) and red (tumor) boxes indicate voxel positioning on T2WI, while H&E staining and immunostaining of a patient specimen with an antibody for mutant IDH1 (R132H) are shown to the right of the MR images. C, MR spectroscopy data depict the original spectrum as a black line and the spectral fit as red dotted line.40 PCr indicates phosphocreatinine; GPE, glycerophosphoethanolamine; GPC, glycerophosphocholine; PC, phosphocholine; PE, phosphoethanolamine; Pi, inorganic phosphate. Reproduced with permission.
Lactate Levels in Glioma
There was a significant difference in Lac concentration comparing tumor voxels of patients with IDHmut gliomas with those with IDHwt (mean IDHmut = 5.4 ± 4.1 mmol/L; mean IDHwt = 11.7 ± 4.3 mmol/L; P < .003, t test; Fig 3). Because there was no significant difference in comparing the total Cr concentration in tumor voxels of patients with IDHmut with those with IDHwt (mean IDHmut = 11.0 ± 3.3 mmol/L; mean IDHwt = 10.7 ± 4.3 mmol/L; P = .85, t test), we calculated ratios of Lac/Cr. As expected these ratios showed a significant difference between patients with IDHmut and IDHwt gliomas (mean IDHmut = 0.6 ± 0.6; mean IDH wt = 1.4 ± 0.9; P < .014, t test). Statistical significance for Lac concentration and Lac/Cr ratios bet-ween patients with IDHmut and IDHwt gliomas was maintained, excluding the 2 patients pretreated with radiation therapy or chemotherapy from the cohort (P = .003 and P < .03).
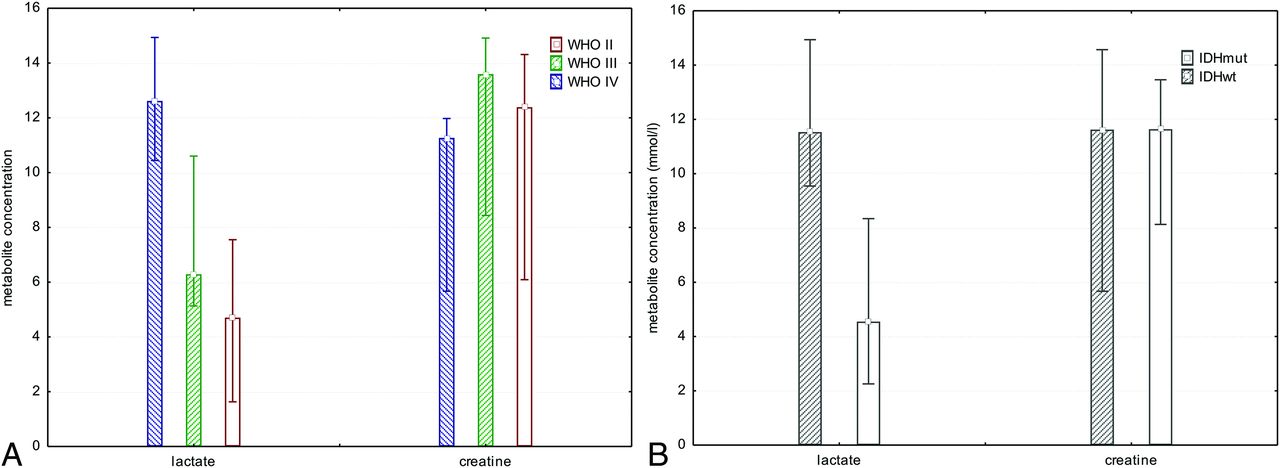
Bar chart showing median, minimum, and maximum of Lac and Cr concentrations for all tumor grades separately, independent of IDH mutation status (A) and all tumor grades pooled comparing patients with IDHmut with those with IDHwt gliomas (B). There was a significant difference in Lac concentration when comparing tumor voxels of patients with IDHmut gliomas with those with IDHwt (P < .003, t test).
To investigate codependent effects of 1p deletion and IDHmut-dependent NHE1 promotor methylation on tumor cell metabolism, we looked at all patients with IDH gene mutations and compared those with chromosomal losses of 1p and 19q with those with no chromosomal losses. We found a significant difference between patients with IDHmut glioma with chromosomal losses of 1p/19q and those with IDHmut without chromosomal losses with regard to Lac concentration (mean IDHmut codeleted 1p/19q = 3.0 ± 2.9 mmol/L; mean IDHmut no codeleted 1p/19q = 6.7 ± 4.2 mmol/L; P < .038, t test; Fig 4).

Bar chart showing median, minimum, and maximum Lac concentrations in all patients with IDH gene mutations and WHO II and III gliomas (no WHO IV), comparing those with chromosomal losses of 1p and 19q with those with no chromosomal losses. We found a significant difference in Lac concentrations (P < .038, t test). However, if one compared WHO II with WHO III tumors with IDH gene mutations, there was no significant difference. This finding points toward IDH gene mutations and chromosomal losses as 2 contributing factors to changes in cell metabolism independent of WHO grade. LOH indicates loss of heterozygosity.
Exploring the effects of tumor grade on metabolism, we looked at all patients with IDH gene mutations and compared patients with WHO II with those with WHO III tumor grade. There was no significant difference between IDHmut WHO II and WHO III tumor grades with respect to Lac concentrations (mean IDHmut WHO II = 5.9 ± 5.4 mmol/L; mean IDHmut WHO III = 5.2± 3.7 m mol/L; P < .74, t test; Fig 3). Because there was only 1 secondary glioblastoma (IDHmut) in our cohort, we were not able to statistically compare the effects between IDHmut WHO III und WHO IV gliomas.
Changes in Tumor pHi
We found a significant difference in pHi comparing tumor voxels of patients with IDHmut glioma with respective voxels in patients with IDHwt (mean IDHmut = 7.04 ± 0.02; mean IDHwt = 7.07 ± 0.03; P = .001, t test; Fig 5). Statistical significance in pHi between patients with IDHmut and IDHwt gliomas was maintained, excluding the 2 patients pretreated with radiation therapy or chemotherapy from the cohort (P < .001). Further results regarding metabolite ratios obtained from 3D 31P chemical shift imaging have been published previously.39,41
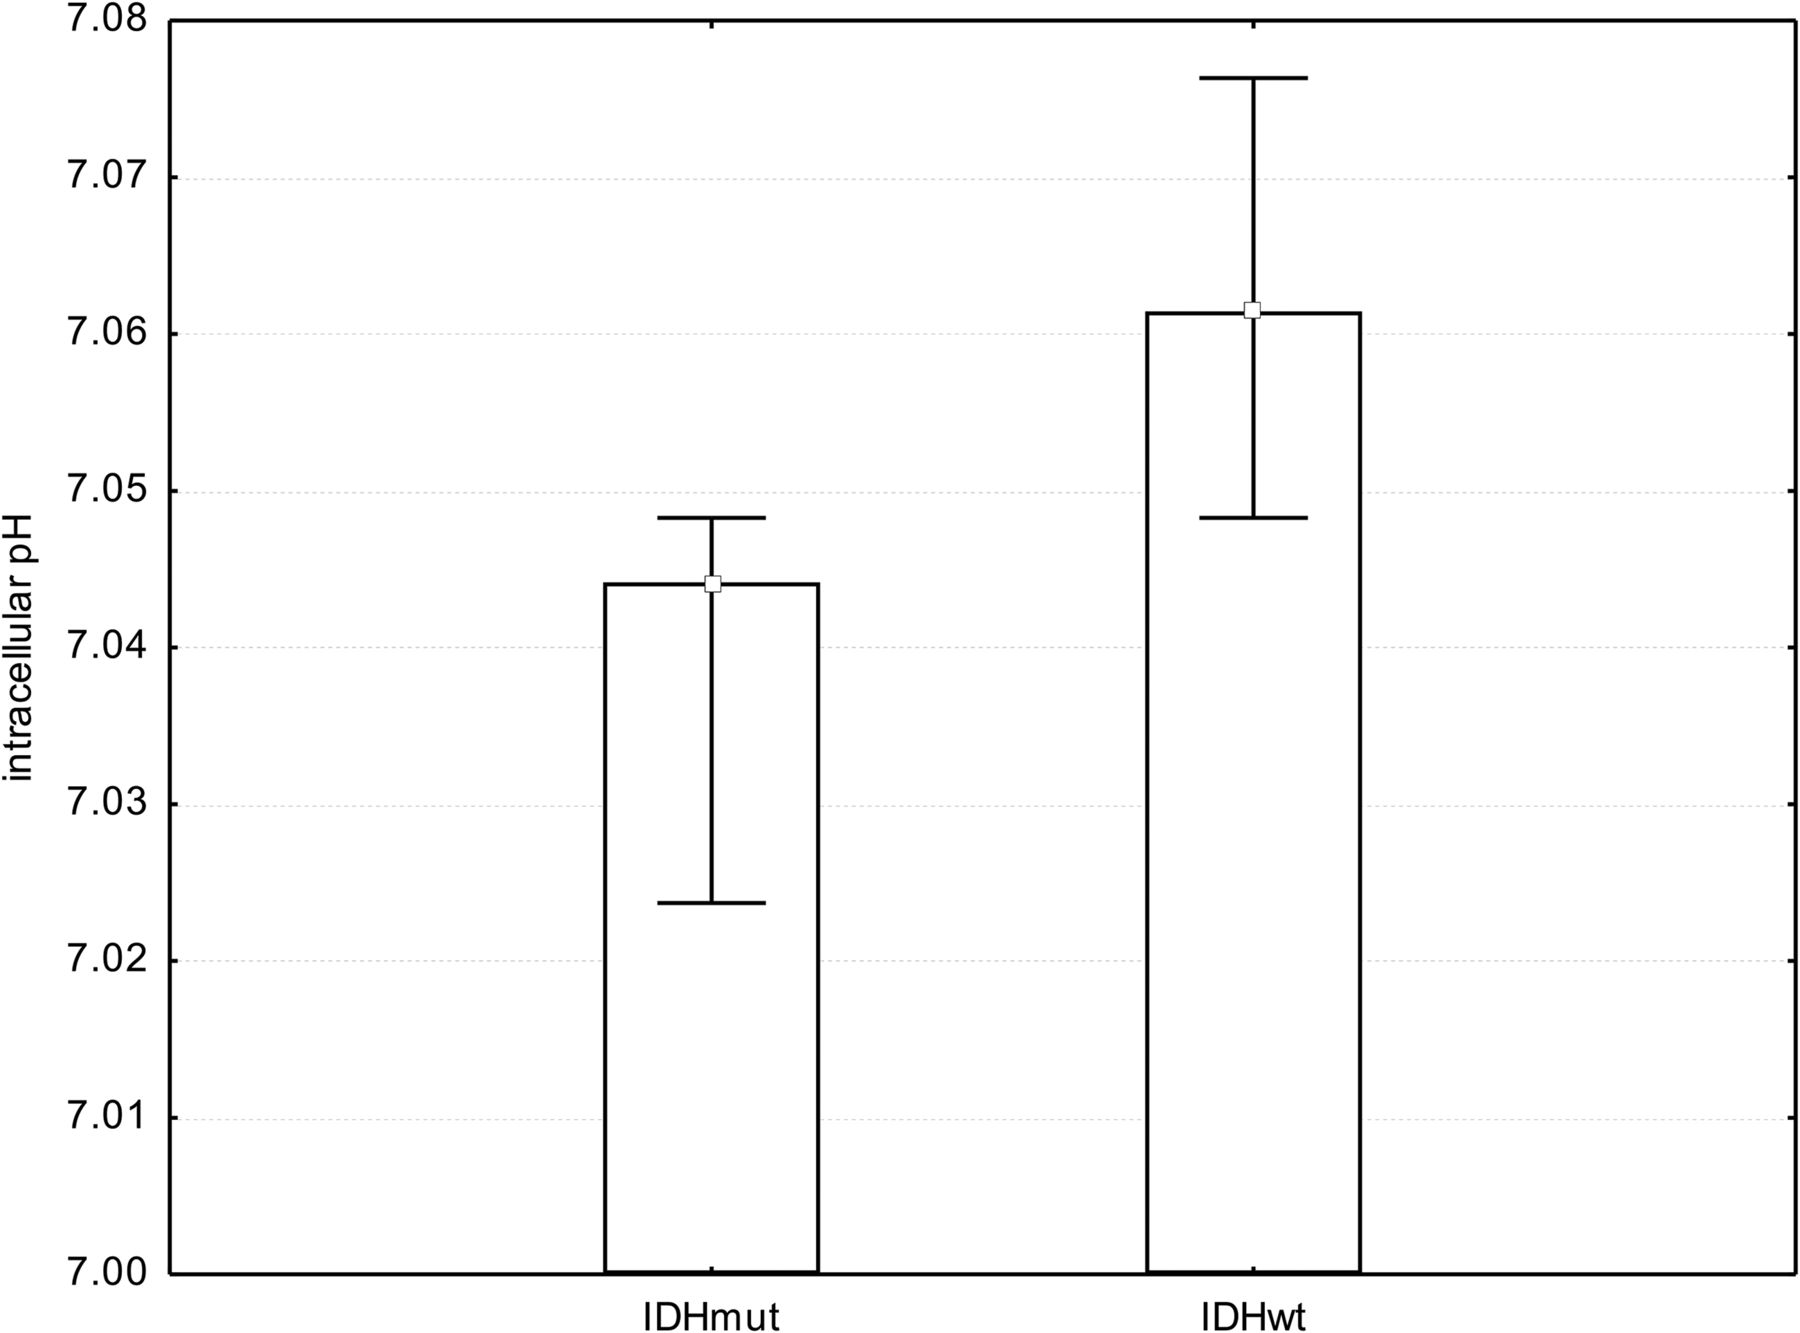
Bar chart showing median, minimum, and maximum pHi. We found a significant difference in pHi when comparing tumor voxels of patients with IDHmut gliomas with respective voxels of patients with IDHwt gliomas (P = .001, t test).
DISCUSSION
Preclinical evidence points toward a metabolic reprogramming in IDHmut tumor cells with down-regulation of the expression of genes that encode for glycolytic metabolism. Results of these metabolic changes could be observed in our noninvasive in vivo study. Most of the investigated IDHwt tumor cells, on the other hand, seemed to behave like typical Warburg tumor cells with a highly glycolytic metabolism. This translated into a significant difference in intratumoral Lac concentrations when comparing patients with IDHmut with those with IDHwt gliomas. The lower Lac production (and possibly excretion) led to a near-normal pHi in IDHmut tumors. Therefore, the reversal of the proton gradient between intracellular and extracellular space with acidification of the extracellular space seems to be a characteristic feature of IDHwt tumors. Our findings are well in line with previous in vitro findings.27⇓⇓-30 Only Elkhaled et al42 quantified Lac from 1H-High Resolution Magic-Angle Spinning ex vivo spectra of biopsy samples of 104 tissue samples from 52 patients with WHO II–IV gliomas and found that Lac concentrations increased with 2-HG concentrations. However, in a later report examining ex vivo spectra of biopsy samples of new or recurrent WHO II–IV gliomas with the same method, they stated that the relatively high peaks corresponding to Lac cannot reliably reflect in vivo levels. Death-to-freezing intervals with ischemia of biopsy samples seem to allow anaerobic metabolization of brain glycogen to Lac, contributing to falsely elevated Lac concentrations.43
While evidence clearly points toward an IDH genotype dependence of intratumoral lactate levels, it remains uncertain how highly malignant features such as a selective advantage of tumor cells with higher rates of glycolysis in neovascularized, hypoxic regions and tumor cell necrosis enter the equation.44,45 It would, therefore, be of interest to compare lactate levels of secondary (IDHmut) glioblastomas with those of primary (IDHwt) glioblastomas and IDHmut WHO III with those of higher malignant IDHmut WHO IV gliomas. Secondary glioblastoma accounted for only approximately 10% of glioblastomas,46 while primary glioblastoma constituted most WHO IV tumors. This was reflected by our cohort with only 1 secondary glioblastoma, impeding statistical comparison between IDHmut and IDHwt glioblastoma as well as IDHmut WHO III and WHO IV gliomas. The relatively high Lac signal of the 1 secondary glioblastoma and the long-known pH dependence of the invasive capacity of brain tumors11,24 suggest additional effects of highly malignant features on Lac levels and pHi (Fig 1).
There was no statistical significance when comparing Lac concentrations between IDHmut WHO II and III gliomas. This is in line with the notion that the biologic behavior and the prognosis of WHO II versus III tumors show much fewer differences in IDHmut than in IDHwt tumors.47 We additionally found evidence for codependent effects of 1p/19q codeletion and IDH mutations with regard to Lac concentrations for WHO tumor grades II and III. This finding points toward IDH gene mutations and 1p/19q codeletion as 2 contributing factors to changes in cell metabolism independent of WHO grade.
Prior preclinical and clinical studies have discussed possible changes in the phospholipid mechanism related to mutations in IDH genes but were not entirely consistent.29,41,42,48,49 Phospholipids are synthesized from phosphatidic acid and 1,2-diacylglycerol intermediates in the synthesis of triacylglycerols. The link to lactate production is pyruvate. Because enzyme activities of both pathways are affected by many factors such as expression, posttranslational modifications, and cofactor levels and may differ between in vivo studies and genetically engineered cell models, current results are not contradicted by previous findings.
The PRESS at TE = 97 ms was based on the vendor’s standard SVS, using a sinc-shaped excitation pulse and a Mao refocusing pulse with T2 time spacing aimed at 2-HG detection.50 In general, the Lac peak at 1.33 ppm is split into a doublet because of J-coupling interaction with the solitary methine proton (−CH). The coupling constant (J) for lactate in vivo is approximately 6.9 Hz. Recording the Lac peak inverted facilitates its detection and discrimination from other resonances such as lipids.51 In our study at TE = 97 ms (odd multiple of 1/J), we were able to record the Lac peak as an inverted pseudosinglet (Fig 6). According to the CRLBs obtained from the LCModel analysis in our cohort, the negative Lac signal can be well-discriminated from the positive signals of MM. While most spectra at TE = 97 ms could be fitted without lipids and MM in the Lac spectral region, we found 3 patients with spectra exhibiting Lip13b and 8 patients with MM20 at CRLB of <20%. In all except one of these spectra, CRLBs for Lac were also below 20%. Only 1 patient’s spectrum showed CRLBs for Lac and Lip13 of >30%, indicating that discrimination between Lac and Lip13 was not possible. This patient was excluded from the analysis. At a 3T clinical scanner, the inverted Lac signal might be distorted and significantly reduced in intensity due to an incomplete 180° pulse at the rim of the PRESS-selected box.51,52 While reduced Lac signal intensities in PRESS do not affect our findings comparing patient groups examined with the same MR spectroscopy protocol, absolute Lac concentrations can be affected. The considerable difference in Lac resonance intensity between IDHmut and IDHwt gliomas and between high-grade and low-grade gliomas and a lack of difference in Cr intensity leave the ratio Lac/Cr relatively insensitive to partial volume effects due to necrotic areas or CSF. It can, therefore, be used as a robust ratio in clinical routine without the need for metabolite quantitation.

Simulation of Lac PRESS spectra at different TEs using NMRScopeB, which is implemented in jMRUI. The program calculates MR spectra on the basis of a priori knowledge of scalar coupling, chemical shifts, and hardware parameters. The figure shows the real component of the simulated spectrum calculated from a defined amount of lactate in arbitrary units with an additional exponential line broadening of 5 Hz.
Limitations
With a defined timeframe of the clinical study and a fixed protocol at 1 research scanner in combination with statistical odds of >70% of WHO II–III tumors bearing IDH mutations,53 we were unable to obtain a more balanced population. We acknowledge that our study is limited by this imbalance.
Pretreated patients may pose limitations on metabolic analysis. In our study cohort, 3 patients had undergone partial resection before the study inclusion, one had been treated with chemotherapy (temozolomide), and one, with radiation therapy. All of the pretreated subjects were patients with IDHmut gliomas. Partial resection was performed 4, 14, and 44 months prior, which we assumed to be a sufficient period to rule out postoperative effects of perioperative ischemia on lactate levels and pHi. Zheng and Wang54 found that lactate levels in a neonatal piglet model were normalized 48–72 hours after hypoxic-ischemic brain injury in the basal ganglia. Statistical significance for Lac concentration, Lac/Cr ratios, and pHi between patients with IDHmut and IDHwt gliomas was maintained, excluding the 2 patients pretreated with radiation therapy or chemotherapy from the cohort.
With regard to pHi values, the general limitations of 31P MR spectroscopy have to be taken into account. With coarse 8 × 8 × 8 k‐space sampling, which is typical for many 31P MR spectroscopic imaging studies,55 results suffer from spreading of signal into adjacent voxels caused by the point spread function. The inherent partial volume effect tends to level focal changes in the position of the signal of inorganic phosphate, which is used to calculate pHi values. Because we used only 1 signal to fit inorganic phosphate, the estimated pHi rather indicates a deviation to higher values compared with the regular value than providing a number for the real pHi in the target region.24 pHi ranges determined by 31P MR spectroscopy are in line with previous publications by other groups.56,57
CONCLUSIONS
By means of PRESS at TE = 97 ms, with optimized echo spacing for detection of 2-HG, Lac peaks can be fitted with little impact of lipid/MM contamination. We found indirect evidence for metabolic reprogramming in IDHmut tumor cells with a significant difference in Lac concentrations and Lac/Cr ratios compared with IDHwt cells and a near-normal pHi. Our findings suggest that the prediction of IDH mutation status can be supported by the use of Lac/Cr ratios as well as pHi as additional MR spectroscopic markers.
Footnotes
This work was supported by Stiftung Tumorforschung Kopf-Hals (Wiesbaden, Germany) and Frankfurter Forschungsförderung (Frankfurt, Germany).
Disclosures: Katharina J. Wenger—RELATED: Grant: Stiftung Tumorforschung Kopf-Hals (Wiesbaden, Germany), Frankfurter Forschungsförderung (Frankfurt, Germany), Comments: university funding and charitable foundation funding medical research.* Joachim P. Steinbach—UNRELATED: Consultancy: UCB, Roche; Grants/Grants Pending: UCB; Payment for Lectures Including Service on Speakers Bureaus: Roche, Medac, Boehringer Ingelheim; Travel/Accommodations/Meeting Expenses Unrelated to Activities Listed: Medac, Abbvie.* *Money paid to the institution.
References
- Received October 17, 2019.
- Accepted after revision May 3, 2020.
- © 2020 by American Journal of Neuroradiology


Jump to section
Related Articles
Cited By...
- No citing articles found.