
Abstract
BACKGROUND AND PURPOSE: The clinical differentiation between acute ischemic stroke and epileptic seizure may be challenging, and making the correct diagnosis could avoid unnecessary reperfusion therapy. We examined the accuracy of CTP in discriminating epileptic seizures from acute ischemic stroke without identified arterial occlusion.
MATERIALS AND METHODS: We retrospectively identified consecutive patients in our emergency department who underwent CTP in the 4.5 hours following the development of an acute focal neurologic deficit who were discharged with a final diagnosis of acute ischemic stroke or epileptic seizure.
RESULTS: Among 95 patients, the final diagnosis was epileptic seizure in 45 and acute ischemic stroke in 50. CTP findings were abnormal in 73% of the patients with epileptic seizure and 40% of those with acute ischemic stroke. Hyperperfusion was observed more frequently in the seizure group (36% versus 2% for acute ischemic stroke) with high specificity (98%) but low sensitivity (35%) for the diagnosis of epileptic seizure. Hypoperfusion was found in 38% of cases in each group and was not confined to a vascular territory in 24% of patients in the seizure group and 2% in the acute ischemic stroke group. The interobserver agreement was good (κ = 0.60) for hypo-, hyper-, and normoperfusion patterns and moderate (κ = 0.41) for the evaluation of vascular systematization.
CONCLUSIONS: CTP patterns helped to differentiate acute ischemic stroke from epileptic seizure in a “code stroke” situation. Our results indicate that a hyperperfusion pattern, especially if not restricted to a vascular territory, may suggest reconsideration of intravenous thrombolysis therapy.
ABBREVIATIONS:
- AIS
- acute ischemic stroke
- EEG
- electroencephalography
- NPV
- negative predictive value
- PPV
- positive predictive value
- Tmax
- time-to-maximum
“Code stroke” status, a sudden-onset neurologic deficit, is a common cause of admission to emergency departments. Stroke is the first diagnosis to explore because it requires early reperfusion therapy such as thrombolysis and/or mechanical thrombectomy because as many as 30% of patients with code stroke involve conditions that mimic stroke,1 with epileptic seizure being one of the most frequent (∼10%).2 Up to 15% of patients receiving rtPA after NCCT have a stroke mimic.3 Although some studies have demonstrated that intravenous rtPA in stroke mimics is relatively safe,3 complications such as such hemorrhage or angioedema can occur in 1% of cases each4 and increase the cost and length of hospitalization.5
Imaging modalities that can differentiate an acute ischemic stroke from an epileptic seizure could facilitate the appropriate choice of urgent treatment. Intracranial arterial imaging is insufficient to diagnose ischemic stroke because up to 40% of patients with stroke have no identified occlusion.6
Although brain MR imaging with diffusion-weighted imaging is regarded as the criterion standard for detecting early ischemia, CTP is a more widely accessible imaging technique, with shorter acquisition times. In recent thrombectomy studies, CTP screening was performed 11 times more frequently than MR imaging screening.7
Cerebral perfusion imaging related to acute ischemic stroke has been widely investigated,8 but few studies on the role of cerebral perfusion imaging in seizure diagnosis have been published.9,10 During the ictal period, neuronal activation may be associated with an increase in regional brain perfusion, whereas the postictal period is characterized more frequently by hypoperfusion.11,12
The aim of our study was to identify cerebral perfusion imaging patterns that help differentiate an acute focal neurologic deficit related to an epileptic seizure from an acute ischemic stroke in code stroke alerts, in the absence of vessel occlusion or stenosis on CTA.
MATERIALS AND METHODS
Patients
This monocentric study was conducted on a retrospective and consecutive unselected cohort of patients admitted to our emergency department with an acute focal neurologic deficit on code stroke alert between January 2014 and October 2015.
We retrospectively obtained all CTP examinations performed in emergency settings by query of the PACS. We obtained clinical data from a review of systematic Electronic Medical Records, and an NIHSS was administered by a stroke neurologist (with NIHSS certification) immediately before the CTP (Online Appendix).
The inclusion criteria were as follows: 1) CTP was performed during the first 4.5 hours following the onset of symptoms in code stroke status; 2) the final diagnosis was either epileptic seizure (seizure group) or acute ischemic stroke (stroke group); 3) patients in the stroke group were hospitalized in our stroke unit and had normal CTA findings and evidence of ischemic stroke on follow-up MR imaging; and 4) patients in the seizure group had undergone electroencephalography (EEG) during hospitalization and had no evidence of an acute ischemic stroke on follow-up MR imaging or, in rare cases of incompatibility, on follow-up CT (Fig 1).

Flow chart.
The diagnosis of seizure was based on converging clinical evaluation and electroencephalographic evidence and was classified according to the current International Classification of Epileptic Seizure by specialists in epilepsy (J.A., B.T.). A clinical suspicion of seizure was based on witness descriptions of typical manifestations of seizure, new occurrence of seizure during early follow-up, or suggestive evidence on EEG.
The main exclusion criterion was the presence of any vessel occlusion in the artery supplying the symptomatic brain region on initial CTA, the presence of which is strong evidence in favor of a stroke diagnosis. Patients with arterial stenosis on initial CTA were also excluded because of their risk of brain perfusion modification, which can bias the interpretation of CTP.
Our study complied with the protection of personal health data and the protection of privacy within the framework of the application provided by article 65-2 of the amended Data Protection Act and general regulations for the protection of personal data.
CTP Image Acquisition, Protocol, and Analysis
CTP Acquisition.
CTP studies were obtained on a 64-section CT scanner (Optima 660; GE Healthcare). The acquisition parameters were as follows: 80 kV, 160 mAs, 250-mm FOV, 512 × 512 matrix, 16 slices covering 80 mm, 3 -second time resolution (time rotation, 0.4 seconds). Typical dosimetry delivery was CT dose index volume, 70 mGy (phantom head 16), and dose length product, 550 mGy × cm.
CTP Postprocessing and Analysis.
Parametric maps from CTP were obtained from Olea Sphere 3.0. (Olea Medical). This software applies deconvolution according to the cSVD method, which allows the computation of CBF, CBV, MTT. and time-to-maximum (Tmax) maps (Online Appendix).
All CTP maps were interpreted by 2 independent readers blinded to the final diagnosis but aware of the clinical symptoms included in the NIHSS score. Reader 1 (F.G.) is a neuroradiologist with 4 years of experience, and reader 2 (P.R.) is a stroke neurologist with 10 years of experience.
For the qualitative analysis, the 2 readers identified the presence or absence of perfusion abnormalities on color-coded maps as defined by visible perfusion changes relative to the contralateral hemisphere. In the case of visible perfusion asymmetry, whether the pathologic side was contralateral to the side showing clinical symptoms was evaluated. The nature of any asymmetry (hypo- or hyperperfusion), its anatomic localization, and whether it was limited to the vascular territory were described. The absence of vascular anatomic variations, such as in the fetal posterior cerebral artery, was systematically confirmed on each CTA. Hyperperfusion was defined as visibly reduced MTT and Tmax. Hypoperfusion was defined as visibly prolonged MTT and Tmax. CBV and CBF were also calculated for each pattern. An additional third reader (P.M.) with 20 years of experience in neuroradiology participated in a consensus meeting to analyze any discrepancies. The 3 readers reached agreement by consensus for each case.
To investigate the presence of more subtle perfusion abnormalities, including asymptomatic areas, we performed an additional quantitative analysis. Reader 1 selected an ROI in the visibly abnormal perfusion region or, in the absence of a visible abnormality, in the suspected symptomatic region, based on the clinical presentation. A symmetric ROI on the contralateral hemisphere was automatically generated. Additional ROIs, outside the abnormal perfusion region, were also selected with an automatic mirror ROI. These ROIs were placed in other cortical regions, such as the ipsilateral frontal and temporal lobes, as well as in subcortical regions, such as the ipsilateral thalamus and contralateral cerebellar hemisphere. Although focal epilepsy is considered a cortical disease, particularly in the temporal and frontal lobes, the subcortical regions are associated with important pathways involved in seizure propagation and regulation,13 and crossed cerebellar diaschisis has been previously described.14 For each ROI, ratios for Tmax, MTT, CBF, and CBV were calculated as ROI symptomatic/ROI symmetric.
MR Imaging Evaluation
All MR imaging–compatible patients underwent a brain MR imaging evaluation using at least diffusion-weighted imaging, FLAIR, and T2*-weighted gradient recalled echo sequences within 2 days after admission.
EEG Acquisition and Analysis
In the seizure group, at least one 20-minute EEG was recorded within 72 hours of hospital admission, using surface electrodes and conforming to the international 10–20 system. EEG recordings were retrospectively interpreted by an EEG specialist (J.A.) aware of the clinical presentation. These recordings were classified into 3 subtypes: normal, epileptiform activity (seizure or epileptiform discharges during EEG, spike and slow wave complex), and nonspecific activity (focal or diffuse slowing, isolated spikes, or slow waves).
Statistical Analysis
Continuous variables are presented as mean [SD], and categoric variables, as number (percentage). Wilcoxon or Mann-Whitney U tests were used to compare continuous variables. χ2 tests, with or without the Yates correction, and Fisher exact tests were used to compare categoric variables.
Interobserver agreement between the 2 readers in the qualitative analysis was calculated using the Cohen κ statistic. The agreement results were defined as follows: poor, ≤ 0.2; mild, 0.2–0.4; moderate, 0.4–0.6; good, 0.6–0.8; and excellent, 0.8–1. Sensitivity, specificity, negative predictive values (NPV), and positive predictive values (PPV) for each CTP pattern according to each disease point of view were analyzed. We used receiver operating characteristic curve analysis to estimate optimal perfusion values in discriminating stroke and seizure. All statistical analyses were performed using R Studio software (http://rstudio.org/download/desktop) (R version 4.0.0; http://www.r-project.org).
RESULTS
Study Population Characteristics
Among the 926 patients who underwent CTP evaluation for code stroke status during the study period, 45 had a final diagnosis of seizure, and 50, a final diagnosis of ischemic stroke, fulfilling the inclusion criteria (Fig 1 and Online Tables 1 and 2). Among the 50 patients with stroke, 46 (92%) had supratentorial stroke. Patients in the seizure group were older (73.81 [SD,12.67] versus 63.68 [SD, 14.45] years, P < .01) and had higher NIHSS scores (7.44 [SD, 6.34] versus 4.54 [SD, 4.10], P < .01, Table 1). Four patients in the seizure group did not have an MR imaging due to the presence of a pacemaker. Eight patients (18%) in the seizure group and 26 (52%) in the stroke group received thrombolysis (Table 1).
Baseline characteristics of the study patienta
CTP Analysis
Good interobserver agreement between the 2 readers in terms of the type of perfusion abnormality (hypo-, hyper- and normal perfusion) was found (Cohen κ = 0.67; 95% CI, 0.54–0.80).
Hyperperfusion Pattern.
In the qualitative analysis, hyperperfusion patterns were significantly more frequent in the seizure group than in the stroke group (36% versus 2%, P < .01, Table 2 and Fig 2). Only 1 patient with stroke had a hyperperfusion pattern (Fig 3). A hyperperfusion pattern has a high specificity of 98% and a PPV of 94% for diagnosing seizure, despite a weak sensitivity of 35% and a moderate NPV of 63%. When the characteristic “not restricted to the vascular territory” was added, the specificity and PPV of the hyperperfusion pattern for diagnosing seizure improved to 100%, though the sensitivity remained low (20%), and the NPV, moderate (58%) (Online Table 3).

CTP images showing examples of hyperperfusion respecting (A) or not (B) a vascular territory in the seizure group. A, An 84-year-old woman presenting with Wernicke aphasia and complete right hemianopsia: left fronto-parieto-occipital hyperperfusion, which may correspond with the posterior cortical branch of left middle cerebral artery. B, An 80-year-old woman presenting with mutism, right hemiplegia, and left forced gaze deviation: left parieto-occipital hyperperfusion not respecting a vascular territory (the left posterior cerebral artery was exclusively from the basilar artery).

A 92-year-old patient presenting with aphasia and right central facial palsy: focal hyperperfusion on CTP in favor of immediate poststroke “luxury perfusion.” A, Focal decrease of the Tmax parameter in the left prefrontal area in favor of relative hyperperfusion. B, Focal increase of the CBV parameter in the same area. C, Correlation with follow-up MR imaging performed 26 hours after clinical presentation identifying a bifocal acute ischemic stroke.
Qualitative analyses of CTPa
Hypoperfusion Pattern.
A hypoperfusion pattern was found in approximately one-third of the cases in each group (38% in both, Table 2 and Fig 4). Hypoperfusion had a weak predictive value for discriminating stroke and seizure: For diagnosing stroke, the sensitivity was 38%; specificity, 62%; PPV, 53%; and NPV, 47%; and for diagnosing seizure, the sensitivity was 38%; specificity, 62%; PPV, 47%; and NPV, 53%. Hypoperfusion was more frequently restricted to the vascular territory in the stroke group than in the seizure group (95% versus 35%). When the characteristic “restricted to a vascular territory” was added, the hypoperfusion pattern improved its predictive value for diagnosing stroke with a specificity of 87% and a PPV of 75%, and the sensitivity and NPV remained low (25% and 55%, respectively) (Online Table 4). When the characteristic “not restricted to a vascular territory” was added, the hypoperfusion pattern improved its predictive value for diagnosing seizure with a specificity of 98% and a PPV of 92%, though the sensitivity and NPV remained low (24% and 59%).
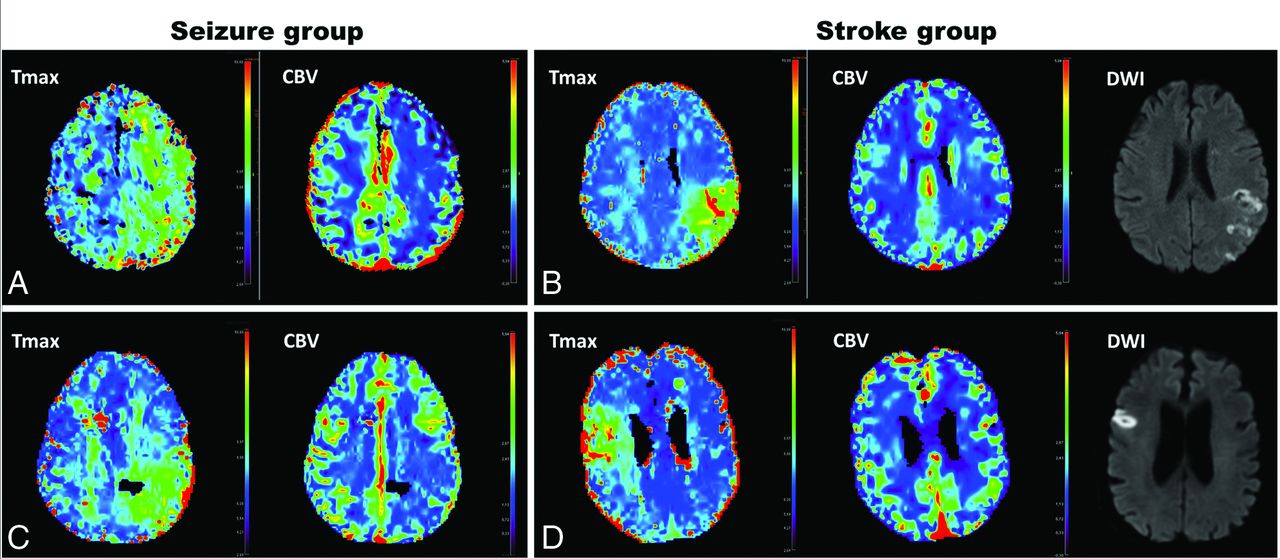
Comparison of CTP hypoperfusion patterns between seizure and stroke groups. A, A 61-year-old man presenting with seizure-related aphasia and right face and arm palsy: left holohemispheric hypoperfusion, absence of modification of the CBV parameter. B, A 47-year-old woman presenting with seizure-related aphasia and right-arm palsy: hypoperfusion, which may correspond with a vascular territory, and a relative decrease (33%) of the CBV parameter in the same area. C, A 60-year-old man with stroke-related aphasia and right-arm and facial palsy: hypoperfusion corresponding with posterior territory of the left middle cerebral artery, absence of modification of the CBV parameter, and MCA acute ischemic stroke within the hypoperfusion region on follow-up MR imaging. D, A 77-year-old man with stroke-related dysarthria and left facial palsy: hypoperfusion corresponding to a part of the cortical ribbon of the right medium cerebral artery, no modification of the CBV parameter, and MCA acute ischemic stroke within the hypoperfusion territory on follow-up MR imaging.
The Tmax and MTT ratios in the hypoperfused region were significantly higher in the stroke group than in the seizure group (mean, 1.98 [SD, 0.62] versus 1.50 [SD, 0.36], P = .01 for Tmax, and 1.15 [SD, 0.14] versus 0.99 [SD, 0.16], P = .002 for MTT, Table 3). The CBV ratio was not different between the stroke and seizure groups (0.88 [SD, 0.19] versus 0.86 [SD, 0.31], P = .41, Table 3). In comparisons between the stroke and seizure groups, the CBV ratio was decreased (n = 22 versus n = 14), normal (n = 13 versus n = 10), or increased (n = 15 versus n = 21) (data not shown). With the receiver operating characteristic curve, there was a moderate prediction of Tmax ratio (area under the curve = 0.7; 95% CI, 0,51–0.88; P = .05) (Online Appendix). A threshold Tmax ratio of >2 allowed a specificity of 89%, despite a low sensitivity (44%) for the diagnosis of acute ischemic stroke (Online Figure)
Quantitative analysis of perfusion CTP
Among the patients with a hypoperfusion pattern, we observed an increased Tmax ratio in the seizure group within additional frontal and temporal ROIs (Table 3).
Normal Perfusion Pattern.
A normal perfusion pattern in the clinically suspected ROI was more frequent in the stroke group than in the seizure group (60% versus 37%). This pattern has a moderate predictive value for the diagnosis of stroke with a sensitivity of 60%, a specificity of 73%, a PPV of 71%, and an NPV of 62%. In this pattern, we found no significance in the perfusion ratios on other ROIs in the temporal or frontal lobe, thalamus, or cerebellum between the 2 groups (Table 3).
Perfusion Abnormality Restricted to the Vascular Territory.
Among patients with abnormal perfusion (hyper- or hypoperfusion), the pattern of perfusion abnormality restricted to the vascular territory differed between the stroke and seizure groups. Perfusion abnormality was not restricted to the vascular territory in 44% of patients with seizure compared with only 2% of patients with stroke (Table 2). Although the pattern not restricted to vascular territory appears to have a high specificity (98%) and PPV (95%, for seizure), interobserver agreement was only moderate (Cohen κ = 0.41; 95% CI, 0.12–0.71).
DISCUSSION
Our study suggests that CTP patterns may help differentiate neurologic deficits related to acute ischemic stroke from those related to epileptic seizure in the absence of visible occlusion or stenosis of a supplying vessel on CTA. A hyperperfusion pattern on CTP was significantly more frequent in the seizure group, with a high specificity for the diagnosis of seizure, especially when the hyperperfusion was not restricted to the vascular territory. This hyperperfusion pattern had good interobserver reproducibility. In the stroke group, the only case with a hyperperfusion pattern involved early postischemic hyperperfusion, also called “luxury perfusion.” Postischemic hyperperfusion occurs after recanalization of the occluded artery and is observed in approximately 50% of patients after 7 days.15 Its frequency in a code stroke situation is unknown.
A hypoperfusion pattern on CTP was encountered at the same rate in the seizure and stroke groups. The specificity of this pattern for diagnosing seizure was improved when hypoperfusion was not restricted to the vascular territory, despite a low sensitivity. In cases of hypoperfusion, quantitative analysis of perfusion parameters revealed an increased Tmax ratio in the stroke group compared with the seizure group. However, given the moderate accuracy of the Tmax ratio to separate the 2 groups (area under the curve = 0.7), we could not identify a relevant Tmax ratio cutoff to discriminate stroke from seizure. Although this is the first time that a direct comparison of quantitative perfusion parameters between patients with stroke and seizures has been performed, this result seems relevant because deep hypoperfusion is observed downstream of the occluded artery in patients with stroke, which is responsible for the constitution of the infarct core. This is in contrast to the moderate hypoperfusion expected in the postictal phase, related to neuronal inhibition16 or hypoactivity of the involved region. Moreover, additional ipsilateral frontal and temporal lobe hypoperfusion was found more frequently in the seizure group. This result is suggestive of the spreading physiopathology of seizures, the so-called “surrounding inhibition,” which seems to be in opposition to the epileptic wave front as it propagates.
Only 1 previously published study by Kubiak-Balcerewicz et al17 made direct comparisons of CTP parameters between the seizure and stroke groups. That study failed to identify perfusion patterns differentiating strokes from seizures, probably due to the small number of patients and methodologic limitations. The authors chose to measure perfusion parameters in only 1 section at the level of the basal ganglia. Moreover, angiography was not used to confirm the absence of occlusion, stenosis, or vascular anatomic variations. In another study, Van Cauwenberge et al9 found that CTP accurately differentiated seizure-related deficits from strokes but only in the suspected ictal period with hyperperfusion. In that study, patients with ictal ????? displayed more hyperperfusion than did patients with postictal ??????, with a specificity of 86% and a low sensitivity of 38%. However, this study compared patients with peri-ictal and postictal ?????? instead of matched strokes. These results are in agreement with previous CTP and PET studies performed in epilepsy units, which demonstrated a typical postictal switch from ictal hyperperfusion to postictal hypoperfusion.18 Hypoperfusion was also the most frequent pattern observed in a previous case series of postictal neurologic deficits.11 The results of our study support these previous data, and our quantitative analyses provide additional information that, in the context of hypoperfusion, may help discriminate patients with seizure from those with stroke, who potentially have deeper hypoperfusion.
Our study has some limitations. First, the data collection was retrospective. A relevant number of patients with stroke were excluded because they were not hospitalized in the stroke unit. This exclusion concerns minor strokes discharged to home, very severe strokes with patients hospitalized in the intensive care unit, and very old patients hospitalized in the geriatric unit. This could represent a selection bias. Second, there was a high rate of normal perfusion in the stroke group (60%), probably explained by our selection of patients with acute ischemic stroke without CTA abnormalities (vessel occlusion or stenosis). This may have led to an over-representation of cardioembolic, small cortical infarcts and lacunar strokes.19 However, particularly in this population, the diagnosis of stroke versus postictal deficits is challenging. Third, there was an absence of certainty regarding the seizure-related deficits, despite the performance of anamnesis, clinical evaluation, and EEG. The accuracy was also reduced by the substantial delay between clinical manifestations and EEG recordings. The absence of simultaneous EEG prevented specifying peri- or postictal status and focal or generalized seizure. Fourth, the quality of the CTP maps might appear suboptimal; this is mainly due first to a radiation dose that was intentionally limited (dose length product, <550 mGy × cm) to fit with FDA recommendations and, second, to limit smoothing to avoid an averaging effect, and, finally, to frequent motion artifacts due to the emergency context (confused or agitated patients). The good interobserver agreement between the 2 readers showed that this did not affect the results of our study. Further studies could aim to determine whether hyperperfusion is predominantly present in the cortex in case of seizure as previously demonstrated12 and to analyze whether this pattern could increase the discrimination between seizure and stroke.
CONCLUSIONS
CTP patterns might help differentiate focal neurologic deficits related to seizure from those related to acute stroke in patients with a code stroke status when CTA findings are normal, facilitating the appropriate choice of emergency treatment. Our results suggest that CTP hyperperfusion patterns, especially those not restricted to the vascular territory, are highly specific for the diagnosis of epileptic seizure and could lead to reconsidering the decision to administer intravenous thrombolytic therapy. These results should be confirmed by further prospective studies with larger patient groups.
Footnotes
Disclosures: Thomas Tourdias—RELATED: Grant: ANR-10-LABX-57 trial; UNRELATED: Grants/Grants Pending: national grant from the French Ministry (Programme Hospitalier de Recherche Clinique). Igor Sibon—UNRELATED: Board Membership: Editorial Board of Revue Neurologique; Consultancy: Medtronic, Servier Pharmaceuticals, Boehringer Ingelheim; Grants/Grants Pending: French National Institute of Health*; Payment for Lectures Including Service on Speakers Bureaus: Bayer, Servier Pharmaceuticals. *Money paid to the institution.
References
- Received April 9, 2020.
- Accepted after revision August 27, 2020.
- © 2021 by American Journal of Neuroradiology


