
Abstract
BACKGROUND AND PURPOSE: Preterm birth interferes with regular brain development. The aim of this study was to investigate the impact of prematurity on the physical tissue properties of the neonatal brain stem using a quantitative MR imaging approach.
MATERIALS AND METHODS: A total of 55 neonates (extremely preterm [n = 30]: <28 + 0 weeks gestational age; preterm [n = 10]: 28 + 0–36 + 6 weeks gestational age; term [n = 15]: ≥37 + 0 weeks gestational age) were included in this retrospective study. In most cases, imaging was performed at approximately term-equivalent age using a standard MR protocol. MR data postprocessing software SyMRI was used to perform multidynamic multiecho sequence (acquisition time: 5 minutes, 24 seconds)–based MR postprocessing to determine T1 relaxation time, T2 relaxation time, and proton density. Mixed-model ANCOVA (covariate: gestational age at MR imaging) and the post hoc Bonferroni test were used to compare the groups.
RESULTS: There were significant differences between premature and term infants for T1 relaxation time (midbrain: P < .001; pons: P < .001; basis pontis: P = .005; tegmentum pontis: P < .001; medulla oblongata: P < .001), T2 relaxation time (midbrain: P < .001; tegmentum pontis: P < .001), and proton density (tegmentum pontis: P = .004). The post hoc Bonferroni test revealed that T1 relaxation time/T2 relaxation time in the midbrain differed significantly between extremely preterm and preterm (T1 relaxation time: P < .001/T2 relaxation time: P = .02), extremely preterm and term (T1 relaxation time/T2 relaxation time: P < .001), and preterm and term infants (T1 relaxation time: P < .001/T2 relaxation time: P = .006).
CONCLUSIONS: Quantitative MR parameters allow preterm and term neonates to be differentiated. T1 and T2 relaxation time metrics of the midbrain allow differentiation between the different stages of prematurity. SyMRI allows for a quantitative assessment of incomplete brain maturation by providing tissue-specific properties while not exceeding a clinically acceptable imaging time.
ABBREVIATIONS:
- GA
- gestational age
- PD
- proton density
- T1R
- T1 relaxation time
- T2R
- T2 relaxation time
- MDME
- multidynamic multiecho
- ICC
- intraclass correlation coefficient
The myelination process begins in the fetal period and proceeds in a stepwise manner.1,2 Brain maturation progresses caudally to rostrally following a characteristic pattern.3 Hence, histologically, the maximum myelin deposition is detectable in the spinal cord and the brain stem at the time of birth.1,3
Based on the biochecture of the myelin sheath, neonatal brain development can be evaluated by MR imaging.4,5 Thus, myelination visualized on conventional T1-weighted and T2-weighted MR contrasts serves as an imaging biomarker for the assessment of brain maturation in neonates.6
Prematurity is associated with delayed myelination, which is considered a risk factor for impaired neurologic and cognitive development.7,8 Furthermore, there is a correlation between gestational age (GA) at birth and developmental outcome, with lower GA associated with a higher risk for more severe cognitive impairment.9,10 Therefore, the assessment of myelination is paramount, primarily in preterm born neonates, to predict potential mental and neurologic impairment. Despite being a highly sensitive tool for the detection of subtle cerebral pathologies in premature infants, the evaluation of myelination by brain MR imaging in this group of patients remains challenging in pediatric neuroimaging.11-13
Quantitative MR techniques enable the characterization of cerebral development and brain maturation based on tissue-specific relaxation parameters and proton density (PD).14-16 Quantitative T1 and T2 mapping have proved beneficial when assessing neonatal brain myelination qualitatively.6,17 However, quantitative MR data acquisition is a highly time-consuming process, even with modern methods and therefore is not applicable in the clinical routine.15,17
By acquiring a single multidynamic multiecho (MDME) sequence (acquisition time: 5 minutes, 24 seconds), the MR data postprocessing software SyMRI (Synthetic MR; version 11.1.5) generates a variety of conventional MR contrasts and quantitative MR maps.18-20 Based on a single sequence, intrinsic physical parameters of the examined tissue, such as T1 relaxation time (T1R), T2 relaxation time (T2R), and PD, can be determined.20 The software allows definition of TR, TE, and TI after data acquisition to generate and to modulate the preferred MR contrasts. Because the image postprocessing is performed in less than 1 minute, SyMRI provides qualitative as well as quantitative MR data in a clinically acceptable time.21-23
In neonates, the process of myelination leads to subtle MR signal changes because of alterations in relaxation parameters and spin density, detectable by quantitative MR techniques. The aim of this study was to investigate the impact of different stages of prematurity on the maturational characteristics of the neonatal brain stem, as measured by SyMRI-based T1, T2, and PD mapping. The study was designed to prove that certain stages of prematurity are linked to specific quantitative MR metrics.
MATERIALS AND METHODS
Ethical Approval
The protocol of this study was approved by the local ethics commission and performed in accordance with the Declaration of Helsinki.
Study Cohort
Between June 2017 and August 2019, a total of 90 preterm and term-born neonates were examined at the neuroradiology department of a tertiary care hospital. All participants included in this study were referred for neonatal brain MR imaging by the Departments of Pediatrics and Adolescent Medicine, Neonatology, Pediatric Intensive Care, and Neuropediatrics. Indications for MR imaging included extremely preterm birth (GA: <28 + 0 weeks), clinical diagnosis of hypoxic-ischemic encephalopathy, intraventricular hemorrhage, and suspicion of cerebral infarction. Whereas premature infants were studied at approximately term-equivalent age in most cases, term-born neonates were examined between 2 and 48 days postpartum. Table 1 gives an overview of the clinical characteristics and demographic information of included neonates. All infants with proved or suspected pathology of the brain stem were excluded from the study.
Clinical characteristics and demographics
Data Acquisition, MDME Sequence, and Postprocessing
To prevent motion artifacts, neonates were either fed or slightly sedated (chloral hydrate [30–50 mg/kg] or chloral hydrate [30 mg/kg] combined with midazolam [0.1 mg/kg]) 30 minutes before MR imaging and positioned on a vacuum mattress. All neonates included in this study were subjected to a standard neonatal MR protocol (T1 spin-echo sequence [axial plane], T2 TSE sequence [3 orthogonal planes], DWI sequence, SWI sequence, T1 3D sequence) on an Ingenia 1.5 T MR system (Philips Healthcare). To obtain quantitative MR data, an MDME sequence (axial plane) was acquired using 2 repeated acquisition phases.21,24 One slice was saturated by the application of a slice-selective saturation pulse (flip angle: 120°) (first phase). A series of spin echoes was generated for another slice by the application of slice-selective excitation pulses (flip angle: 90°) and slice-selective refocusing pulses (flip angle: 180°) (second phase).20,21,24 A matrix with a variety of effects of T1 and T2 relaxation rates was acquired based on the mismatch between the image slice and the saturated slice.21,24 Transverse and longitudinal relaxation parameters were estimated using echo trains, characterized by different saturation delays.20,21,24 The local radiofrequency field (B1) was calculated based on the ascertained T1 relaxation constants.21 T1 and T2 relaxation parameters, as well as B1, allowed the PD to be estimated.20 SyMRI was used to perform MDME sequence-based image data postprocessing to generate quantitative MR maps (axial plane). Technical features of the individual sequences are shown in the Online Supplementary Data.
Bonferroni post hoc test results
Determination of Physical Properties
Five ROIs were defined to quantify T1R (ms), T2R (ms), and PD (%) of the neonatal brain stem: midbrain, pons (basis pontis and tegmentum pontis included), basis pontis (tegmentum pontis excluded), tegmentum pontis (basis pontis excluded), and medulla oblongata. Details regarding ROI placement are shown in Fig 1. The software calculates the average values of all relevant physical parameters based on relaxation time and PD detected in each voxel within the corresponding ROI. ROI placement was performed manually by 2 independent raters with at least 2 years of experience with neonatal MR imaging. Both investigators were blinded to GA at birth and age at MR imaging. During ROI placement, rater 1 performed a visual review of the MR image data. Participants were excluded from the study if incorrect measurements of the physical parameters had to be assumed on the basis of the visual assessment, for instance, because of the presence of distinct motion artifacts. Thus, data exclusion was performed before ROI placement in all excluded cases.
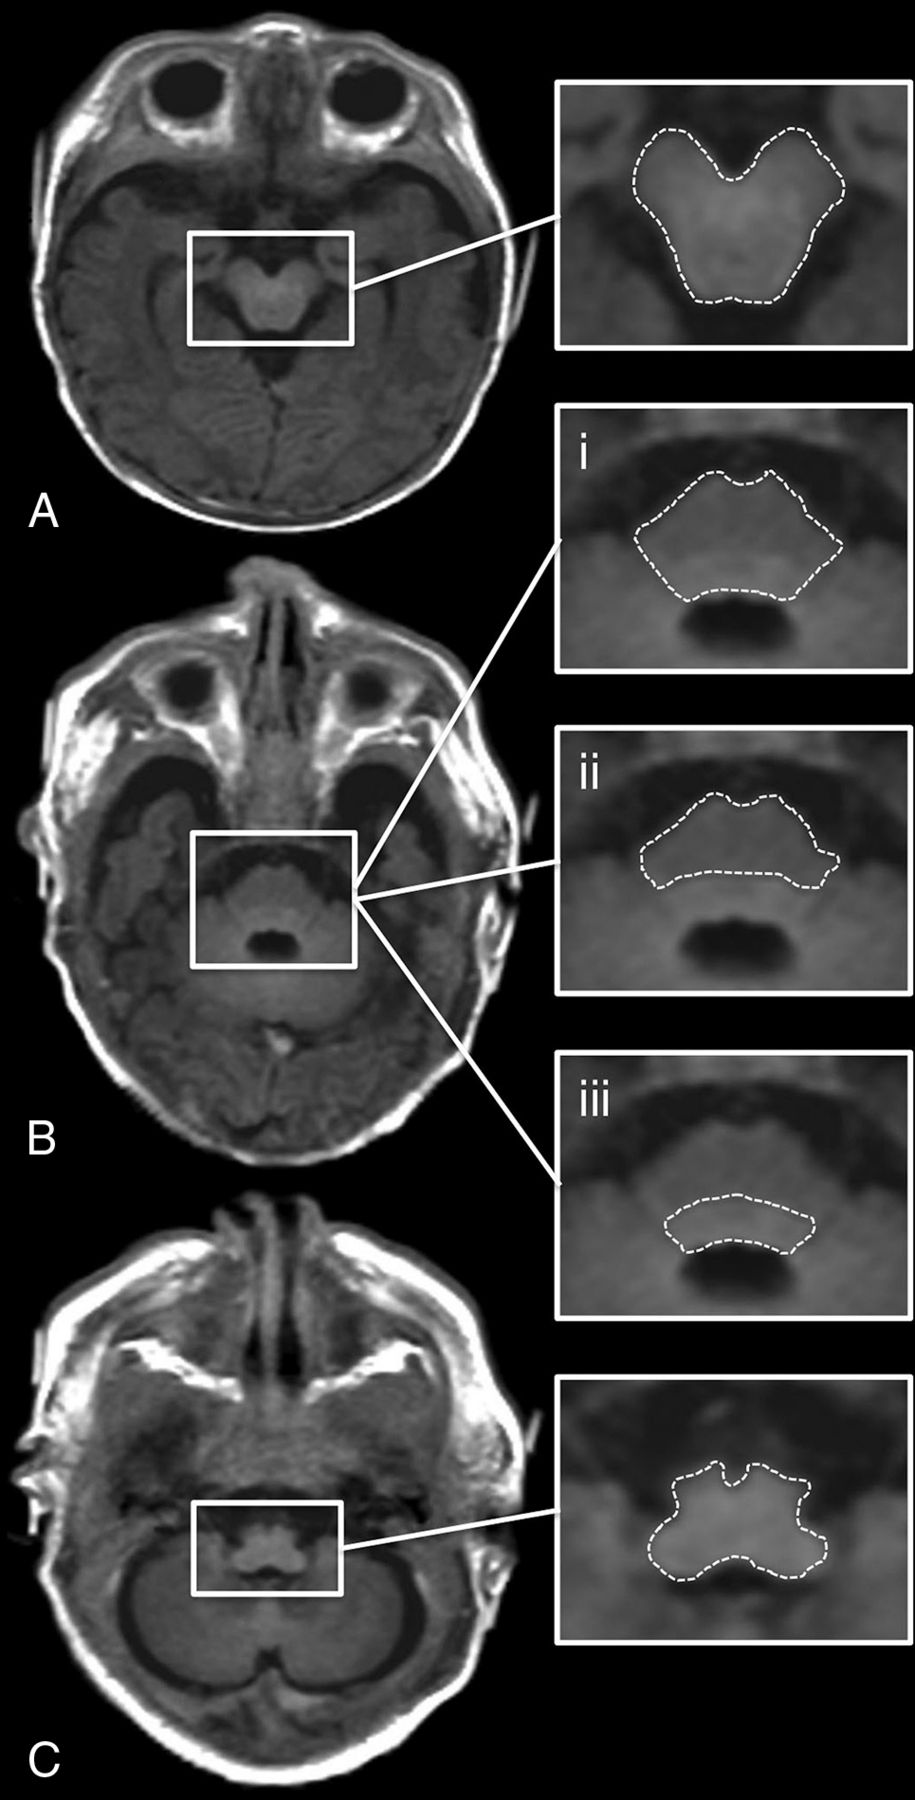
ROI placement is shown on an SyMRI-generated T1-weighted MR image (TR/TE = 650/10 ms) of a term-born neonate (GA: 40 + 1 weeks). A, Midbrain. B.i, Pons (basis pontis and tegmentum pontis included). B.ii, Basis pontis (tegmentum pontis excluded). B.iii, Tegmentum pontis (basis pontis excluded). C, Medulla oblongata.
Statistical Analyses
Participants were divided into 3 groups for comparison: extremely preterm (GA: <28 + 0 weeks), preterm (GA: 28 + 0–36 + 6 weeks), and term infants (GA: ≥37 + 0 weeks).9 Statistical analyses were performed using SPSS Statistics for Macintosh, version 25.0 (IBM, 2017) at a significance level of α = 5% (P < .05). Graphs were created using the statistics software R, version 3.6.3 (https://www.r-project.org). An intraclass correlation coefficient (ICC) was calculated for each ROI to detect concordances of the measurements of both raters. ICC values ≥0.75 were considered to represent a strong correlation.25 A Pearson correlation analysis was performed to assess correlations between GA at birth and the physical parameters determined in each ROI. ANCOVA (covariate: GA at MR imaging) and the post hoc Bonferroni test were applied to detect statistical differences in T1R, T2R, and PD between the groups. The reported results are based on data determined by rater 1.
RESULTS
Applicability of SyMRI for the Determination of the Physical Tissue Properties
A total of 55/90 (61.1%) neonates were enrolled in this retrospective study, including 30 extremely preterm (mean GA at birth: 25 + 5 weeks [SD = 1 + 4]), 10 preterm (mean GA at birth: 32 + 4 weeks [SD = 3 + 1]), and 15 term infants (mean GA at birth: 39 + 5 weeks [SD = 0 + 6]). In 35/90 (38.9%) cases, the applicability of SyMRI for the determination of T1R, T2R, and PD was not possible. In 23/35 participants, image quality was highly degraded because of motion artifacts; 6/35 neonates were excluded because of abnormal findings of the brain stem (superficial siderosis [n = 1], hypoxic tissue alterations of the pons [n = 1], dysplasia of the brain stem [n = 2], suspected AVM of the midbrain [n = 1], aqueductal stenosis [n = 1]); 1/35 participants was excluded because of neonatal hyperbilirubinemia, which is thought to interfere with brain stem functions and cognitive development26,27; and 5/35 infants were excluded because of lack of clinical information.
Interrater Statistics
The ICC analysis revealed a high degree of concordance between the T1R, T2R, and PD determined by both raters. For T1R: midbrain, 0.954 (CI: 0.921–0.973, P < .001); pons, 0.909 (CI: 0.585–0.966, P < .001); basis pontis, 0.965 (CI: 0.936–0.980, P < .001); tegmentum pontis, 0.895 (CI: 0.761–0.947, P < .001); and medulla oblongata, 0.975 (CI: 0.740–0.992, P < .001).
For T2R: midbrain, 0.925 (CI: 0.871–0.956, P < .001); pons, 0.848 (CI: 0.389–0.941, P < .001); basis pontis, 0.883 (CI: 0.743–0.940, P < .001); tegmentum pontis, 0.836 (CI: 0.666–0.913, P < .001); and medulla oblongata, 0.954 (CI: 0.760–0.983, P < .001).
For PD: midbrain, 0.832 (CI: 0.712–0.902, P < .001); pons, 0.908 (CI: 0.839–0.947, P < .001); basis pontis, 0.847 (CI: 0.563–0.931, P < .001); tegmentum pontis, 0.817 (CI: 0.686–0.893, P < .001); and medulla oblongata, 0.850 (CI: 0.743–0.912, P < .001).
Pearson Correlation Analysis
Negative correlations were observed between GA at birth and the T1R (determined in the midbrain [r = −0.852, P < .001], pons [r = −0.669, P < .001], basis pontis [r = −0.550, P < .001], tegmentum pontis [r = −0.790, P < .001], and medulla oblongata [r = −0.742, P < .001]), T2R (determined in the midbrain [r = −0.718, P < .001], pons [r = −0.366, P = .006], basis pontis [r = −0.277, P = .041], tegmentum pontis [r = −0.568, P < .001], and medulla oblongata [r = −0.414, P = .002]), and PD (determined in the pons [r = −0.275, P = .042] and the tegmentum pontis [r = −0.457, P < .001]) (Fig 2).

Pearson correlation between GA (weeks) at birth (x-axis) and physical MR parameters (y-axis) determined at term-equivalent age by rater 1. Left column: T1R (A–E). Middle column: T2R (F–J). Right column: PD (K–O).
No correlations were found between GA at birth and the PD determined in the midbrain (r = 0.062, P = .651), basis pontis (r = −0.255, P = .06), and medulla oblongata (r = −0.163, P = .233) (Fig 2).
Differences in the Physical Tissue Properties Between the Groups
ANCOVA revealed significant differences in T1R/T2R for the midbrain (T1R/T2R: P < .001), pons (T1R: P < .001), basis pontis (T1R: P = .005), tegmentum pontis (T1R/T2R: P < .001), and medulla oblongata (T1R: P < .001) between the groups. There were also significant differences in PD for the tegmentum pontis (P = .004) between the groups (Fig 3).

The boxplots show descriptive data for quantitative MR parameters (y-axis) of (1) neonates born <28 + 0 weeks GA, (2) neonates born between 28 + 0–36 + 6 weeks GA, and (3) neonates born ≥37 + 0 weeks GA (x-axis) determined at term-equivalent age by rater 1. Left column: T1R (A–E). Middle column: T2R (F–J). Right column: PD (K–O).
Although ANCOVA revealed significant results (P = .044), the post-hoc Bonferroni test did not detect significant differences in T2R for the medulla oblongata between the groups (P > .05). Based on T2R of the pons (P = .293) and basis pontis (P = .584), according to the corrections above and PD of the midbrain (P = .431), pons (P = .442), basis pontis (P = .472), and medulla oblongata (P = .384), no significant differences were found between the groups (Fig 3). Post hoc results are shown in Table 2.
DISCUSSION
In this study, the impact of prematurity on the tissue properties of the neonatal brain stem, determined at term-equivalent age, was investigated using the MR data postprocessing software SyMRI. Considerable correlations were observed between GA at birth and T1R/T2R, characterized by lower GA, which was associated with longer T1R/T2R and vice versa. In most cases, the physical properties of premature (GA: <37 + 0 weeks) and term infants differed significantly. Moreover, T1R/T2R determined in the midbrain enabled a reliable differentiation between extremely preterm, preterm, and term neonates. Overall, PD values showed the lowest correlations with GA at birth. Based on the data presented here, SyMRI, using quantitative MR parameters, can enable the characterization of cerebral development in different stages of prematurity and in term-born infants.
According to descriptions in the literature, myelination processes primarily lead to changes in T1R, T2R, and PD.14,15 These alterations affect the appearance of white matter on MR contrasts and allow brain maturation to be assessed qualitatively.1,5 However, based on the visual evaluation of conventional sequences, myelin-induced MR signal differences in preterm and term infants may be subtle and remain undetected in many cases.6 In addition, currently, techniques for the quantification of incomplete myelination are scarce. As described by Yakovlev and Lecours,28 the human brain stem already contains a multitude of myelinated fibers at the time of birth compared with other brain areas. Hence, the physical properties of this region best reflect the current stage of brain maturity.
In this study, the strongest correlations were observed between T1R and GA at birth. It is hypothesized that T1 shortening already occurs at stages of “premyelination” due to interactions between water molecules and isolated myelin components, such as cholesterol and glycolipids.29-31 This might explain the fact that T1R of the midbrain enabled a reliable discrimination between different stages of prematurity. Nonetheless, T1 shortening of other areas of the brain stem did not reveal similar results, though significant differences between premature and term infants were observed. As described in previous studies, iron deposition also affects the T1R and leads to specific MR signal changes during cerebral development.32,33 Thus, more pronounced T1 shortening in the mesencephalon, caused by the initial accumulation of iron components in the red nucleus, seems credible and could explain these findings.32 In addition, melanin shows biochemical interactions with ferric iron.32,33 However, it has been suggested that iron bound to the substantia nigra and other brain stem nuclei that contain melanin do not affect relaxation parameters before the 10th month of life.33
Furthermore, T2R of the midbrain revealed significant differences between extremely preterm, preterm, and term neonates. T2 shortening is initiated by tightening of fully developed myelin sheaths, which becomes most evident in advanced states of brain maturation.29-31 In extremely preterm infants, myelination is already detectable in the midbrain.1 Predominantly, the superior cerebellar peduncles and their decussation show an advanced maturation at this stage.1,28 Between 30 + 0–36 + 0 weeks GA, the myelin amount increases, which is detectable histologically.1 However, myelin-related changes are hardly detected during this period using a qualitative MR imaging approach.1 Our data indicate that quantitative MR metrics allow for the discrimination between different stages of prematurity on the basis of T2 shortening, whereas these subtle changes may not be detected visually.1 Based on T2R of the pontine tegmentum, differences between preterm and term neonates were observed. In contrast to other regions of the developing brain, myelin deposition is not detectable before 32 weeks GA in this part of the brain stem.1,28 Myelination progresses rapidly in this region and corroborates that T2 shortening is related to advanced states of brain maturity.1,29-31 However, no significant differences were found on the basis of T2R of the medulla oblongata. This region shows considerable myelination even before 30 weeks GA.1 Hence, the effect of T2 shortening on the differences between the groups may be limited. Compared with T2R, T1R indicated maturation differences more clearly. These results are consistent with the literature and may be attributed to the immediate response of T1 parameters to subtle maturation processes.4,29-31
Compared with T1R and T2R, PD indicated neonatal brain maturity less clearly. PD values refer to the concentration of water protons and may indicate the content of water in the investigated tissue.34 There is evidence that immature or demyelinated brain tissue contains higher proportions of water, which leads to increased PD values.14,21,35 As demonstrated by Lee et al,14 PD decreases in most brain areas during regular development. However, as opposed to T1 and T2 shortening, changes in PD occur considerably later and more slowly.14 This could explain the fact that no correlations between PD and GA at birth were observed in most areas of the neonatal brain stem. Nonetheless, significant results were found in the pons, particularly in the pontine tegmentum. PD determined in the tegmentum pontis revealed significant differences between preterm and term neonates. These data might confirm that maturity-related PD changes appear in a similar manner as T1R/T2R but more slowly.14 Interestingly, compared with preterm neonates, higher PD values were detected in the midbrains of term infants. These nonsignificant observations may be attributed to the impact of the cerebral aqueduct on PD determined in the mesencephalon. There is evidence that the size of the aquaeductus mesencephali increases in the course of development, which might lead to higher PD values because of higher H2O components.36 However, descriptions are rare with regard to the proportions of the ventricular system in mature and former premature infants.
As demonstrated in a previous study, delayed myelination is detectable in preterm neonates at the regular, expected due date.6 The data presented in this study are in line with descriptions in the literature.6 The specific novelty presented in this study is the fact that distinct maturational differences between different stages of prematurity can be identified noninvasively by novel MR acquisition strategies.
Prematurity leads to structural alterations of infratentorial regions.37 Furthermore, extremely preterm delivery is associated with disturbances in brain stem functions.38 As described by Antinmaa et al,39 impairment of the auditory pathway is highly associated with poor future verbal abilities in former preterm infants. Thus, preterm birth interferes with regular brain stem development and plays an important role in the pathogenesis of neurologic and psychiatric disorders.37,39,40 SyMRI enables brain maturation to be quantified and therefore allows for a more precise assessment of the neonatal brain stem at early stages of development. Quantitative MR metrics represent novel, clinically feasible diagnostic tools, enabling a more differentiated assessment of functionally important maturational stages in neonatal brain development. This opens further perspectives in pediatric brain imaging and may help physicians to predict neurodevelopmental disabilities in later life. However, this was outside the scope of the present study and should be the subject of future investigations.
This study has several limitations. The sample size was small and included pathologic cases that made the data provided inappropriate as reference data. Nonetheless, this technique bears the potential to make quantitative MR baseline data available for the assessment of brain maturity in preterm and term neonates. At the date of the MR imaging examination, term-born infants were relatively older than those born prematurely. Hence, statistical methods were used that allow for correction of the effect of GA at MR imaging on the data presented. The physical properties of supratentorial regions, such as the posterior limb of the internal capsule, which is considered highly myelinated by the regular due date, were not determined.28 This is attributed to the possibility of incorrect determination of T1R, T2R, and PD in participants with telencephalic brain damage. To determine brain maturity–related physical tissue properties unadulterated, participants without abnormal supratentorial findings should be investigated, which was not the case in the presented study cohort. However, the quantifiability of supratentorial brain maturity is an important topic and should be investigated in future studies. Finally, DWI and DTI have been demonstrated to be MR techniques that are sensitive enough to quantify the process of “premyelination.”41,42 An assessment of the relationship between DTI metrics and the mapping technique presented here was outside the scope of this work and should be further addressed in the future.
CONCLUSIONS
In summary, our data indicate that quantitative MR parameters determined at term-equivalent age enable the differentiation of preterm and term neonates. In addition, the method enables the distinction of different stages of prematurity. It can be concluded that SyMRI allows for a quantitative assessment of neonatal brain maturation by providing tissue-specific properties while not exceeding a clinically acceptable imaging time.
Footnotes
Disclosures: Gregor Dovjak—UNRELATED: Employment: Medical University of Vienna, Comments: The medical university, where this work originated, is my employer, so I get paid by them. Mariana Diogo—RELATED: Grant: Austrian Science Fund*; UNRELATED: Employment: Neuroradiology consultant, Comments: ITM; work as a neuroradiologist. Katrin Klebermass-Schrehof—UNRELATED: Payment for Lectures, Including Service on Speakers Bureaus: Chiesi Pharmaceuticals, Natus Medical Incorporated, Comments: Payment for lectures and workshops. Angelika Berger—UNRELATED: Grants/Grants Pending: Unrestricted and restricted research grants from Chiesi, Abbvie, Roche, Nestle, and Schülke. Payment for Lectures, Including Service on Speakers Bureaus: Lecture honoraria from Abbvie, Chiesi, and Schülke. Gregor Kasprian—UNRELATED: Consultancy: Bellaria Diagnostics, Comments: Consultant for fetal MRI at Bellaria Diagnostics; Employment: Medical University of Vienna; Grants/Grants Pending: FWF Austrian Science Fund, Comments: Grant outside submitted work. *Money paid to institution.
References
- Received June 6, 2020.
- Accepted after revision October 14, 2020.
- © 2021 by American Journal of Neuroradiology


Jump to section
Related Articles
Cited By...
- Synthetic MRI and MR Fingerprinting-Derived Relaxometry of Antenatal Human Brainstem Myelination: A Postmortem-Based Quantitative Imaging Study
- Synthetic MR Imaging-Based WM Signal Suppression Identifies Neonatal Brainstem Pathways in Vivo
- Different from the Beginning: WM Maturity of Female and Male Extremely Preterm Neonates--A Quantitative MRI Study
- Mapping Human Fetal Brain Maturation In Vivo Using Quantitative MRI