
Abstract
BACKGROUND AND PURPOSE: ADC changes are useful in detecting ischemic brain injury, but mechanisms other than tissue pathology may affect the kinetic movement and diffusion of water molecules. We aimed to determine the effects of brain temperature on the corresponding ADC in infants undergoing therapeutic hypothermia.
MATERIALS AND METHODS: Brain temperature and ADC values in the basal ganglia, thalamus, cortical GM, and WM were analyzed during and after therapeutic hypothermia. The study cohort was categorized as having no-injury or injury. Among infants without injury, the correlation between ADC values and temperature was analyzed using the Pearson correlation. Intrasubject comparison of ADC changes during and after therapeutic hypothermia were analyzed, excluding patients who had an MR image interval of >5 days to minimize the effects of injury evolution.
RESULTS: Thirty-nine infants with hypoxic-ischemic encephalopathy were enrolled (23 no-injury; 16 injury). The median ADC was significantly lower during therapeutic hypothermia (837; interquartile range, 771–928, versus 906; interquartile range, 844–1032 ×10−6mm2/s; P < .001). There was no difference in the ADC between the no-injury and injury groups during therapeutic hypothermia (823; interquartile range, 782–868, versus 842; interquartile range, 770–1008 ×10−6mm2/s; P = .4). In the no-injury group, in which ADC is presumed least affected by the evolution of injury, the median ADC was significantly lower during therapeutic hypothermia (826; interquartile range, 771–866, versus 897; interquartile range, 846–936 ×10−6mm2/s; P < .001). There was a moderate correlation between temperature and ADC in the no-injury group (during therapeutic hypothermia: Spearman ρ, 0.48; P < .001; after therapeutic hypothermia: ρ, 0.4; P < .001).
CONCLUSIONS: Aside from brain injury, reduced tissue temperature may also contribute to diffusion restriction on MR imaging in infants undergoing therapeutic hypothermia.
ABBREVIATIONS:
- HIE
- hypoxic-ischemic encephalopathy
- IQR
- interquartile range
- TH
- therapeutic hypothermia
Hypoxic-ischemic encephalopathy (HIE) is a major cause of childhood disability affecting neonates.1,2 Therapeutic hypothermia (TH) improves outcome by mitigation of secondary energy failure that follows initial hypoxic-ischemic injury. It has become the standard neuroprotective strategy for HIE.3,4 TH involves servo-controlled lowering of the body temperature to 33.5°C for 72 hours. Currently, MR imaging is the diagnostic imaging technique of choice to accurately assess the location and severity of brain injury in neonates with HIE.5,6 In addition to clinical examination and electroencephalography, MR imaging serves as an invaluable tool in the prognostication of long-term neurodevelopmental outcomes.
DWI is a commonly used MR imaging sequence for early detection of infarct or ischemic injury in HIE. Signal abnormalities on DWI appear before it is detectable on conventional T1-weighted and T2-weighted MR imaging.7,8 ADC is a quantitative value of DWI that measures the magnitude of water molecule diffusion within tissue. Aberrations in ADC detect regions of ischemic injury on the basis of the proposed principle that cytotoxic edema restricts Brownian motion of water molecules. Aside from injury, other biologic properties such as contraction of brain-water content and myelination in the developing neonate can also contribute to diffusional changes.9 According to kinetic molecular theory, movement of water molecules is temperature-dependent. A previous MR imaging phantom study also estimated that for each degree change in temperature (degrees Celsius), there is a 2.4% change in the diffusion coefficient.10 Therefore, when MR imaging is performed during TH, there may be an overall reduction in the diffusion coefficient secondary to decreased tissue temperature.
We previously reported the feasibility of noninvasive measurement of regional brain temperature by MR spectroscopy in neonatal HIE during TH.11,12 Because there is growing interest in the utility of early MR imaging in characterizing the timing and evolution of injury in HIE,13⇓-15 it is important to understand the effects of temperature on diffusion coefficients. Our study objectives were the following: 1) to describe ADC changes during and after TH, and 2) to determine the effect of tissue temperature on diffusion restriction or ADC in infants undergoing TH for suspected HIE. We hypothesized that lower brain temperature during TH is associated with lower mean diffusivity values on ADC maps.
MATERIALS AND METHODS
Population
Neonates with HIE admitted to Children’s Hospital Los Angeles for whole-body TH from December 2012 to February 2017 were enrolled in a research study to perform MR imaging studies at 2 time points: an “early” MR imaging during TH and a “late” MR imaging after TH. Selection criteria for TH were as follows: ≥35 weeks’ gestational age, ≥1800 g, ≤6 hours of life, severe perinatal acidosis (umbilical cord or infant blood gas ≤1 hour of life, pH ≤7, or base excess ≤–16), or moderate perinatal acidosis (umbilical cord gas or infant gas ≤1 hour of life, pH ≤7.15, or base excess ≤–10) and a history of an acute perinatal event or extended resuscitation (Apgar score, ≤5 at 10 minutes of life or assisted ventilation for >10 minutes). Last, documentation of abnormal findings on a Sarnat examination (moderate or severe) was the final requirement before cooling was initiated. Infants were excluded if they had congenital anomalies or if they were deemed clinically unstable for MR imaging. The institutional review board approved the study, and written parental consent was obtained for all enrolled infants. All infants underwent 72 hours of whole-body cooling with a target rectal temperature of 33–34°C, followed by rewarming at a rate of 0.5°C an hour.
MR Imaging
MR imaging was performed during and after TH on 3T MR imaging systems (Achieva and Ingenia; Philips Healthcare). During TH, the mean rectal target temperature was 33.5 (SD, 0.5)°C, and post-TH, the rectal temperature was approximately 36.5°C (4–8 days of age). Whole-body TH was actively maintained during transportation and MR imaging by a servo-controlled cooling device (Cincinnati Sub-Zero Blanketrol® III). A disposable custom water tubing was constructed to extend non-MR imaging–compatible devices to a safe distance during the scans. Rectal temperature was continuously monitored and remained within the target TH temperature range throughout the scan.15
In addition to T1-weighted and T2-weighted imaging, DWI and MR spectroscopy were also performed. DWI was performed with an echo-planar sequence with a TE of 66 ms, 4.5-mm section thickness, 4.5-mm spacing, 20- to 26-cm FOV, and a b-value of 1000 s/mm2. ADC maps were calculated using the Synapse Workstation (Version 4.4.3; Fujifilm Medical Systems). MR spectroscopy was acquired with a single-voxel point-resolved spectroscopic sequence (TE = 35 ms, TR = 2 seconds) and was processed with fully automated LCModel software (Version 6.3-1L; http://www.lcmodel.com/). Brain tissue temperatures were calculated from the chemical shift difference (provided by LCModel) between the water signal (temperature dependent) and metabolite signals (temperature independent).16 MR thermometry has an accuracy of approximately 0.2°C.11
ROIs for MR spectroscopy voxels (size, ∼3cm3) included the basal ganglia, thalamus, cortical GM, and parietal WM (Fig 1A). A single operator (C.Z.) visually inspected the MR spectroscopy ROIs on the axial view and identified the corresponding ADC map that was most comparable. C.Z. then manually traced the ADC ROI with care, so that it remained within the MR spectroscopy voxels. ADC ROI tracing was also performed for axial slices above and below it to account for the MR spectroscopy voxel volume (Fig 1B). Therefore, the ADCs from 3 ROIs were averaged for each brain region. The above steps ensured that the assessment of diffusion coefficients corresponded to the measured tissue temperatures derived from MR thermometry.

MR spectroscopy voxel placement and select regions of tissue temperature measurement (A). Sample manual tracing of ADC ROIs within the right basal ganglia voxels and averaging ADC values of 3 consecutive axial cuts (B). A indicates area of ROI; P, perimeter; M, mean ADC.
MR Imaging Injury Scoring and Clinical Outcome
The pattern and severity of injury on MR imaging were assessed by a board-certified pediatric neuroradiologist who was blinded to the clinical course of the infant. The method of injury scoring was based on previously published methods.11 For the purpose of the study, we dichotomized our cohort into 2 groups: the no-injury and injury groups. The no-injury group was designated when the injury scores in all brain regions were scored as zero in diffusion, T1, and T2 imaging. Injury scoring was based on the second MR imaging, which was obtained at a mean age of 6.9 (SD, 2.7) days. Clinical outcome was collected at 24–36 months of age. Poor outcome was defined as having any of the following: Gross Motor Function Classification System levels 3–5, Mental Developmental Index score of <70 on the Bayley Scales of Infant Developmental III, visual impairment with no useful vision, tracheostomy, gastrostomy tube, and death.
Statistical Analysis
Results are reported as mean (SD) or median (interquartile range [IQR]) values based on the D’Agostino-Pearson normality test. Comparison of ADC values during and after TH was performed using the 2-tailed Wilcoxon matched pairs signed-rank test. Comparison of ADC values between the no-injury and injury groups was performed using the Mann-Whitney (median) and Kolmogorov-Smirnov tests (cumulative distribution). The relationship between temperature and ADC was analyzed using the Spearman ρ correlation. Statistical significance was set at P < .05. When we compared multiple brain regions, a Bonferroni adjustment was applied (P < .05/4 regions), and the P value for significance was set at P < .0125 for regional comparisons. All statistical testing and graphing were performed using GraphPad Prism software 9.0 (GraphPad Software) and SPSS, Macintosh Version 27 (IBM).
RESULTS
Data from 39 infants (15 males, 24 females) with HIE were analyzed. The mean gestational age was 39 (SD, 2) weeks, and the mean birthweight was 3237 (SD, 607) g. Mean Apgar scores were 2 (SD, 2) and 4 (SD, 2) at 1 and 5 minutes of life, respectively. The mean cord pH was 6.9 (SD, 0.1) and base excess was -16.6 (SD, 5.1). All patients began whole-body TH before 6 hours of postnatal life. The no-injury and injury groups consisted of 23 and 16 neonates, respectively (Table). The mean duration between MR images (during/after TH) was 4.7 (SD, 2.5) days. There was no difference in the mean time interval of MR images (during/after TH) between the no-injury and injury groups (4.5 [SD, 2.5] days versus 4.8 [SD, 2.8] days; P = .72). On the first MR imaging, which was obtained during TH at a mean age of 54 (SD, 14) hours, the median ADCs in the standardized ROIs were not significantly different between the no-injury and injury groups (823; IQR, 782–868, versus 842; IQR, 770–1008 ×10−6mm2/s; P = .4). However, there was a statistical difference in the cumulative distribution (Kolmogorov-Smirnov test, P < .02; Fig 2). The brain temperature during and after TH was 33.5 (SD, 0.9)°C (range, 31.5–36.7°C) and 36.7 (SD, 1.0)°C (range, 33.7–39.9°C), respectively.
Clinical demographics of study cohorta
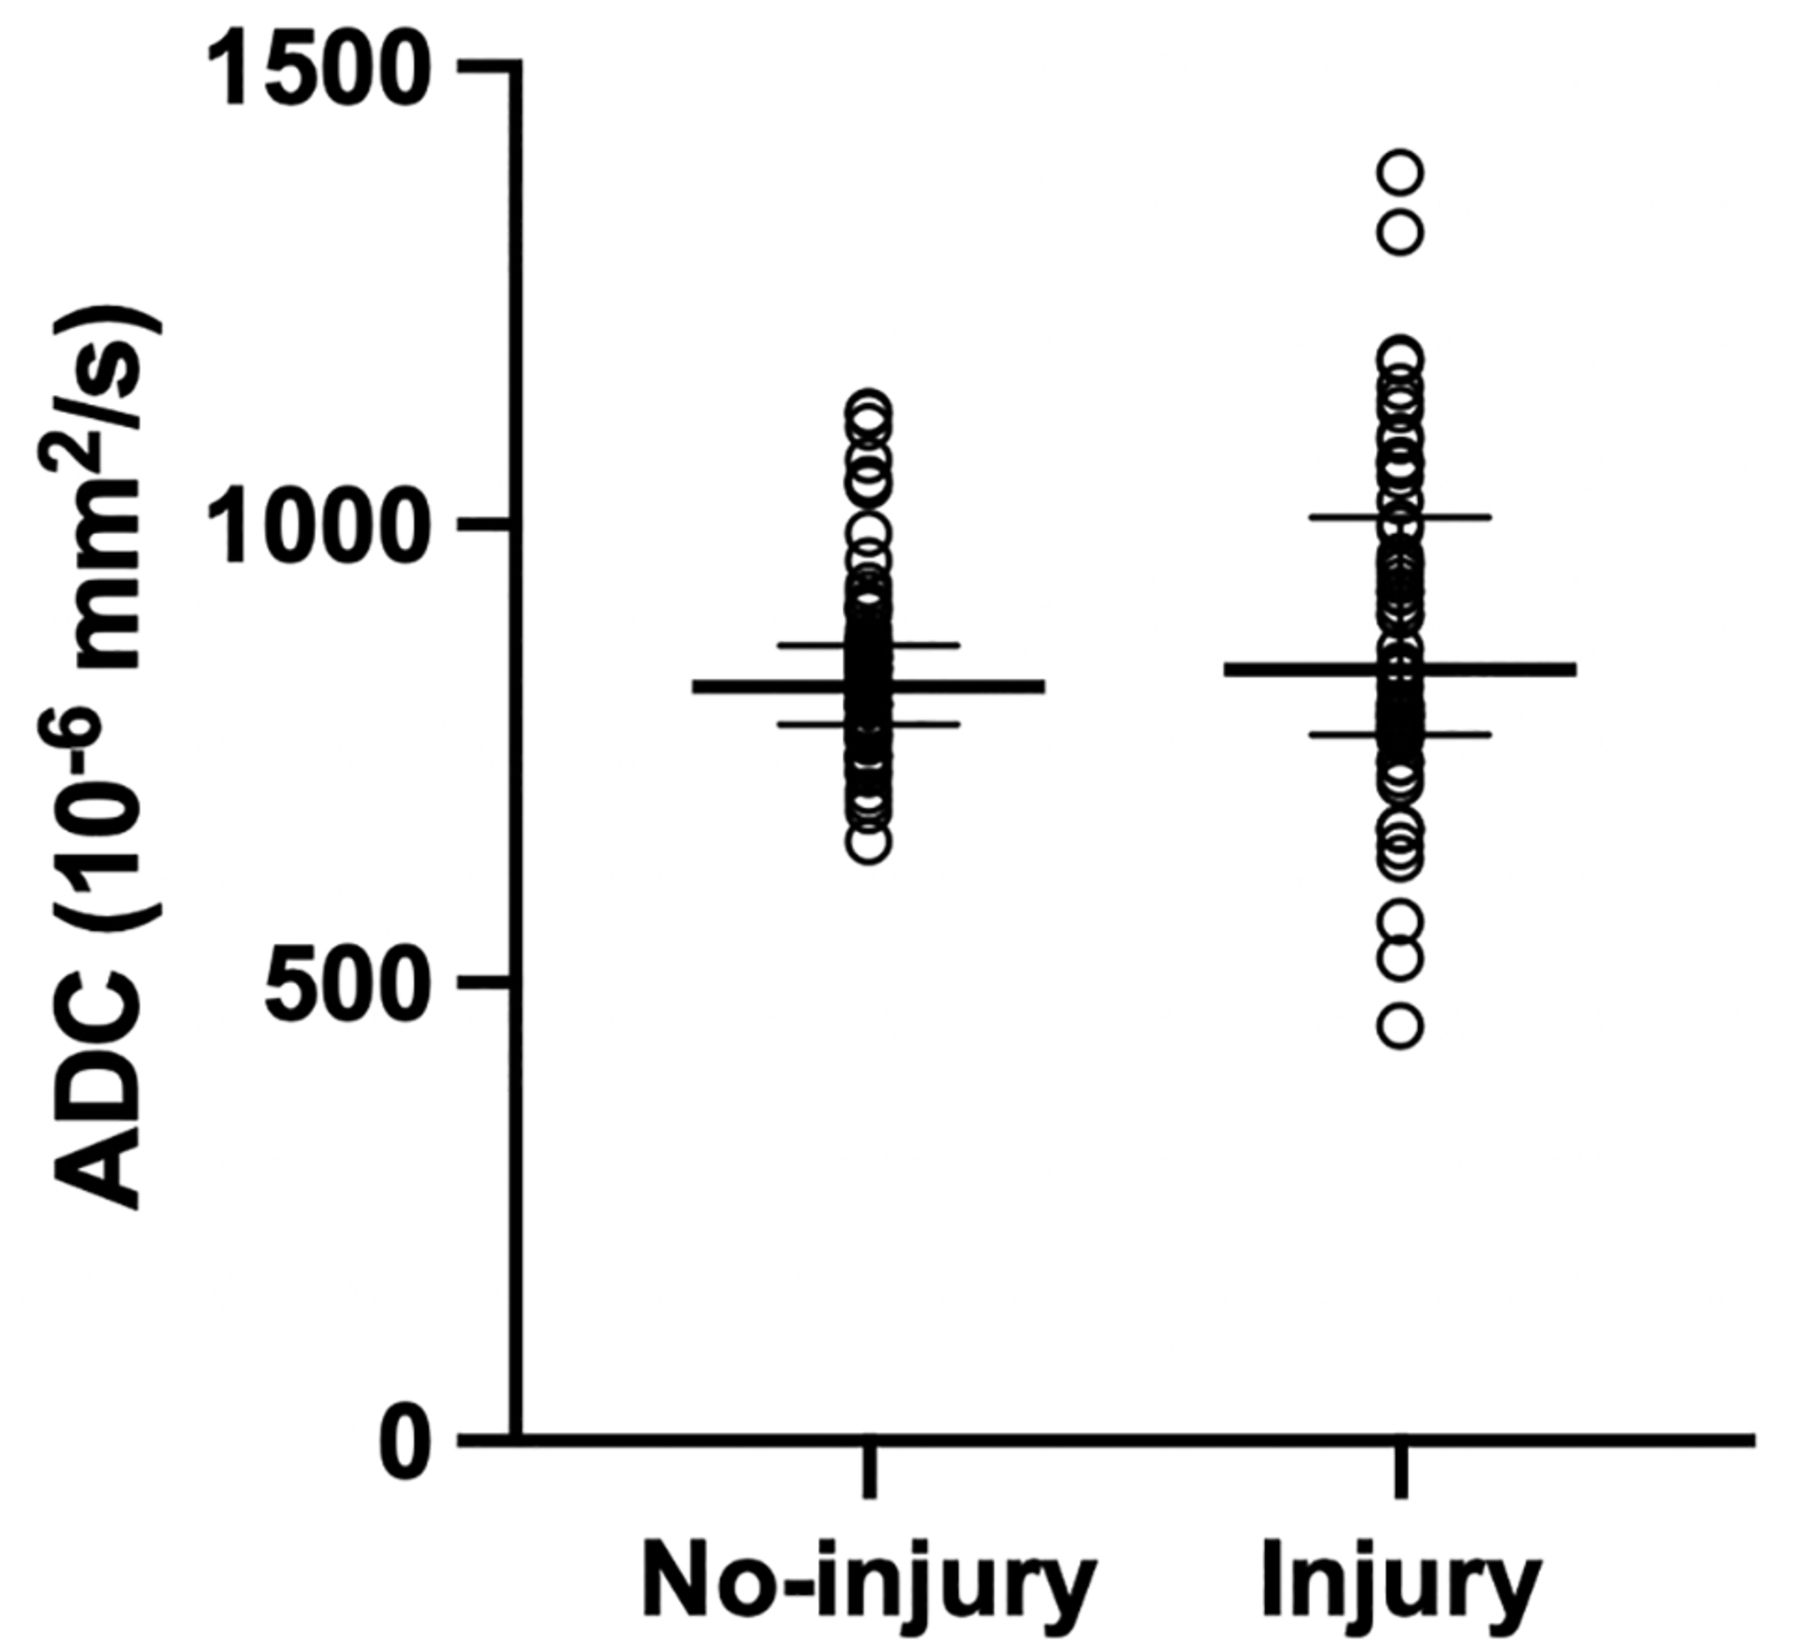
Baseline ADC on early MR imaging in the no-injury-versus-injury groups. Black thick horizontal lines represent medians, and thin horizontal lines represent IQRs. There was no statistical difference in the median ADC (Mann-Whitney, P = .4), but the cumulative distribution (Kolmogorov-Smirnov, P < .02) was different between groups.
Overall, the median ADC was significantly lower during TH compared with after TH (837; IQR, 771–928, versus 906; IQR, 844–1032 ×10−6mm2/s; P < .001). In the no-injury group, in which the ADC is presumed to be least affected by the evolution of injury, the median ADC was still significantly lower during TH than after TH (826; IQR. 771–866, versus 897; IQR, 846–936 ×10−6mm2/s; P < .001). Of note, among all paired ADC measurements (n = 135), 93% were higher after TH (Fig 3).

Changes in ADC from during TH to after TH in the no-injury (A) and injury groups (B).
When we analyzed the relationship between regional brain temperature and ADC in the no-injury group, there was a moderate correlation both during TH (Spearman ρ, 0.48; P < .001; Fig 4A) and after TH (Spearman ρ, 0.4; P < .001). The strongest correlation was seen in the basal ganglia during TH (Spearman ρ, 0.64; P < .001). On average, ADC values increased ∼22 ×10−6mm2/s per degree Celsius change in brain temperature (Δ ADC /Δ brain temperature) from cooling to normothermia. This is equal to a 2.7% ADC increase per degree Celsius change [(897–826)/826 × 10−6mm2/s per 3.1°C]. The slopes of the best-fit lines by linear regression were similar during and after TH (b-values, 46.5 and 47.2) (Fig 4B). In the injury group, the correlation between temperature and ADC was no longer significant in all regions. For detailed regional correlations between temperature and ADC refer to the Online Supplemental Data.

Relationship between ADC and brain temperature during TH in the no-injury group color coded by ROIs (A). The relationship between ADC and brain temperature during TH (blue circles) and after TH (red squares) in no-injury group (B). Best-fit curves by linear regression are shown. The lines appear parallel (similar b-values) and signify that the ΔADCs per ΔTemperature are similar during and after TH. Note the difference in the y-intercept of the 2 best-fit lines, which could be secondary to postnatal brain-water content changes during the first week of life.
DISCUSSION
We evaluated ADC changes in neonates with HIE during and after TH. We found that 93% of ADC was higher during normothermia than during hypothermia. In comparing baseline ADCs from the first MR imaging during TH, we found that the injury group had a wide distribution of ADCs, ranging from 454 to 1385. Last, when we correlated tissue temperature measured by MR thermometry and ADC in 4 brain regions, we found a moderate and significant correlation between tissue temperature and ADC.
The natural course of ADC changes after injury is initial diffusion restriction followed by a slow increase to normal diffusion. This phenomenon, known as “pseudonormalization,” typically occurs 8–10 days after injury.17 In the era of TH, the time to pseudonormalization may be delayed to 11–12 days for reasons not completely understood.18 If one followed that timeline, it is expected and confirmed in our study that most ADC investigated in our study would be lower during TH, likely secondary to effects of the temperature-dependence of water molecule movement and/or time-dependent changes of diffusion after ischemic injury. We limited our data analysis to infants who had 2 MRIs within 5 days to limit the intrasubject time-dependent effects of injury, fluid status, or myelination on ADC change. On the other hand, 7% of the paired measurements had a lower ADC after TH. The implication for worsening restricted diffusion in this small sample size is unknown but may signify ongoing injury or may represent the proximity of the 2 MR images, leading to detection of the diffusion restriction “nadir” on the second scan. In a small study that compared ADC values from 2 consecutive scans at a timing comparable with that in our study, the lack of pseudonormalization or “pseudonormalization negativity” on the second MR imaging portrayed poor neurologic outcome.19 Because our study was focused on understanding the effects of temperature on ADC, we cannot deduce the clinical impact of a prolonged pseudonormalization time.
When we compared ADC values between the no-injury and injury groups, it was surprising to find no difference in the median ADC (Fig 2) during TH. There was, however, a difference in the distribution of the ADC, ie, a wider distribution in the injury group. These results suggest that the injury group may consist of patients with varying injury severity and timing (subacute versus acute). Indeed, it is estimated that only about one-third of infants with HIE experienced a sentinel event that suggested acute insult.20 Additionally, neonates with HIE are 3 times more likely to have findings consistent with global fetal vascular malperfusion on placental examinations compared with typically developing neonates.21 Another recent study found that placental abnormalities were less likely to be associated with subcortical or acute injury on MR imaging, a finding that underscores the contributory role of chronic or subacute placental malperfusion in the complex pathophysiology of neonatal HIE.22
Although TH is intended for mitigation of secondary energy failure within 6 hours of injury, the timing of the injury is often unclear and difficult to ascertain clinically. Therefore, the wide distribution of ADC in the injury group is reflective of the heterogeneous nature of injury timing and etiology, which is represented by diffusion restriction, pseudonormalization, or hyperdiffusivity, likely also explaining the finding that there was only a significant correlation between ADC and temperature in the no-injury group and not the injury group, in which injury impacts ADC more than temperature does. We should interpret any comparison or correlation with the injury group with care, due to the unknown timing and severity of injury that can influence the ADC in different directions. Furthermore, because our objective was to evaluate changes in ADC with temperature changes, our analysis was restricted to the standardized ROIs used for MR spectroscopy/thermometry, which may not necessarily coincide with areas of restricted diffusion in HIE.
In line with our hypothesis, decreased tissue temperature was associated with a decrease in ADC. The positive correlation between tissue temperature and ADC is most evident in the no-injury group during TH and, to a certain extent, after TH. The slopes of the best-fit lines derived from linear regression are similar during and after TH, further affirming the notion that temperature affects ADC (Fig 4B). When we calculated the ADC change due to temperature in the no-injury group, we observed a 2.7% ADC change per degree Celsius. This estimation compares well with a previous phantom study by Bihan et al,10 in which each degree Celsius change was associated with a 2.4% change in the diffusion coefficient. If one assumes a linear relationship, if baseline ADC is 900 ×10−6mm2/s at normothermia, a decrease of 3°C during TH may decrease the ADC by about 8.1% or to 827 ×10−6mm2/s (3°C × 2.7% × 900 × 10−6mm2/s).
In addition, we noticed that although the slopes of the best-fit lines were similar during and after TH, the y-intercept was lower in the group measured at normothermia. The distinguishing differences between the 2 groups are body temperature (33.5 versus 36.5°C) and postnatal age (2 versus 5 days of life). With increasing postnatal age, there is a rapid decrease in brain-water content in the developing neonate. It is plausible that a decrease in total extracellular water content contributed to restriction diffusion (lower y-intercept).9,23 A reduction in ADC may be attributed to a higher b-value as described by Dudink et al.24 However, we applied a b-value of 1000 s/mm2 to the DWI of all patients. Any reduction in ADC would be systematic, and the percentage change would not be affected. We also found that the correlation between temperature and ADC was strongest at the subcortical regions investigated but less in GM or WM. These findings may be an important consideration for clinicians who use diffusion changes to determine the severity of brain injury, in carefully interpreting restricted diffusion during hypothermia.
Our study has some limitations. First, there was a selection bias in analyzing the data of patients whose time between MR images was ≤5 days. This was intended to minimize the effects of pseudonormalization and injury evolution but could also select for a population of lower clinical acuity. However, none of the patients had poor outcome in the no-injury group, while 50% had poor outcome in the injury group at 24–36 months of follow-up.
CONCLUSIONS
The study shows a moderate correlation between tissue temperature and ADC. Other than tissue injury, temperature can contribute to diffusion restriction during therapeutic hypothermia.
Footnotes
This work was funded by the National Institutes of Health, K23HD099309; the Reiling Family Foundation; the Newborn Neuroprotection Research Grant; and the Rudi Schulte Research Institute.
Disclosure forms provided by the authors are available with the full text and PDF of this article at www.ajnr.org.
Indicates open access to non-subscribers at www.ajnr.org
References
- Received September 29, 2021.
- Accepted after revision November 22, 2021.
- © 2022 by American Journal of Neuroradiology


Jump to section
Related Articles
Cited By...
- No citing articles found.