
Abstract
BACKGROUND AND PURPOSE: CNS lesions of tuberous sclerosis complex are diagnosed mainly by T2WI, FLAIR, and sometimes T1WI with magnetization transfer contrast. The usefulness of T1WI with chemical shift selective images was recently reported in focal cortical dysplasia type IIb, which has histopathologic and imaging features similar to those of tuberous sclerosis complex. We investigated the usefulness of the T1WI with chemical shift selective images in detecting CNS lesions of tuberous sclerosis complex.
MATERIALS AND METHODS: We retrospectively reviewed 25 consecutive patients with tuberous sclerosis complex (mean age, 11.9 [SD, 8.9] years; 14 males) who underwent MR imaging including T1WI, T1WI with magnetization transfer contrast, T1WI with chemical shift selective, T2WI, and FLAIR images. Two neuroradiologists assessed the number of CNS lesions in each sequence and compared them in 2 steps: among T1WI, T1WI with magnetization transfer contrast and T1WI with chemical shift selective images, and among T2WI, FLAIR, and T1WI with chemical shift selective images. We calculated the contrast ratio of the cortical tubers and of adjacent normal-appearing gray matter and the contrast ratio of radial migration lines and adjacent normal-appearing white matter in each sequence and compared them.
RESULTS: T1WI with chemical shift selective images was significantly superior to T1WI with magnetization transfer contrast for the detection of radial migration lines and contrast ratio of radial migration lines. There was no significant difference between T1WI with chemical shift selective images and T1WI with magnetization transfer contrast for the detection of cortical tubers and the contrast ratio of the cortical tubers. Both T2WI and FLAIR were statistically superior to T1WI with chemical shift selective images for the detection of cortical tubers. T1WI with chemical shift selective images was significantly superior to T2WI and FLAIR for the detection of radial migration lines.
CONCLUSIONS: The usefulness of T1WI with chemical shift selective images in detecting radial migration lines was demonstrated. Our findings suggest that the combination of T1WI with chemical shift selective images, T2WI, and FLAIR would be useful to evaluate the CNS lesions of patients with tuberous sclerosis complex in daily clinical practice.
ABBREVIATIONS:
- CR
- contrast ratio
- FCD
- focal cortical dysplasia
- ICC
- intraclass correlation coefficient
- NAGM
- normal-appearing gray matter
- NAWM
- normal-appearing white matter
- RML
- radial migration line
- SEN
- subependymal nodule
- T1WI-CHESS
- T1WI with chemical shift selective
- T1WI-MTC
- T1WI with magnetization transfer contrast
- TSC
- tuberous sclerosis complex
Tuberous sclerosis complex (TSC) is an autosomal dominant multisystem disorder characterized by hamartomas in multiple organ systems, including the brain, skin, heart, kidneys, and lungs. TSC is caused by mutations in the tumor-suppressor gene TSC1 or TSC2, encoding hamartin and tuberin, respectively.1,2 The TSC1-TSC2 (hamartin-tuberin) complex is a critical regulator of the mammalian target of the rapamycin signaling cascade, which serves as a ubiquitous regulator of cell metabolism, growth, proliferation, and survival.3⇓-5 Brain manifestations of TSC are characterized by cortical tubers, WM abnormalities (radial migration lines [RMLs]), and periventricular subependymal nodules (SENs).6⇓-8 On MR imaging, cortical tubers and RMLs are diagnosed mainly by T2WI or FLAIR images.9 The effectiveness of T1WI with magnetization transfer contrast (T1WI-MTC) imaging has been reported,10⇓⇓-13 but the usefulness of other MR images has not been reported since then.
Today, somatic mutations in the mammalian target of rapamycin pathway genes are well-known as a common cause of focal cortical dysplasia (FCD).14 Pathologically, balloon cells that have an enlarged cell body with eosinophilic cytoplasm are a pathognomonic cellular feature of FCD type IIb and TSC. On the basis of the morphologic and genetic similarities between FCD type IIb and cortical tubers in TSC, it has been hypothesized that FCD is a forme fruste of TSC.15⇓-17
Earlier research demonstrated that a T1WI high-signal area of the WM lesions of FCD type IIb was correlated with the cellularity of balloon cells, independent of calcifications.18 Another case report also observed that T1WI with chemical shift selective (T1WI-CHESS) imaging, which is the most frequently used technique for the fat-suppression pulse, could clearly visualize the T1WI high-signal area in FCD type IIb because of its background signal suppression due to the magnetization transfer effect and the fat suppression of normal WM, which contains fat-rich myelin.19 Moreover, the superiority of T1WI-CHESS compared with T1WI-MTC was reported for neuromelanin imaging.20
With this background, we hypothesized that T1WI-CHESS can visualize RMLs more clearly than conventional MR images, including T1WI-MTC. We, thus, conducted the present study to investigate the usefulness of T1WI-CHESS in CNS lesions of patients with TSC.
MATERIALS AND METHODS
Patients
This retrospective study was approved by the institutional review board of Japan’s National Center of Neurology and Psychiatry, and the need for patient informed consent was waived. We retrospectively analyzed the cases of 36 consecutive patients diagnosed with TSC who underwent brain MR imaging between July 2018 and June 2021 at the National Center of Neurology and Psychiatry. The diagnosis of TSC was made according to the updated diagnostic criteria issued by the 2012 International Tuberous Sclerosis Complex Consensus Conference.21 Among the 36 patients, 27 underwent brain MR imaging including T1WI, T1WI-MTC, T1WI-CHESS, T2WI, and FLAIR, and these images were obtained for the imaging evaluation. The patient exclusion criteria were as follows: 1) the patient having undergone neurosurgery within the prior 12 months, 2) the coexistence of other intracranial diseases, and 3) the presence of severe motion or metal artifacts.22 As a result, 2 patients were excluded from this study according to criteria 1 and 2, respectively (Fig 1). The cases of the remaining 25 patients were analyzed. In addition to the 25 patients with TSC, we examined the pathologic correlation with T1WI-CHESS in 1 patient whose preoperative MR imaging study did not have T1WI-MTC.

Study flow chart. NCNP indicates National Center of Neurology and Psychiatry.
MR Imaging Procedures
All patients underwent MR imaging in a 3T MR imaging scanner (Magnetom Verio; Siemens) with a 32-channel head coil, including axial T1WI, T1WI-MTC, T1WI-CHESS, T2WI, and 3D-FLAIR imaging. The T1WI, T1WI-MTC, and T1WI-CHESS images were acquired with the following parameters: TR/TE/NEX = 620 ms/9.5 ms/3, matrix = 184 × 256, FOV = 210 × 167.3 mm, section thickness = 3 mm with 1.2-mm intersection gaps. Turbo spin-echo T2WI was performed with the following parameters: TR/TE/NEX = 5000 ms/81 ms/2, matrix = 348 × 512, FOV = 220 × 199.4 mm, section thickness = 3 mm. 3D-FLAIR images were acquired with the following parameters: TR/TE/NEX = 5000 ms/413 ms/1, matrix = 246 × 256, FOV = 250 × 250 mm, section thickness = 1 mm.
Definition of CNS Lesions
The definitions of cortical tubers, RMLs, and SENs were based on previous studies.12,22 Cortical tubers were defined as gyral expansion or distortion and/or signal abnormalities in the subcortical WM. RMLs were defined as linear abnormalities oriented from the cortical surface to the ventricular wall or as the presence of focal nodular lesions in this pathway. SENs were defined as lesions that originated from the lateral ventricle walls and penetrated the ventricles. In this study, we did not differentiate the SENs from subependymal giant cell tumors because doing so was outside the scope of the study.
Visual Assessment
Two neuroradiologists (H.F. and Y.K., with 11 and 15 years of experience in neuroradiology, respectively) independently evaluated all images to assess the number of cortical tubers, RMLs, and SENs on T1WI, T1WI-MTC, T1WI-CHESS, T2WI, and FLAIR images. Differences in their evaluations were resolved by consensus. We compared the detectability of the cortical tubers, RMLs, and SENs in the following 2 steps: First, we compared it among the T1WI, T1WI-MTC, and T1WI-CHESS images to assess the detection ability of T1WI-CHESS (hereafter referred to as step 1). Next, we compared it among T2WI, FLAIR, and T1WI-CHESS images to assess the clinical usefulness of T1WI-CHESS as a routine sequence in daily clinical practice (hereafter referred to as step 2). We also calculated the interobserver reproducibility.
Semiquantitative Analysis
We determined the contrast ratio of the cortical tubers and adjacent normal-appearing gray matter (NAGM) on T1WI, T1WI-MTC, and T1WI-CHESS and compared the ratios among them. We measured the most evident cortical tuber in each patient as determined by the 2 evaluators. The signal intensities of the cortical tubers and adjacent NAGM were calculated using the ImageJ software program (National Institutes of Health). In each of the T1WI, T1WI-MTC, and T1WI-CHESS images, both evaluators measured the signal intensity of the cortical tuber using 7-mm2 round cursors.20 The signal intensity of the adjacent NAGM was measured in the same way, using 13-mm2 round cursors.20
The contrast ratios (CRs) of the cortical tubers and the NAGM were calculated as CRtuber = (Stuber/SNAGM), where Stuber and SNAGM denote the signal intensities of the cortical tubers and NAGM, respectively. In the same way, we evaluated the CRs of the RML and adjacent normal-appearing white matter (NAWM) on T1WI, T1WI-MTC, and T1WI-CHESS and compared the ratios among them. The CRs of the RML and the NAWM were calculated as CRRML = (SRML/SNAWM), where SRML and SNAWM denote the signal intensities of the RML and NAWM, respectively. The 2 evaluators’ values were averaged. We calculated the interobserver reproducibility of each evaluator’s value.
Clinical Information
The patients’ medical records were reviewed, and seizure frequency and intellectual disability were evaluated by a board-certified pediatric neurologist (N. Sumitomo). Seizure frequency was evaluated on a 5-point scale: 1 = seizure-free >1 year, 2 = yearly seizures, 3 = monthly seizures, 4 = weekly seizures, 5 = daily seizures.23 Intellectual disability was categorized as 0–4 scores (0 = normal, 1 = mild disability, 2 = moderate disability, 3 = severe disability, 4 = profound disability).24 We examined the correlation between seizure frequency and the number of CNS lesions and between the severity of intellectual disability and the number of CNS lesions.
Correlations between MR Imaging Findings and Pathologic Findings
The correlation between MR imaging findings and pathologic findings was examined, focusing on the cause of hyperintensity on T1WI-CHESS. Two patients had undergone an operation and MR imaging including T1WI-CHESS; 1 patient was excluded from a detailed pathologic examination because of the presence of massive calcifications. The resected specimen was examined by a board-certified neuropathologist (M.M.).
Statistical Analyses
The interobserver reproducibility of the number of the CNS lesions, CRtuber, and CRRML, in each sequence was calculated using the intraclass correlation coefficient (ICC) and was deemed slight (ICC ≤ 0.2), fair (0.2 < ICC ≤ 0.4), moderate (0.4 < ICC ≤ 0.6), substantial (0.6 < ICC ≤ 0.8), or almost perfect (0.8 < ICC ≤ 1).
We used a nonparametric test, ie, the Friedman test, to perform the following: 1) compare the detection of the cortical tubers, RMLs, and SENs among T1WI, T1WI-MTC, and T1WI-CHESS in step one; 2) compare the detection among T2WI, FLAIR, and T1WI-CHESS in step 2; and 3) compare the CRtuber and CRRML values among T1WI, T1WI-MTC, and T1WI-CHESS. The significance level of the post hoc test was determined with a Bonferroni correction. The data are expressed as the mean (SD). A P value < .05 was considered significant.
We performed a Spearman rank correlation analysis to assess the association between seizure frequency and the number of cortical tubers, RMLs, and SENs in each sequence and to assess the association between intellectual disability and the number of cortical tubers, RMLs, and SENs in each sequence. The statistical analyses were performed using SPSS (Version 28.0; SPSS Tokyo).
RESULTS
Demographic Characteristics of the Patients with TSC
The 25 patients’ characteristics are summarized in the Online Supplemental Data. Of the 25 patients, 14 were male, 11 were female, and the mean age was 11.9 [SD, 8.9] years. The mean seizure frequency and intellectual disability scores were 3.4 (SD, 1.6) and 2.1 (SD, 1.2), respectively. Representative images are shown in Figs 2 and 3.

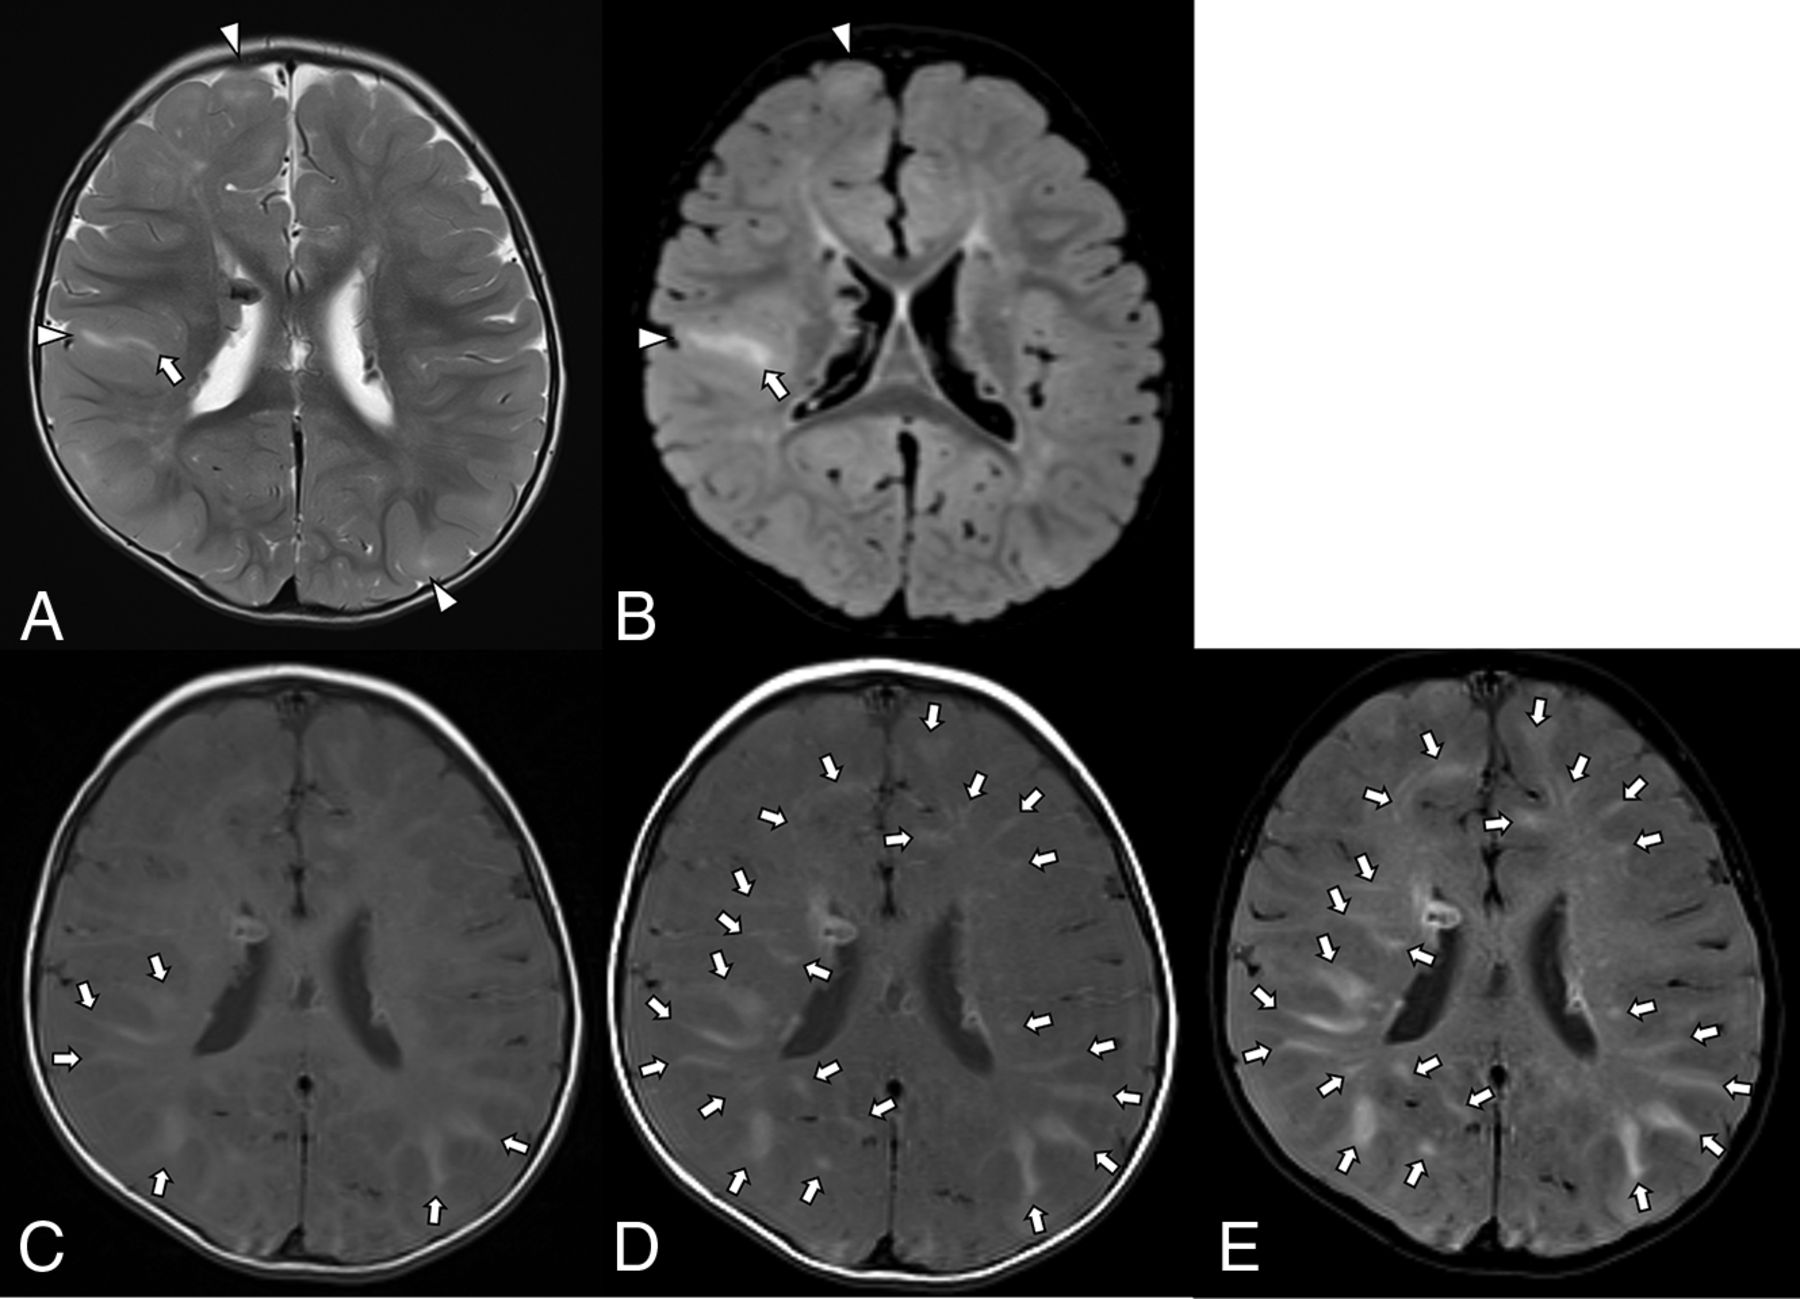
Patient 19. A 26-month-old boy. Axial T2WI (A), FLAIR (B), T1WI (C), T1WI-MTC (D), and T1WI-CHESS (E). T2WI and FLAIR images demonstrate swelling of the cortex and subcortical hyperintensity, plus a linear hyperintensity extending to the ventricle, representing cortical tubers and RMLs, respectively (A and B, arrowheads and arrows, respectively). On T1WI, several RMLs can be seen as hyperintensity (C, arrows). The RMLs are more apparent on T1WI-MTC and especially on T1WI-CHESS (D and E, arrows).

Patient 4. A 29-year-old woman. Axial T2WI (A), FLAIR (B), T1WI (C), T1WI-MTC (D), and T1WI-CHESS (E). T2WI and FLAIR images demonstrate swollen cortices, some of which are accompanied by subcortical hyperintensities, representing cortical tubers (A and B, arrowheads). Linear hyperintensities in the subcortical area extending to the ventricle are observed, representing the RMLs (A and B, arrows). On T1WI, an RML is found in the right parietal lobe (C, arrow). T1WI-TMC and T1WI-CHESS are able to detect more RMLs than T1WI, T2WI, and FLAIR (D and E, arrows). The RMLs are more apparent on T1WI-CHESS than on T1WI-MTC (D and E, arrows). Although no obvious cortical tuber is shown by T1WI, both T1WI-MTC and T1WI-CHESS detect a cortical tuber as a slight hyperintensity (D and E, arrowheads).
Visual Assessment
The numbers of cortical tubers, RMLs, and SENs are listed in Table 1. The interobserver reproducibility of T1WI-MTC and T1WI-CHESS for cortical tubers, T2WI and T1WI-CHESS for RMLs, and FLAIR for SENs was substantial, and for the rest, it was almost perfect (Table 2).
The number of CNS lesions in each sequencea
Interobserver reproducibility of the number of CNS lesions in each sequence
The results of the comparison of the detection of the CNS lesions among T1WI, T1WI-MTC, and T1WI-CHESS in step 1 are provided in Table 3. Both T1WI-MTC and T1WI-CHESS were significantly superior to T1WI for the detection of cortical tubers, RMLs, and SENs. T1WI-CHESS was significantly superior to T1WI-MTC for detecting RMLs, whereas there was no significant difference between them in the ability to detect cortical tubers or SENs.
Comparison of the detection of CNS lesions among T1WI, T1WI-MTC, and T1WI-CHESS
Table 4 presents the results of the comparison of the detection of CNS lesions among T2WI, FLAIR, and T1WI-CHESS in step 2. Both T2WI and FLAIR were significantly superior to T1WI-CHESS at detecting cortical tubers, and there was no significant difference between T2WI and FLAIR. In contrast, T1WI-CHESS was significantly superior to T2WI and FLAIR for the detection of RMLs, and FLAIR was significantly superior to T2WI. For the detection of SENs, FLAIR was significantly inferior to both T2WI and T1WI-CHESS, and there was no significant difference between T2WI and T1WI-CHESS.
Comparison of the detection of CNS lesions among T2WI, FLAIR, and T1WI-CHESS
Semiquantitative Analysis
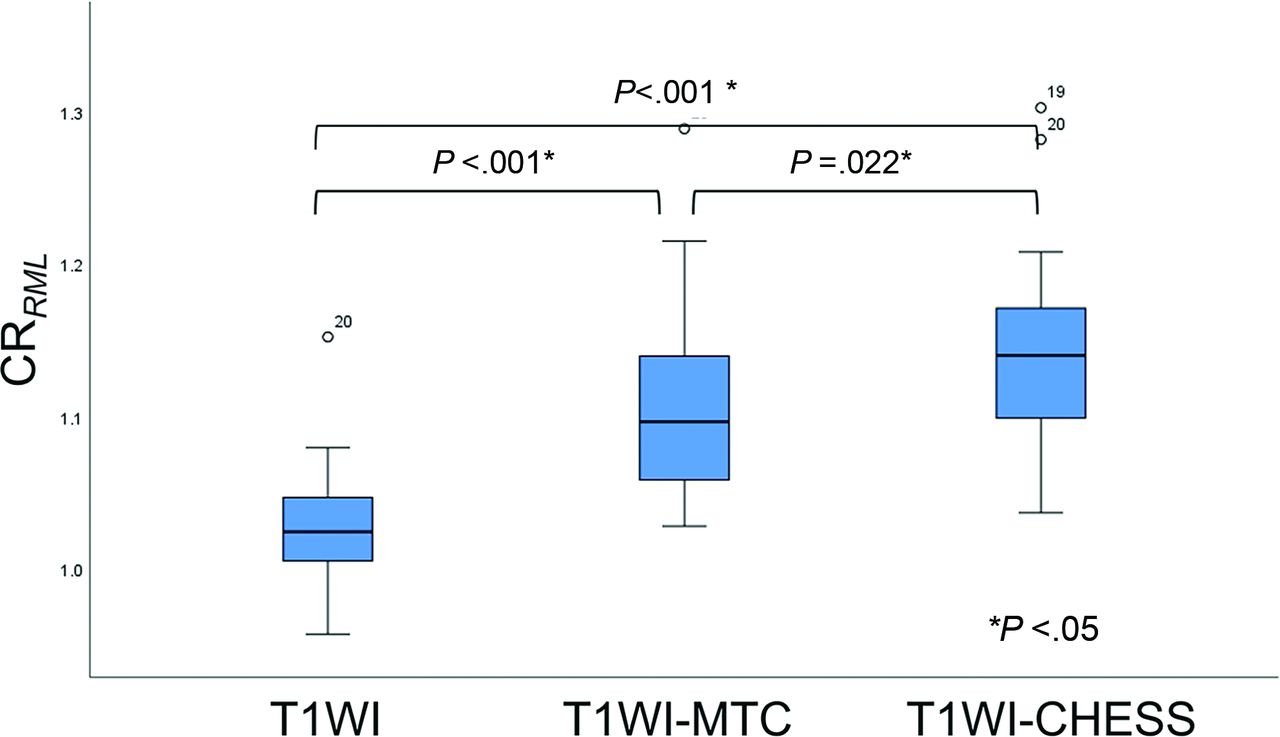
The interobserver reproducibility of T1WI-MTC for CRtuber and CRRML was almost perfect, and for the rest, it was substantial (Table 5). Regarding CRtuber, both T1WI-MTC and T1WI-CHESS were significantly superior to T1WI, but there was no significant difference between T1WI-MTC and T1WI-CHESS (Fig 4). Regarding CRRML, both T1WI-MTC and T1WI-CHESS were significantly superior to T1WI, and T1WI-CHESS was significantly superior to T1WI-MTC (Fig 5).

Comparison of the CRtuber among T1WI, T1WI-MTC, and T1WI-CHESS.

Comparison of the CRRML among T1WI, T1WI-MTC, and T1WI-CHESS.
Interobserver reproducibility of CRtuber and CRRML in each sequence
Correlations between the Number of CNS Lesions and the Clinical Information
There were no significant correlations between the patients’ seizure frequency and the number of cortical tubers, RMLs, or SENs in each sequence or between the patients' intellectual disability scores and the number of cortical tubers, RMLs, or SENs in each sequence.
Correlations between MR Imaging Findings and Pathologic Findings
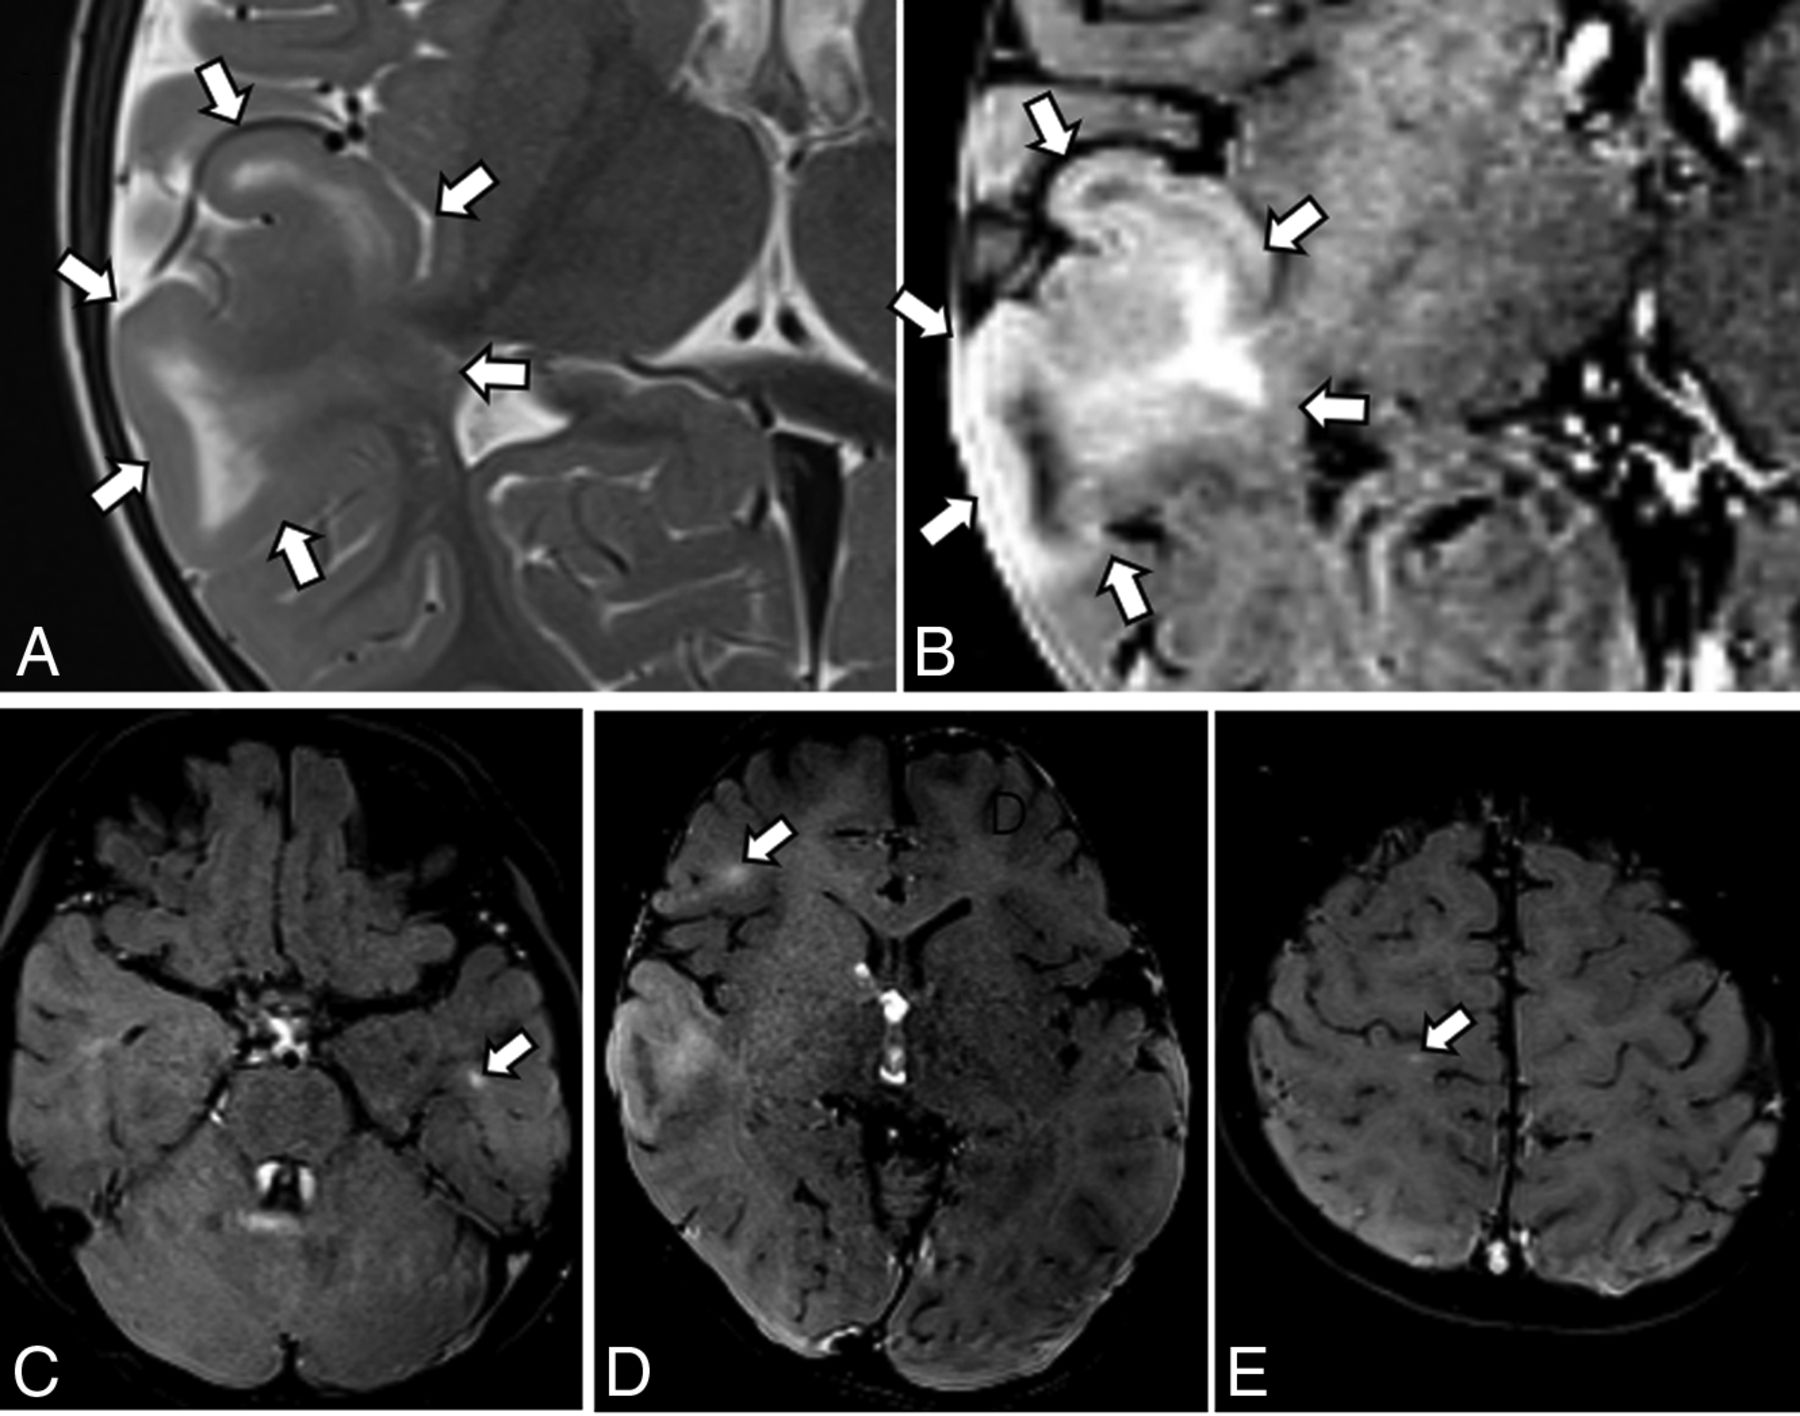
The surgical case was a 20-month-old boy with repeat epileptic seizures. On MR imaging, T2WI and FLAIR showed a swollen cortex and subcortical hyperintensity, indicating a cortical tuber (Fig 6A, -B). On T1WI-CHESS, these showed marked hyperintensity. Although T1WI, T2WI, and FLAIR could not detect other lesions, T1WI-CHESS could detect several RMLs, which led to the diagnosis of TSC (Fig 6C–E). The patient underwent resection of the cortical tuber. The resected specimen included a cortical tuber that demonstrated hyperintensity on T1WI-CHESS. Microscopically, there were many balloon cells in both the cortex and WM, without calcifications (Fig 7).

MR imaging findings of the surgical case, a 20-month-old boy with repeat epileptic seizures. A, Axial T2WI shows swelling of the cortex and subcortical hyperintensity (arrows), consistent with a cortical tuber. No other lesions are noted on T1WI, T2WI, and FLAIR (not shown); suggesting focal cortical dysplasia or a solitary cortical tuber. B, Axial T1WI-CHESS shows marked hyperintensity in the swollen cortex and subcortical white matter (arrows). C–E, Axial T1WI-CHESS shows several RMLs as linear hyperintense areas (arrows). On the basis of these findings, the patient was diagnosed with TSC.

Pathologic findings of the surgical case, a 20-month-old boy with repeat epileptic seizures. A, Many balloon cells are seen in the thickened cortex (arrowheads as examples). B, In subcortical WM, many balloon cells (arrowheads as examples) are seen in the left part of the white rectangle. Rare balloon cells (arrow) are present in the right part of the rectangle (star). C and D, Many balloon cells are observed in the subcortical white matter (arrowheads) and are immunoreactive for a monoclonal antibody against vimentin (1:400, M7020; Dako). A–C, Monoclonal antivimentin antibody. D, Hematoxylin-eosin staining. Scale bars: A and B, 500 μm. C, 100 μm. D, 10 μm.
DISCUSSION
The results of our analyses demonstrated the superiority of T1WI-CHESS in detecting RMLs compared with conventional sequences, including T2WI, FLAIR, T1WI, and T1WI-MTC. Our findings also indicated that balloon cells may contribute to the hyperintensity on T1WI-CHESS. To the best of our knowledge, this study is the first attempt to evaluate the detection of CNS lesions of TSC using T1WI-CHESS. Our findings suggest that the combination of T1WI-CHESS, T2WI, and FLAIR would be useful to evaluate the CNS lesions of patients with TSC in daily clinical practice.
TSC and FCD type IIb often share several histopathologic features, including disruption of the cortical cytoarchitecture, dysmorphic neurons, and balloon cells. Particularly, balloon cells are a common pathognomonic cellular feature of these disorders. Reflecting the pathologic similarity, TSC and FCD type IIb also share radiographic characteristics: cortical thickening, blurring of gray-white matter junctions, and WM abnormal intensity areas oriented from the cortical surface to the ventricular wall. These are usually shown as hyperintensity on T2WI and FLAIR images and hypointensity on T1WI, but they sometimes show hyperintensity on T1WI.
Kimura et al18 reported that T1 hyperintensity of the transmantle sign of FCD type IIb is associated with the high density of balloon cells, independent of the density of dysmorphic neurons, the severity of gliosis, and calcifications. In a study by Kusama et al,19 T1WI-CHESS detected the transmantle sign of FCD type IIb as marked hyperintensity where numerous balloon cells were located in a resected specimen. In the present study, some cortical tubers and RMLs showed hyperintensity on T1WI, and T1WI-CHESS detected many more cortical tubers and RMLs, with higher contrast. In the surgical case of our present series mentioned above, the resected specimen included a cortical tuber that showed hyperintensity on T1WI-CHESS. The pathologic findings showed many balloon cells without calcification. This result suggests that balloon cells may contribute to the hyperintensity on T1WI, as shown in FCD type IIb.
Magnetization transfer is a technique for improving the image contrast in MR imaging based on the difference in magnetic field–induced frequencies of free water protons and macromolecule-bound water protons.25 When an MTC pulse is applied, a radiofrequency pulse with frequency components distant from the resonant frequency of free water is excited, and the background signal intensity in the brain parenchyma decreases. In TSC, the alteration of tissue integrity leads to a disruption of the transfer of saturation effects between bound and free protons, causing a high signal on T1WI-MTC.11,13 Several reports have demonstrated the usefulness of T1WI-MTC for detecting CNS lesions of the TSC, and some lesions were only detected on the T1WI-MTC.11⇓-13
In the present study, we used T1WI-CHESS, which is the most common fat-suppression sequence in daily clinical practice. Like T1WI-MTC, T1WI-CHESS consists of a radiofrequency pulse and is reported to have the magnetization transfer effect.26 Using the magnetization transfer effect of CHESS, Kusama et al20 demonstrated that T1WI-CHESS images were significantly superior to T1WI-MTC images for neuromelanin imaging. The reason for that result was suspected to be that in addition to background suppression due to the magnetization transfer effect, the fat-suppression pulse decreased the background signal, which contains lipids in the myelin content of the brain. In the present study, T1WI-CHESS showed more RMLs with higher image contrast than T1WI-MTC, whereas they showed no significant differences in the detection of cortical tubers. We speculated that the difference in the amount of myelin in GM and WM and the difference in cell density between cortical tubers and RMLs affected this result. Although cortical tubers contain subcortical WM, a histopathologic study indicated that myelinated fibers are reduced in cortical tubers.27
While our present findings revealed the usefulness of T1WI-CHESS for detecting RMLs, cortical tubers were best detected by T2WI and FLAIR. As mentioned above, the density of myelinated fibers and the number of normal neurons are reduced in cortical tubers.27 A diffusion-weighted MR imaging study also showed that cortical tubers had a higher free water content due to an increase in extracellular space and a decrease in the density of cellular elements, leading to hyperintensity on T2WI/FLAIR.28 In addition, the effectiveness of signal suppression by magnetization transfer contrast is affected by cell density.12 We suspect that T2WI/FLAIR was able to detect more cortical tubers than T1WI-CHESS in the present study for these reasons. Therefore, the combination of T1WI-CHESS, T2WI, and FLAIR would be useful to evaluate the CNS lesions of patients with TSC. The patient who underwent an operation had been transferred to our hospital with suspicion of FCD or a solitary cortical tuber. The use of T1WI-CHESS at our hospital detected several RMLs and led to the diagnosis of TSC (Fig 6). This case suggested the possibility of our misdiagnosing TSC as an FCD type IIb or a solitary cortical tuber.
The relationship between the number of cortical tubers observed by MR imaging and the severity of cerebral dysfunction of patients with TSC has been reported.29,30 In addition to cortical tubers, several studies have focused on WM microstructural changes on DTI or neurite orientation dispersion and density imaging.22,31⇓-33 A study using DTI reported that RMLs were associated with abnormal DTI values (reflecting the disrupted myelination) and were strongly associated with neurocognitive morbidity.22 That study also used quantitative neurocognitive outcomes such as full-scale intelligence quotients or developmental quotients and the Social Communication Questionnaire. Our present analyses showed no significant correlations between the number of CNS lesions and clinical information; however, we assessed only seizure frequency and intellectual disability with 5-point scale qualitative evaluations. The use of more detailed clinical information with a quantitative evaluation may have helped clarify the correlation between the number of CNS lesions and clinical outcomes in the present study.
There are several limitations in this study. The number of patients was not large (n = 25); however, this number is larger than that in most of the previous series.10⇓-12,32,33 This number of patients was also sufficient to statistically determine the usefulness of T1WI-CHESS for detecting RMLs. A second limitation was a weakness of pathologic proof (n = 1). However, our present findings were consistent with the radiology-pathology correlation in FCD type IIb.18 Further radiology-pathology correlation studies are also needed for TSC. A third limitation is that the ages of the patients varied, including patients whose myelination is ongoing and those with completed myelination. Because there were 2 patients younger than 2 years of age whose myelination is ongoing and 1 of them had a SEN only, it was not possible to determine any difference in the detection ability of T1WI-CHESS between myelinated and unmyelinated brains. Future studies comparing the detectability of T1WI-CHESS between myelinated and unmyelinated brains are necessary.
CONCLUSIONS
We investigated the detection of cortical tubers, RMLs, and SENs by T1WI-CHESS. The results of our analysis demonstrated the usefulness of T1WI-CHESS for detecting RMLs, and they indicated that balloon cells may contribute to the hyperintensity on T1WI-CHESS, as shown in FCD type IIb. Our findings suggest that the combination of T1WI-CHESS, T2WI, and FLAIR would be useful to evaluate the CNS lesions of patients with TSC in daily clinical practice.
Footnotes
Disclosure forms provided by the authors are available with the full text and PDF of this article at www.ajnr.org.
This work was supported by The Tokumori Yasumoto Memorial Trust for Research on TSC and Related Rare Neurological Diseases (H.F.) and by an intramural fund of the National Center of Neurology and Psychiatry (3-8) and the Japan Agency for Medical Research and Development (JP21wm0425019) (M.T.).
Indicates open access to non-subscribers at www.ajnr.org
References
- Received March 2, 2022.
- Accepted after revision May 24, 2022.
- © 2022 by American Journal of Neuroradiology


Jump to section
Related Articles
Cited By...
- No citing articles found.