
Abstract
BACKGROUND AND PURPOSE: Vestibular schwannomas are benign, generally slow-growing tumors, commonly presenting with hearing loss. Alterations in the labyrinthine signal are seen in patients with vestibular schwannoma; however, the association between imaging abnormalities and hearing function remains poorly defined. The purpose of this study was to determine whether labyrinthine signal intensity is associated with hearing in patients with sporadic vestibular schwannoma.
MATERIALS AND METHODS: This was an institutional review board–approved retrospective review of patients from a prospectively maintained vestibular schwannoma registry imaged in 2003–2017. Signal-intensity ratios of the ipsilateral labyrinth were obtained using T1, T2-FLAIR, and postgadolinium T1 sequences. Signal-intensity ratios were compared with tumor volume and audiometric hearing threshold data including pure tone average, word recognition score, and American Academy of Otolaryngology–Head and Neck Surgery hearing class.
RESULTS: One hundred ninety-five patients were analyzed. Ipsilateral labyrinthine signal intensity including postgadolinium T1 images was positively correlated with tumor volume (correlation coefficient = 0.17, P = .02). Among signal-intensity ratios, postgadolinium T1 was significantly positively associated with pure tone average (correlation coefficient = 0.28, P < .001) and negatively associated with the word recognition score (correlation coefficient = −0.21, P = .003). Overall, this result correlated with impaired American Academy of Otolaryngology–Head and Neck Surgery hearing class (P = .04). Multivariable analysis suggested persistent associations independent of tumor volume with pure tone average (correlation coefficient = 0.25, P < .001) and the word recognition score (correlation coefficient = −0.17, P = .02) but not hearing class (P = .14). No consistent significant associations were noted between noncontrast T1 and T2-FLAIR signal intensities and audiometric testing.
CONCLUSIONS: Increased ipsilateral labyrinthine postgadolinium signal intensity is associated with hearing loss in patients with vestibular schwannoma.
ABBREVIATIONS:
- CC
- correlation coefficient
- IQR
- interquartile range
- PTA
- pure tone average
- SIR
- signal-intensity ratio
- VS
- vestibular schwannoma
- WRS
- word recognition score
- AAO-HNS
- American Academy of Otolaryngology–Head and Neck Surgery
Sporadic vestibular schwannomas (VSs) are the third most common primary adult brain neoplasm and arise from the vestibular portions of cranial nerve VIII, potentially causing asymmetric sensorineural hearing loss, tinnitus, dizziness, and, less commonly, trigeminal symptoms or hydrocephalus.1 Previously only severe symptomatic cases were detected, but increased use of MR imaging has led to improved diagnosis of VS. During the past half-century, the diagnosis of VS has increased approximately 14-fold, with the incidence in the United States currently reported to be 4.2 cases per 100,000 person-years.1,2 Overall, as detection has improved, there has been a shift in practice so that most patients with small tumors are conservatively observed for tumor growth before intervention. Because tumor control and facial nerve outcomes are generally good for small tumors regardless of treatment technique, hearing loss and quality of life considerations have come to the forefront in this population.
The mechanisms underlying VS-associated sensorineural hearing loss remain largely unknown. Research has explored direct mass effect and compression of the cochlear nerve, vascular compromise mainly of the terminal labyrinthine branch of anterior inferior cerebellar artery, alterations in BBB permeability, CSF circulation, and local inflammation causing compositional changes within the endolymphatic/perilymphatic space.3⇓-5 Furthermore, the associations between plausible pathologic explanations and imaging phenotypes with hearing loss in VS remain unknown.
For understanding these pathologies and their relationship with hearing, several advances have been made in MR imaging. Delayed contrast has been used as a marker for increased BBB permeability. While early work using 1.5T MR imaging found no significant signal increases within the cochlea with delayed contrast among healthy controls,6 subsequent work demonstrated normal enhancement detectable using 3D-FLAIR and delayed techniques.7 In patients with VS, contrast enhancement has been seen in the ipsilateral affected cochlea,8 with additional work demonstrating increased signal intensity and associations with reduced hearing.8,9
Identifying the radiologic manifestations of hearing loss is important toward guiding management and developing novel strategies to mitigate hearing loss. With increasing radiologic sensitivity, methods in predicting early pathoetiological markers or clinically relevant hearing-associated imaging characteristics remain understudied. Given this paucity of knowledge, we sought to determine whether labyrinthine signal intensity is associated with VS-related hearing loss.
MATERIALS AND METHODS
Study Participation, Imaging, and Audiometry
An institutional review board–approved (protocol 15–008224) retrospective cross-sectional review was completed of patients from a prospectively maintained VS registry, imaged between 2003 and 2017, as previously described in an investigation of tumor volume and hearing outcomes in VS (n = 213).10,11 Informed consent was waived, given minimal risk. Patient selection is outlined as follows and in Fig 1.

Patient selection flow chart.
The first available dedicated inner ear MR imaging with paired audiometric data was used. All available imaging including outside imaging was included for possible analysis. T1, T2-FLAIR, and postgadolinium T1 sequences were used as available. Patients with unavailable audiometry, MR imaging with slices of >3 mm, ≥2 nonavailable/nonacquired sequences, or a history of intervention such as gamma knife radiosurgery preceding appropriate imaging or audiometric testing were excluded.
ROIs, including the vestibule and cochlea, were manually drawn to obtain mean signal intensities of the labyrinthine structures by J.P.W., similar to ROIs in a prior study.9 Labyrinthine ROI signal-intensity ratios (SIRs) were normalized to the contralateral labyrinthine structures using the equation mean ipsilateral/contralateral intensity to account for sequence and technique variability (Fig 2A). Additional comparisons using maximal intensities and normalization to the pons were explored but not ultimately used given above noted variability.
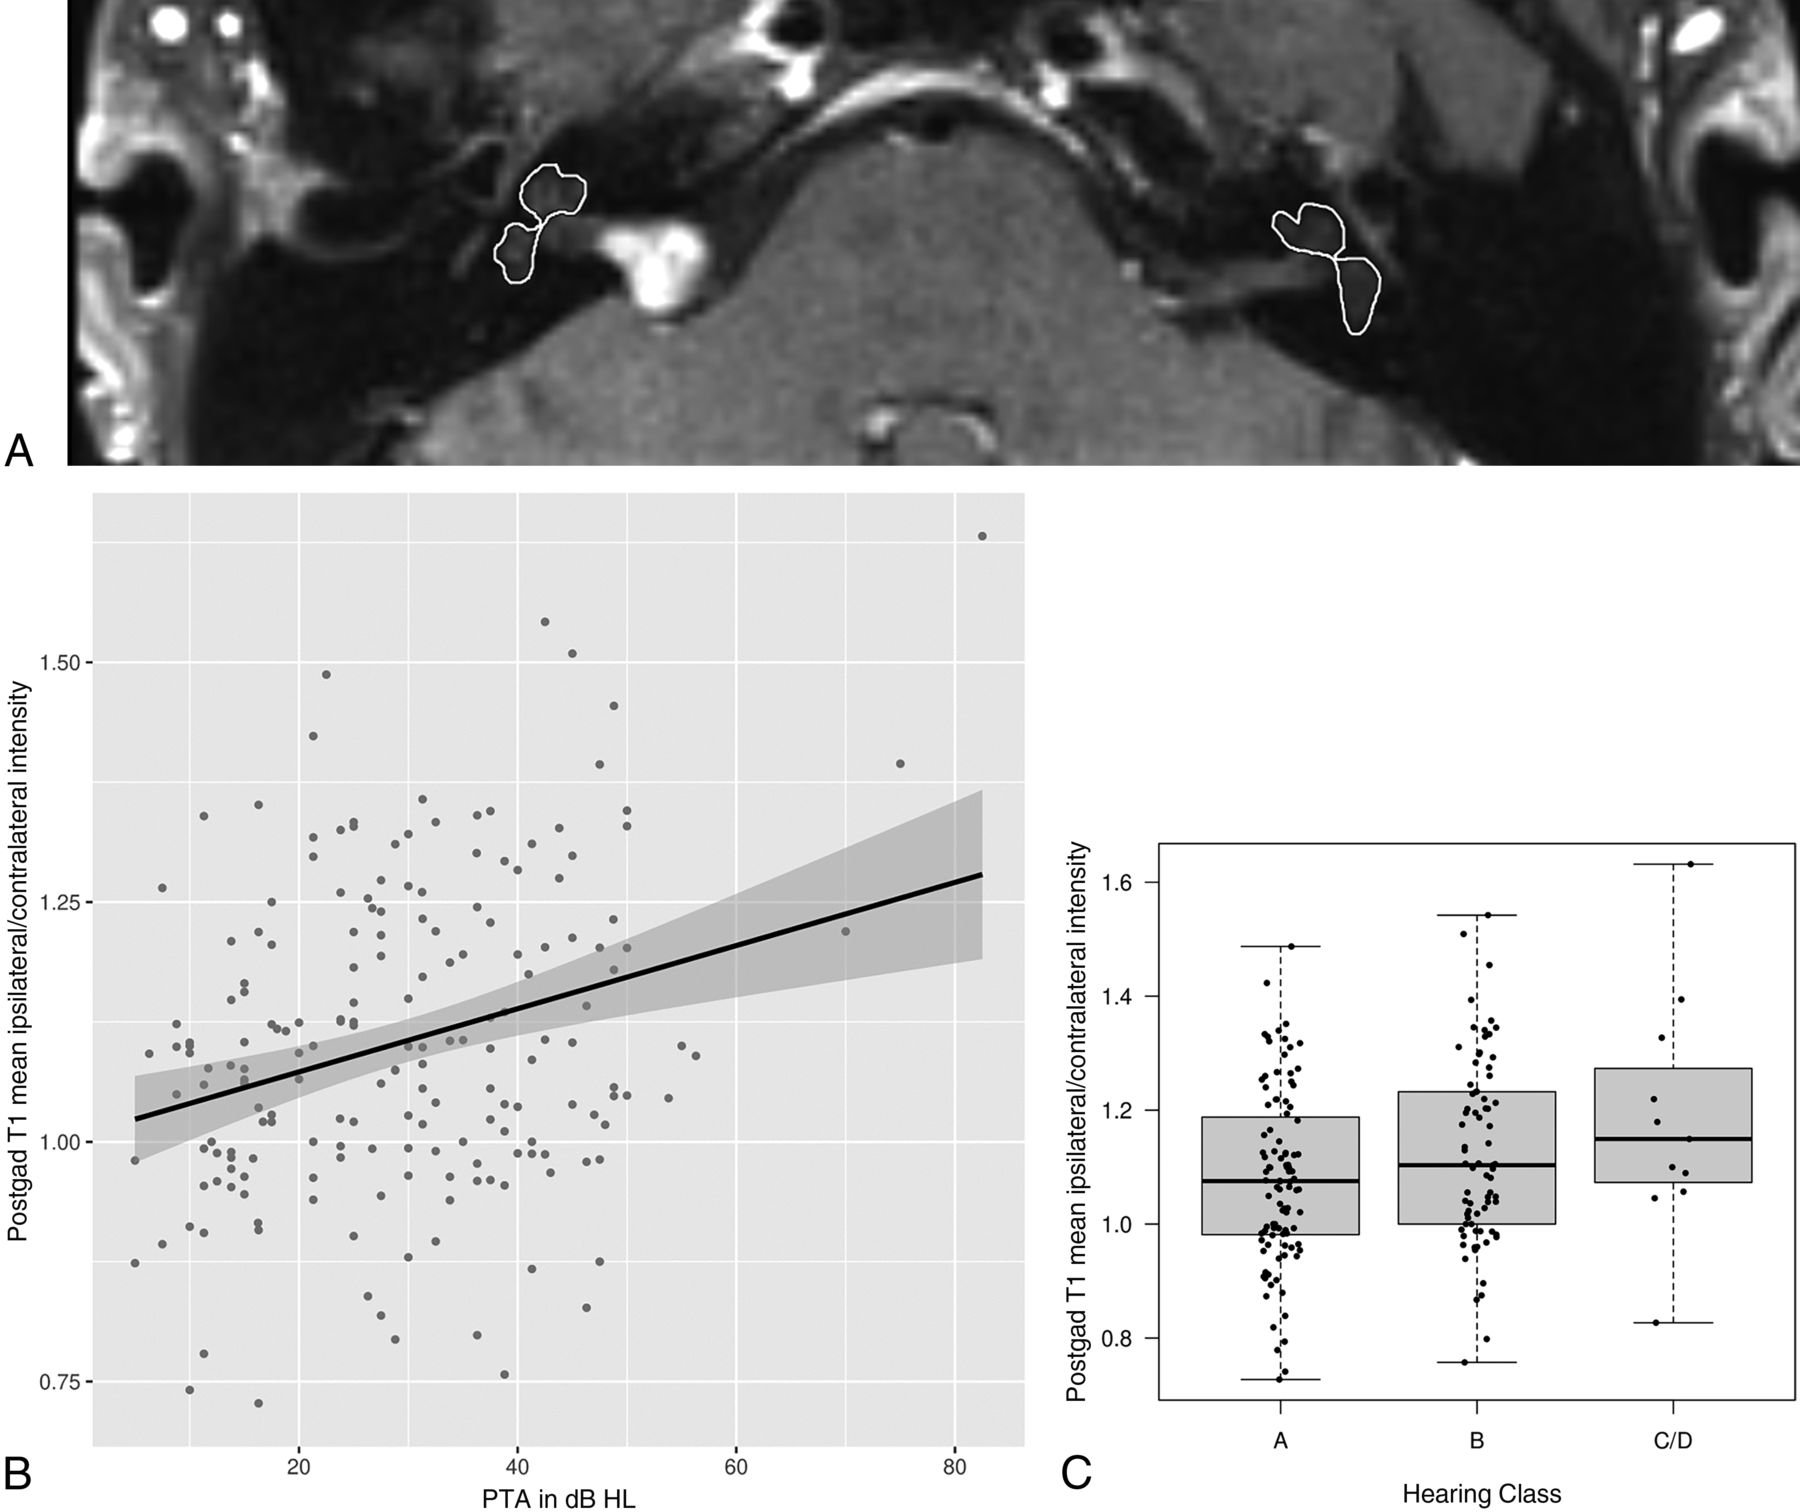
Postgadolinium T1 signal intensity and hearing impairment. A, Representative axial postgadolinium T1 MR imaging and ROIs used for analysis. Increased PTA (B) and worse AAO-HNS hearing classification grades (C) are associated with increased relative signal intensity. HL indicates hearing loss; postgad, postgadolinium.
SIRs were then paired with the nearest audiometric hearing threshold data including pure tone average (PTA), word recognition score (WRS), and American Academy of Otolaryngology–Head and Neck Surgery (AAO-HNS) hearing class for analysis by C.M.L., as previously described.12 Briefly, PTA was defined as the average dB threshold heard across 0.5-, 1-, 2-, and 3-kHz frequencies with substitutions at 2 and 4 kHz when appropriate.13 WRS represents the percentage of correctly repeated monosyllabic words at a fixed volume threshold. Less-than-perfect speech comprehension is defined as WRS <90%. AAO-HNS hearing class combines PTA and WRS into 4 classes, A, B, C, or D, of increasing hearing deficits.12 Broadly, class A represents normal/good hearing; B, mild impairment/serviceable; and C/D, severe impairment/nonserviceable with near to nonmeasurable hearing. Comparisons were made with available VS volumetric analysis as previously described in a prior investigation of tumor volume and hearing (n = 193).10
Statistical Methods
Statistical analyses were performed by C.M.L. Continuous features were summarized with means and SDs if approximately normally distributed and with medians and interquartile ranges (IQRs, 25th percentile to 75th percentile) otherwise; categoric features were summarized with frequencies and percentages. Univariable associations of interest were evaluated using the Pearson and Spearman rank correlation coefficients (CCs) and 2-sample t and Wilcoxon rank-sum tests. Associations of select SIRs with audiometric features after multivariable adjustment for tumor volume were explored using partial Pearson and Spearman rank correlation coefficients and adjusted means from linear regression models. For the linear regression models, tumor volume was transformed to the natural log scale to satisfy the underlying assumption of normality. Statistical analyses were performed using SAS, Version 9.4 (SAS Institute) and R statistical and computing software, Version 4.0.3 (http://www.r-project.org/). All tests were 2-sided, and P values < .05 were considered statistically significant.
RESULTS
A total of 195 patients with sporadic VS and SIRs from MRIs obtained between 2003 and 2017 comprised the study cohort following exclusion of 18 patients (Fig 1). Dedicated inner ear MR imaging was performed at a median of 154 days (IQR, 0–241 days) from the original diagnostic MR imaging. Of the subjects, 77 patients had an audiogram available from the same date as the MR imaging, 63 had an audiogram from a median of 13 days (IQR, 4–66 days) before the MR imaging, and 55 had an audiogram from a median of 18 days (IQR, 1–98 days) after the MR imaging, representing an assessment of ipsilateral hearing paired with the MR imaging under study. Demographics, audiometric features, and MR imaging features are summarized in Table 1. Sample sizes for features with missing data are indicated in parentheses in Table 1. Note that the 213 patients initially eligible for study had serviceable hearing (ie, AAO-HNS hearing class A/B) on the diagnostic MRI.10 However, not all diagnostic MRIs were available for SIR assessment; thus, some patients had progressed to nonserviceable hearing at the time of the paired audiogram. Overall, the patient population demonstrated normal-to-mildly-impaired hearing, with 94% of patients demonstrating serviceable hearing: 54% of patients (n = 100) having class A and 40% (n = 75) having class B. Two notable observed MR imaging features include increased FLAIR mean ipsilateral/contralateral intensity (mean, 1.424 [SD, 0.389]) in addition to postgadolinium T1 mean ipsilateral/contralateral labyrinth intensity (mean, 1.102 [SD, 0.160]).
Summary of study cohort (n = 195)
SIRs demonstrated statistically significant positive correlations with tumor volume, as shown in Table 2. Of note, mean SIRs were significantly associated with tumor volume on both pre- and postgadolinium T1-weighted sequences in addition to FLAIR.
Associations of SIRs with tumor volume (n = 193)
Associations of SIRs, in addition to tumor volume, with ipsilateral hearing, including PTA, WRS, and hearing class, are summarized in Tables 3 and 4. Postgadolinium T1 mean SIR normalized to the contralateral side was significantly positively correlated with PTA (CC = 0.28; P < .001; Table 3 and Fig 2B) and significantly negatively correlated with WRS (CC = −0.21; P = .003; Table 3), indicating that larger SIRs were associated with worse hearing and speech comprehension. When we combined both PTA and WRS, hearing class worsened with increasing postgadolinium T1 mean SIRs normalized to the contralateral side, with mean SIRs of 1.080, 1.125, and 1.184 for patients with hearing class A, B, and C/D, respectively (P = .04; Table 4 and Fig 2C).
Associations of MR imaging features with PTA (n = 188) and WRS (n = 193)
Associations of MR imaging features with hearing class (n = 186)
Associations of postgadolinium T1 mean SIRs normalized to the contralateral side with audiometric features after multivariable adjustment for tumor volume were also explored. Although associations of these select SIRs with audiometric features were attenuated after multivariable adjustment, some remained statistically significant. Specifically, the partial Pearson correlation coefficient for the association of postgadolinium T1 mean ipsilateral/contralateral intensity with PTA after adjusting for tumor volume was 0.25 (P < .001). The partial Spearman rank correlation coefficient for associations with WRS was −0.17 (P = .02). Mean levels of postgadolinium T1 mean ipsilateral/contralateral intensity for patients with 100% and <100% WRS after adjusting for tumor volume were 1.068 and 1.127, respectively (P = .01). Mean levels of postgadolinium T1 mean ipsilateral/contralateral intensity for patients with hearing class A, B, and C/D after adjusting for tumor volume were 1.083, 1.121, and 1.166, respectively (P = .14).
DISCUSSION
In the present study, we found that signal intensity of the VS-affected labyrinthine structures is associated with the degree of hearing impairment. Specifically, we found that normalized SIRs of the ipsilateral cochlea and vestibule to the contralateral ear on T1-weighted postgadolinium MR imaging are associated with increased PTA, decreased WRS, and an overall impaired AAO-HNS hearing class at near-baseline imaging and hearing time points.
Contrast-enhanced MR imaging of the inner ear has become standard protocol for internal auditory canal assessment in VS. More recently, delayed contrast techniques have been increasingly suggested as an indirect method to assess contrast deposition in endolymph/perilymph and, thus, BBB permeability changes. Here, we found that there is a significant association between increased contrast-enhanced signal intensity and hearing loss with nondelayed techniques. Notably, a prior study did not observe this finding, possibly secondary to limitations with a reduced sample of patients and available audiometry.8 The present study found these effects at early time points and less severe hearing deficits including minimally decreased PTA and largely class A hearing relative to prior studies.8,9 Future longitudinal study is needed to determine whether these findings are stably associated with hearing trajectory or if there is any inherent variability with VS progression. Work determining whether the findings summarized herein can be extrapolated to individual prognosis will be key. Currently, we do not suggest that quantitative or qualitative inclusion of these findings is ready for standard implementation in clinical-radiologic practice. Such studies exploring the temporal progression of often qualitatively subtle findings will be important in expanding the methodology by which patients are selected for VS treatment and counseled regarding prospects of retaining useful hearing.
Recent studies have focused on using FLAIR imaging, and more recently 3D-FLAIR, as a method to identify presumed inflammatory proteins within the labyrinth associated with VS. While these data fit with current data suggesting increased non-contrast-enhanced FLAIR intensity in the affected labyrinthine ear, we did not find a significant association between observed increased FLAIR signal intensities and hearing outcomes. There are several possible reasons for this result. There were a relatively limited number of appropriate FLAIR sequences available for analysis secondary to using the earliest imaging available for each patient. Given the timeframe of the study, there were even fewer 3D-FLAIR studies that have been posited to decrease confounding CSF flow artifacts.14 Most important, while other work has investigated the use of noncontrast FLAIR, finding increased signal within the ipsilateral VS-affected cochlea,15,16 associations between noncontrast labyrinthine FLAIR signal and hearing outcomes have been mixed.8,17,18 Findings of separate analyses investigating T2 sequences and hearing outcomes have been similarly varied.19⇓-21 More recently, hearing loss associated with increased labyrinthine signal has been observed with contrast-enhanced 3D-FLAIR studies.8,9 Unfortunately, the early time points and limited availability of contrast-enhanced 3D-FLAIR imaging precluded inclusion in the present study. Future work exploring the technical advantages of contrast-enhanced 3D-FLAIR may improve the sensitivity to signal alterations within the labyrinth.
Prior studies have demonstrated variable associations between increased VS size and poor baseline hearing.10,22 Moreover, hearing loss usually ensues even without detectable tumor growth.23 The current study found that increased tumor size, using volumetric 3D segmentation, is associated with increased SIR. Furthermore, by means of multivariable analysis to adjust for tumor volume, associations of increased SIRs with T1-weighted contrast-enhanced imaging and increased PTA or decreased WRS remained. Thus, these findings suggest that the mechanism driving hearing loss in VS may be independent of tumor size. Most important, however, the degree or independence of variables including tumor volume, signal intensity, and hearing outcomes are unknown. Overall, it is likely that the process of VS-related hearing loss is multifaceted, including vascular compromise, mass effect, BBB permeability, and local inflammation predisposing to hearing loss. Further work assessing these with multifactorial methods will be of increasing importance for directing focused therapies to mitigate hearing loss.
This study has limitations. In a tertiary care center, the present cohort is subject to an increased chance of referral bias.24 Imaging studies spanned 14 years and included other institutions and thus varied techniques, protocols including contrast timing and sequence acquisition, scanners, and magnet strengths. MR imaging appropriate for assessment was frequently performed following presumptive VS diagnosis; baseline audiometric data are, thus, paired with the closest congruent MR imaging. Although the current study examined ipsilateral VS-associated hearing loss with signal-intensity normalization to the contralateral ear, no audiometric comparisons with the contralateral ear were made. Comparisons between T1 and T1 postgadolinium imaging could not be assessed secondary to technique variability. Combined contributions of intrinsic T1 measured with T1 postgadolinium signal intensities and associations with hearing cannot be excluded and, in fact, are likely, given prior research identifying proteinaceous accumulation and VS-associated hearing impairment.4,5 Prospective study isolating contributors longitudinally would be useful. As described above, no contrast-enhanced 3D-FLAIR studies were included for analysis.
CONCLUSIONS
Contrast-enhanced T1 signal intensities of VS-affected labyrinthine structures are associated with hearing loss. Determining the radiologic manifestations of sensorineural hearing loss will be helpful for patient counseling, guiding therapeutic management, and development of novel strategies to mitigate or attenuate progression of sensorineural hearing loss.
Footnotes
Disclosure forms provided by the authors are available with the full text and PDF of this article at www.ajnr.org.
References
- Received November 30, 2022.
- Accepted after revision January 31, 2023.
- © 2023 by American Journal of Neuroradiology


