
Abstract
BACKGROUND AND PURPOSE: Arterial stiffness is reported to be able to cause axonal demyelination or degeneration. The present study aimed to use advanced MR imaging techniques to examine the effect of arterial stiffness on the WM microstructure among older adults.
MATERIALS AND METHODS: Arterial stiffness was measured using the cardio-ankle vascular elasticity index (CAVI). The high-CAVI (mean CAVI ≥ 9 points) and the low-CAVI groups (mean CAVI < 9 points) were created. The neuronal fiber integrity of the WM was evaluated by neurite orientation dispersion and density imaging and magnetization transfer saturation imaging. Tract-Based Spatial Statistics and the tracts-of-interest analysis were performed. Specific WM regions (corpus callosum, internal capsule, anterior thalamic radiation, corona radiata, superior longitudinal fasciculus, forceps minor, and inferior fronto-occipital fasciculus) were selected in the tracts-of-interest analysis.
RESULTS: In Tract-Based Spatial Statistics, the high-CAVI group showed a significantly lower myelin volume fraction value in the broad WM and significantly higher radial diffusivity and isotropic volume fraction values in the corpus callosum, forceps minor, inferior fronto-occipital fasciculus, internal capsule, corona radiata, and anterior thalamic radiation than the low-CAVI group. In tracts-of-interest analysis using multivariate linear regression, significant associations were found between the mean CAVI and radial diffusivity in the anterior thalamic radiation and the corona radiata; isotropic volume fraction in the anterior thalamic radiation and the corona radiata; and myelin volume fraction in the superior longitudinal fasciculus (P < .05). Additionally, partial correlation coefficients were observed for the significant associations of executive function with radial diffusivity and myelin volume fraction (P < .05).
CONCLUSIONS: Arterial stiffness could be associated with demyelination rather than axonal degeneration.
ABBREVIATIONS:
- ATR
- anterior thalamic radiation
- CAVI
- cardio-ankle vascular elasticity index
- CC
- corpus callosum
- CR
- corona radiata
- FA
- fractional anisotropy
- FMi
- forceps minor
- IC
- internal capsule
- IFOF
- inferior fronto-occipital fasciculus
- ISOVF
- isotropic volume fraction
- NODDI
- neurite orientation dispersion and density imaging
- MT
- magnetization transfer
- MVF
- myelin volume fraction
- RD
- radial diffusivity
- SLF
- superior longitudinal fasciculus
- TBSS
- Tract-Based Spatial Statistics
- TMT
- Trail-Making Test
- TOI
- tracts of interest
Arterial stiffness can be measured by several different methods. The pulse wave velocity has been measured by various methods as an indirect index of arterial elasticity, but it is blood pressure–dependent.1 Conversely, the cardio-ankle vascular elasticity index (CAVI) directly reflects vascular elasticity and is blood pressure–independent.2 Reports regarding the association between CAVI-measured arterial stiffness and WM microstructure have still not been published, though some studies reported the association between pulse wave velocity–measured arterial stiffness and brain WM integrity.
Neurite orientation dispersion and density imaging (NODDI) is a new, advanced DWI technique that improves WM characterization using a multicompartment model to describe different WM functions. By enabling the estimation of neurite structure, NODDI can provide more specific insight into the underlying WM microstructural changes.3 Thus, NODDI could be useful in assessing arterial stiffness–associated WM microstructure, though no study has tested this hypothesis. Moreover, myelin-sensitive imaging using MR imaging can evaluate the WM microstructure from a different viewpoint from DWI.
Arterial stiffness is indicated to cause axonal demyelination or degeneration.4,5 Notably, Badji et al6 showed that carotid-femoral pulse wave velocity is significantly associated with both fractional anisotropy (FA) and radial diffusivity (RD) but not with the myelin volume fraction (MVF). The results suggested that arterial stiffness is associated with axonal degeneration rather than with demyelination. However, reports supporting such results are still limited. We hypothesized that the impact of arterial stiffness on the brain WM microstructure could be better understood by using the above-mentioned multimodal WM-sensitive MR imaging techniques. Hence, this study aimed to explore the associations between CAVI-measured arterial stiffness and WM-sensitive MR imaging measures of the brain in older adults.
MATERIALS AND METHODS
The institutional review board of Juntendo University Hospital in Japan approved this study in compliance with the World Medical Association’s Code of Ethics (Declaration of Helsinki) for experiments involving humans.
Study Participants
The Bunkyo Health Study is a prospective cohort study of 1629 older individuals.7 Of these, 160 participants underwent both FLAIR imaging and DWI. Exclusion criteria included major psychiatric or neurologic disorders, heart failure, stroke, and/or a history of alcohol or drug abuse. Ultimately, 110 older participants were included for the analysis. Arteriosclerosis was estimated by CAVI determined by using an automatic waveform analyzer (Vascular Screening System VaSera VS1500; Fukuda Denshi).8 High CAVI (≥9.0) implies progression of carotid and coronary arteriosclerosis;9 thus, CAVI 9 was set as the cutoff value. The eligible participants were divided into the high-CAVI group (those with a mean [average of left and right values] CAVI of ≥ 9 points; 37 men and 23 women; mean age, 72.72 [SD, 5.00] years) and the low-CAVI group (those with a mean CAVI of < 9 points; 29 men and 21 women; mean age, 72.58 [SD, 4.82] years). Table 1 shows the demographic characteristics. Deep and subcortical WM hyperintensity and periventricular hyperintensity were evaluated using the Fazekas scale,10 according to axial FLAIR imaging.
Demographic characteristics of the participantsa
Image Acquisition
MR imaging data were acquired using a 3T MR imaging scanner (Magnetom Prisma; Siemens) with a 64-channel head coil. We acquired multishell DWI data using a spin-echo echo-planar imaging sequence, which included 2 b-values of 1000 and 2000 s/mm2 along 64 isotropic diffusion gradients uniformly distributed on a sphere, with a simultaneous multisection echo-planar imaging sequence in the anterior-posterior phase-encoding direction with the following parameters: TR = 3300 ms; TE = 70 ms; FOV = 229 × 229 mm; matrix size = 130 × 130; section thickness = 1.8 mm; resolution = 1.8 × 1.8 mm; acquisition time = 7 minutes and 29 seconds. DWI acquisition was completed with a b = 0 image. Standard and antiphase-encoded blipping images were acquired without diffusion weighting to compensate for the distortion caused by the magnetic susceptibility associated with the echo-planar imaging acquisition. The predominant T1-weighted, proton density–weighted, and magnetization transfer (MT)–weighted images were obtained using a 3D multiecho high-speed low-angle shot sequence for calculating the MT saturation index.11 The settings for the MT saturation sequences were as follows: for MToff and MTon scanning, TE = 2.53 ms, TR = 24 ms, flip angle = 5°; for T1WI, TE = 2.53 ms, TR = 10 ms, flip angle = 13°, with parallel imaging using generalized autocalibrating partially parallel acquisition with a factor of 2 in the phase-encoding direction, 7/8 partial Fourier acquisition in the partition direction, bandwidth = 260 Hz/pixel, matrix = 128 × 128, acquisition time = 6 minutes 25 seconds, section thickness = 1.8 mm, FOV = 224 × 224 mm.
Diffusion MR Imaging Processing
For eliminating artifacts, the eddy (https://fsl.fmrib.ox.ac.uk/fsl/fslwiki/eddy/UsersGuide) and topup (https://fsl.fmrib.ox.ac.uk/fsl/fslwiki/topup) toolboxes, which are part of the FSL (www.fmrib.ox.ac.uk/fsl), were used.12 The resulting images were fitted to the NODDI model3 using the NODDI Matlab Toolbox 5 (http://www.nitrc.org/projects/noddi_toolbox). Table 2 summarizes the parameters of DTI and NODDI. The maps of the orientation dispersion index, isotropic volume fraction (ISOVF), and intracellular volume fraction were generated using the Accelerated Microstructure Imaging via Convex Optimization.13 Furthermore, the DTIFit tool (https://open.win.ox.ac.uk/pages/fsl/fslpy/fsl.data.dtifit.html) was used to generate tensor-derived maps according to the ordinary least-squares method14 using DWI data with b-values of 0 and 1000 s/mm2.
Summary of WM metrics
Myelin-Sensitive Imaging Processing
MT saturation (MTsat) data were analyzed using a Matlab script (https://www.mathworks.com/help/matlab/ref/run.html).15 First, the apparent longitudinal relaxation rate (R1app) was calculated as the following equation:
Here, ST1 and SPD indicate the signal strength of T1- and proton-density (PD)-weighted imaging, respectively. TRT1 and TRPD reflect the TRs of T1- and PD-weighted imaging, respectively. αT1 and αPD show the excitation flip angles of T1- and PD-weighted imaging. Second, the apparent signal amplitude (Aapp) was calculated as the following:

Third, the apparent δapp was calculated as the following equation:

TRMT, SMT, and αMT show the TR, signal intensity, and excitation flip angle of the MT-weighted imaging respectively. The following formula was applied to fix the small residual high-order dependency of MTsat on the local radiofrequency (RF) transmit field:16
RFlocal was calculated using the dual-angle method.17 In addition, we added 2 B1 maps with flip angles of 10° and 20°, respectively, obtained by echo-planar imaging in about 10 seconds. The first and second images were obtained after excitation with flip angles α and 2α proportional to sinα and sin 2α, respectively. The ratio of the 2 acquisitions was calculated using the following formula:
From there, the local flip angle α was calculated.
Tract-Based Spatial Statistics Analysis
Voxelwise statistical analysis was performed using Tract-Based Spatial Statistics (TBSS; http://fsl.fmrib.ox.ac.uk/fsl/fslwiki/TBSS) implemented in FSL.18 The TBSS procedure was as follows: First, using FMRIB’s Nonlinear Registration Tool (FNIRT; http://fsl.fmrib.ox.ac.uk/fsl/fslwiki/FNIRT), we aligned the FA maps of all participants into the Montreal Neurological Institute 152 standard space with 1 × 1 × 1 mm³ voxel size. Second, we created and thinned a population-based mean FA image to establish the mean FA skeleton, which shows the centers of all tracts common to the group. The threshold of the mean FA skeleton was 0.2 to exclude the peripheral tracts and GM. Third, a binary mask of the FA skeletonized image was used as the mask image to make a voxel-by-voxel statistical comparison between the high- and low-CAVI groups of the 4D skeleton image file. This comparison was performed using FSL’s Randomise tool (http://fsl.fmrib.ox.ac.uk/fsl/fslwiki/Randomise/UserGuide), and the number of permutations was set to 10,000. The data for other WM metrics was analyzed using the tbss_non_FA script (https://fsl.fmrib.ox.ac.uk/fsl/fslwiki/TBSS/UserGuide#Using_non-FA_Images_in_TBSS) to generate a 4D skeleton image file for each metric.
Tract-of-Interest Analysis
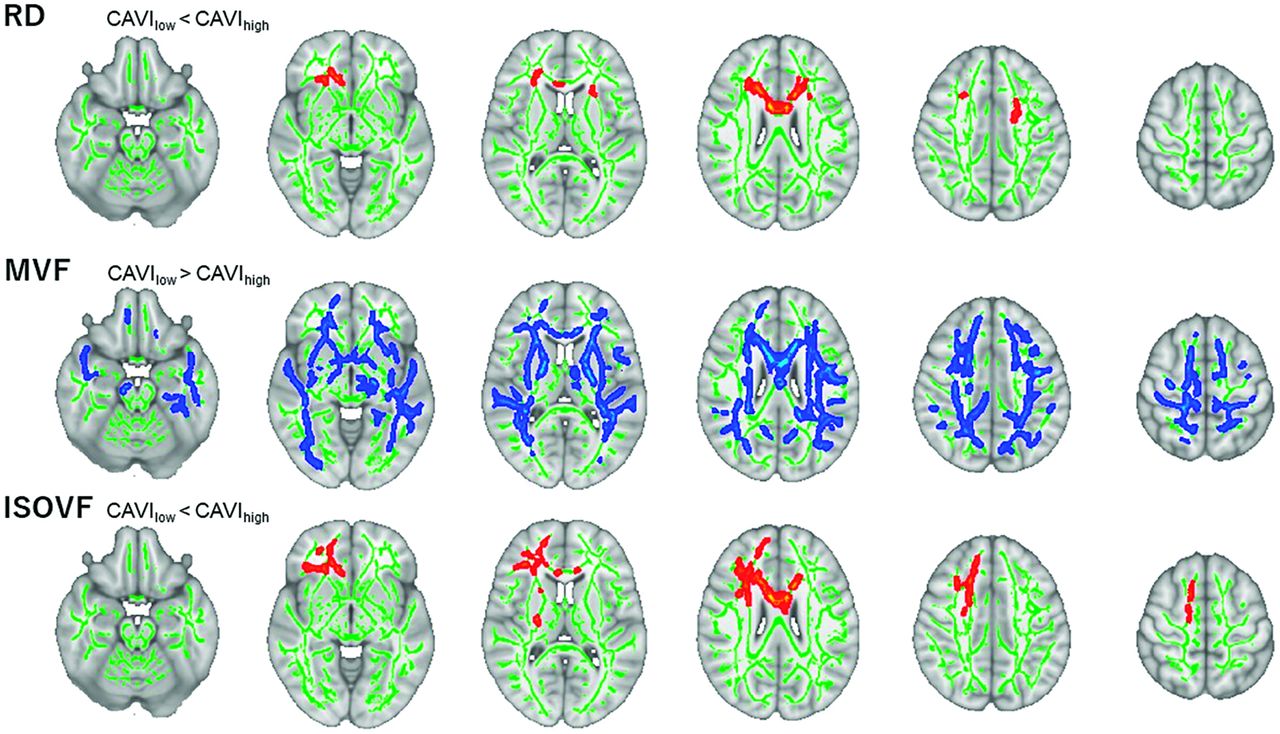
Tracts of interest (TOI) were analyzed using the ICBM DTI-81 Atlas (http://www.bmap.ucla.edu/portfolio/atlases/ICBM_DTI-81_Atlas/).19 According to the TBSS results (Figure) and previous studies showing arterial stiffness–associated WM regions, 6 major WM tracts, namely, the corpus callosum (CC), internal capsule (IC), corona radiata (CR), inferior fronto-occipital fasciculus (IFOF), forceps minor (FMi), and anterior thalamic radiation (ATR), were identified as TOI of RD and ISOVF. Additionally, 7 major WM tracts, namely, the CC, IC, CR, IFOF, FMi, ATR, and superior longitudinal fasciculus (SLF), were selected as TOI of the MVF. These WM regions are reportedly vulnerable to increased arterial stiffness.4,5,20,21 Then, the mean value (the average of left and right values) within each ROI was computed for each WM metric.

Comparison between the high- and low-CAVI groups. For TBSS, the low- and high-CAVI groups were compared (family-wise error–corrected P < .05, adjusting for age, sex, antihypertensive therapy use, intracranial volume, and systolic blood pressure). Red–yellow voxels demonstrate significantly higher RD and ISOVF values in the high-CAVI group than in the low-CAVI group. Blue–light blue voxels illustrate a significantly lower MVF value in the high-CAVI group than in the low-CAVI group.
Statistical Analysis
All statistical data were analyzed using SPSS Statistics, Version 27 (IBM). Demographic and clinical data were analyzed using the χ2 or Mann-Whitney U test. A P value (2-tailed) < .05 was considered statistically significant.
For TBSS, the high- and low-CAVI groups were compared using the Randomize tool (family-wise error–corrected P < .05, adjusting for age, sex, antihypertensive therapy use, systolic blood pressure, and intracranial volume).
In all participants, we applied univariate linear regression analyses for each WM metric as a dependent variable and the mean CAVI as an independent variable. Subsequently, multivariate linear regression analyses were conducted using backward linear regression to identify independent factors associated with the mean CAVI. The variable P < .2 in the univariate model was included in the back-removal procedure with P-removal = .1. Age, sex, antihypertensive therapy, systolic blood pressure, and intracranial volume were considered confounding covariates to separate from the strength of the relation between the mean CAVI and WM integrity.
Additionally, the partial correlation analyses between each WM metric and the cognitive performance scores were examined separately for all participants, the high-CAVI group, and the low-CAVI group, adjusting for age, sex, and education level. Multiple comparisons were corrected using the false discovery rate procedure for each WM metric and region.22 The false discovery rate–corrected P < .05 was considered significant.
RESULTS
Participant Characteristics
Table 1 shows all participant characteristics. The high-CAVI group showed a significantly higher mean CAVI than the low-CAVI group. However, age, sex, education level, body mass index, heart rate, systolic blood pressure, diastolic blood pressure, and antihypertensive therapy history; the Mini-Mental State Examination; the Montreal Cognitive Assessment (Japanese version); Trail Making Test (TMT) A, TMT B, TMT B minus A; deep and subcortical WM hyperintensity; and periventricular hyperintensity were not significantly different between the 2 groups.
Whole-Brain Analysis
TBSS results identified a significantly lower MVF in the high-CAVI group than in the low-CAVI group in the broad WM area (family-wise error–corrected P < .05; Figure). RD was significantly higher in the high-CAVI group in specific WM areas such as the CC, FMi, bilateral IFOF, bilateral ATR, bilateral CR, and left IC compared with the low-CAVI group. The ISOVF was significantly higher in the high-CAVI group than in the low-CAVI group in the CC, FMi, right IC, right CR, right ATR, and right IFOF. Most interesting, RD and ISOVF changes were relatively overlapped, mainly observed in the anterior area. Whereas FA, mean diffusivity, axial diffusivity, the orientation dispersion index, and intracellular volume fraction did not significantly differ between 2 groups.
Tract-Specific Analysis
The univariate linear regression analysis revealed the significant associations of the mean CAVI with RD in the FMi; ISOVF in the CC, CR, and FMi; and MVF in the CR, IC, FMi, IFOF, ATR, and SLF (false discovery rate–corrected P < .05; Table 3). In the multivariate linear regression analyses adjusted for age, sex, antihypertensive therapy, systolic blood pressure, and intracranial volume, the mean CAVI was significantly associated with RD and ISOVF in the ATR and CR, and the MVF in the SLF (false discovery rate–corrected P < .05; Table 3).
Univariate and multivariate linear regression analyses adjusted for age, sex, antihypertensive therapy, systolic blood pressure, and intracranial volume for the association of mean CAVI with WM metrics in specific regions
In all participants, the partial correlation analyses demonstrated significant associations of TMT B with RD in the CR, FMi, and IC, or MVF in all tested WM regions (false discovery rate–corrected P < .05; Table 4). In the low-CAVI group, TMT B was significantly associated with RD in the FMi and MVF in the CR (false discovery rate–corrected P < .05; Table 4). Furthermore, the partial correlation coefficients for the significant associations of TMT B minus A with RD in the CR, IC, and FMi and with MVF in the ATR, CR, and FMi were noted in all participants (false discovery rate–corrected P < .05; Table 5). Meanwhile, the low-CAVI group had partial correlation coefficients for the significant associations of TMT B minus A with MVF in the CC, CR, FMi, IC, IFOF, and SLF (false discovery rate–corrected P < .05; Table 5). However, the partial correlation coefficients showed no significant associations among the Mini-Mental State Examination, the Montreal Cognitive Assessment (Japanese version), and TMT A and WM metrics.
Partial correlation coefficients between WM metrics and TMT B, adjusted for age, sex, and educationa
Partial correlation coefficients between WM metrics and TMT B minus A, adjusted for age, sex, and educationa
DISCUSSION
The present study evaluated the WM microstructural changes in older adults with arterial stiffness. The major findings are as follows: First, whole-brain voxelwise results identified a significantly lower MVF in the high-CAVI group than in the low-CAVI group in the broad WM regions. TBSS results also showed significantly higher RD and ISOVF in the high-CAVI group than in the low-CAVI group in the CC, FMi, IFOF, IC, CR, and ATR. Second, the multivariate linear analysis noted significant associations of the mean CAVI with RD and ISOVF in the ATR and CR; and with MVF in the SLF. Finally, we found partial correlation coefficients for the significant associations between the executive function scores and RD and MVF in specific WM areas.
Whole-brain voxelwise results revealed that the high-CAVI group had a significantly lower MVF value than the low-CAVI group in the broad WM area. Low MVF values indicate the loss of the myelin sheath insulating the nerves, implying WM demyelination.23 In this study, the high-CAVI group also had higher RD and ISOVF values than the low-CAVI group. High ISOVF values associated with high CAVI suggest increased extracellular water diffusion and have been shown to be related to increased inflammatory activation or blood-brain barrier permeability.24 Moreover, elevated RD is also associated with demyelination.25 From these results, the WM in the high-CAVI group could involve demyelination more than in the low-CAVI group. Furthermore, there were no significant differences in the degree of WM hyperintensities between the high- and low-CAVI groups in this study. Considering that TBSS showed significant differences in RD, ISOVF, and MVF between the two groups, our results suggest that WM microstructural changes precede WM hyperintensities and brain atrophy. In support of our findings, prior studies have indicated that DTI metrics capture ultrastructural changes in WM before the onset of WM hyperintensities and brain atrophy.26,27 Therefore, it is thought that there was no correlation between the degree of WM hyperintensities and WM metrics.
In the multivariate linear analyses, the mean CAVI was significantly associated with RD in the ATR, CR, and FMi; ISOVF in the ATR and CR; and MVF in the SLF. These findings could reflect arteriosclerosis relating to demyelination. In previous studies, the WM microstructure has been reported to be vulnerable to circulatory alterations and correlates with arterial stiffness.4⇓-6,20 Notably, Badji et al6 showed that carotid-femoral pulse wave velocity was significantly associated with both FA and RD but not with MVF.17 The present study indicated the significant associations between the mean CAVI and not only DTI and NODDI metrics but also MVF, possibly reflecting the progression of arteriosclerosis exacerbating demyelination. The conflicting results regarding MVF between this study and that of Badji et al might be caused by differences in the characteristics of the target cohort. For instance, in our study, the average value of the body mass index (22.54 [SD, 2.84] kg/m2) in all participants was lower than that in the study of Badji et al (26.1 ([SD, 4.23] kg/m2). However, the average value of systolic blood pressure (137.47 [SD, 15.67] mm Hg) in our study was higher than that in the study of Badji et al (125.66 [SD, 11.65] mm Hg). Suzuki et al24 showed that pathologic processes related to hypertension are associated with image differences, suggesting changes in WM axons. In addition, WM integrity is particularly vulnerable to obesity.28 A higher body mass index is associated with lower FA in the FMi and CC.29 Therefore, except for the degree of arterial stiffness, the difference in participants’ physical characteristics may influence WM integrity. However, exact matching of these clinical findings is difficult. Additionally, our participants were all Japanese, whereas the participants of Badji et al were all Canadian; thus, racial differences may affect WM integrity.30
The present study also showed the existence of the partial correlation coefficients for the significant associations between the executive function and WM metrics. In all participants and the low-CAVI group, the MVF in several WM areas was negatively associated with the executive function. These findings suggest that executive dysfunction may be associated with demyelination. However, in the high-CAVI group of the study, there was no significant connection between WM metrics and TMT scores, which are measures of executive function. Furthermore, although there was no difference in the TMT scores between the high- and low-CAVI groups, we found significant differences in WM metrics between two groups. The findings imply that WM microstructural changes may have already occurred before the impairment of executive function.
This study has some limitations. First, it is based on data obtained from Japanese individuals living in the city; hence, bias in genetic factors and environmental factors, such as eating habits, may occur. Second, it was conducted in a single facility. Thus, multicenter and epidemiologic studies are needed to examine further these investigations.
CONCLUSIONS
Arterial stiffness could be strongly associated with demyelination rather than axonal degeneration.
Footnotes
J. Kikuta and K. Kamagata contributed equally to this work.
This work is supported by the Strategic Research Foundation at Private Universities (S1411006) and KAKENHI (18H03184, 18H02772, and 20K16737) from the Ministry of Education, Culture, Sports, Science and Technology of Japan.
Disclosure forms provided by the authors are available with the full text and PDF of this article at www.ajnr.org.
Indicates open access to non-subscribers at www.ajnr.org
References
- Received July 12, 2022.
- Accepted after revision October 15, 2022.
- © 2022 by American Journal of Neuroradiology


Jump to section
Related Articles
Cited By...
- No citing articles found.