
Abstract
SUMMARY: In many pathophysiologic situations, including brain neoplasms, neurodegenerative disease, and chronic and acute ischemia, an imbalance exists between oxygen tissue consumption and delivery. Furthermore, oxygenation changes following a stress challenge, such as with carbogen gas or acetazolamide, can yield information about cerebrovascular reactivity. The unique sensitivity of the BOLD effect to the presence of deoxyhemoglobin has led to its widespread use in the field of cognitive neurosciences. However, the high spatial and temporal resolution afforded by BOLD imaging does not need to be limited to the study of healthy brains. While the complex relationship between the MR imaging signal and tissue oxygenation hinders a direct approach, many different methods have been developed during the past decade to obtain specific oxygenation measurements. These include qBOLD, phase- and susceptibility-based imaging, and intravascular T2-based approaches. The aim of this review is to give an overview of the theoretic basis of these methods as well as their application to measure oxygenation in both healthy subjects and those with disease.
ABBREVIATIONS:
- BOLD
- blood oxygen level–dependent
- CMRO2
- cerebral metabolic rate of oxygen consumption
- OEF
- oxygen-extraction fraction
- pO2
- partial pressure of oxygen
- qBOLD
- quantitative BOLD
- QUIXOTIC
- QUantitative Imaging of eXtraction of Oxygen and TIssue Consumption
- SaO2
- arterial oxygen saturation
- SO2
- blood oxygen saturation
- SvO2
- venous oxygen saturation
- TRUST
- T2-relaxation under spin-tagging
The development of a reliable brain oxygenation mapping technique would not only enable a better understanding of normal physiology during rest, sleep, or functional brain tasks but also be of great help in managing pathophysiologic conditions in which oxygen supply is disturbed. In tumors, it has long been recognized that the lack of oxygen in tissues (hypoxia) influences the response to therapies, including aggressiveness, local recurrence, and metastasis, as well as overall prognosis.1,2 In acute stroke, a parameter that could reflect the metabolic state of the ischemic brain may improve the ability to identify tissue at risk of infarction,3 to select patients for reperfusion therapies, or to avoid thrombolytic therapy in futile situations.4 In addition, many other disorders of the brain, including Alzheimer disease, Parkinson disease, Huntington disease, and multisystem atrophy, also appear to be associated with alterations in cerebral oxygen metabolism.5⇓–7
Important criteria for a useful oxygenation imaging method include noninvasiveness, adequate spatial and temporal resolution, ability to quantify oxygenation levels, low radiation exposure, good safety profile, and widespread clinical availability. Unfortunately, no in vivo method currently fulfills all these requirements.8 The development in the late 1980s of the polarographic needle electrode system has allowed accurate measurements of pO2 in vivo.9 Yet it provides only local measurements and is sufficiently invasive to discourage widespread use. Currently, the reference standard for tomographic whole-brain oxygenation measurement is PET, by using either oxygen-15 or hypoxia tracers, such as fluorine-18 misonidazole. However, PET is not widely available, and its use of ionizing radiation limits its repeated use in the same patient.
MR imaging is also known to be sensitive to blood oxygenation; the well-known BOLD contrast approach has been used for many years in the field of cognitive neuroscience. BOLD MR imaging is noninvasive and can be performed with high temporal and spatial resolution. However, the major drawback of the BOLD-based approach is that the relation between T2* and tissue oxygenation is determined by many other parameters, including macroscopic B0 inhomogeneities (shim, air/tissue interface), the transverse relaxation parameter T2, water diffusion, and the characteristics of the blood vessel network. Therefore, oxygenation measurements based only on T2* imaging are unlikely to be quantitative and may, in fact, be misleading.10 This review article will focus on the various approaches that have been proposed during the past decade to obtain specific oxygenation measurements by using MR imaging techniques that exploit the effects of blood deoxyhemoglobin levels on proton transverse relaxivity.
BOLD Effect
Origins and Methods
BOLD contrast relies on a difference of magnetic susceptibility between oxyhemoglobin and deoxyhemoglobin. Oxyhemoglobin is diamagnetic, and its presence has no effect on the MR signal. When deoxygenated, the molecule has unpaired electrons and becomes paramagnetic. Because the fraction of the average brain voxel filled with blood (ie, CBV) is only approximately 4%, if only intravascular MR imaging parameters were affected, the BOLD signal would be barely detectable. In fact, the magnetic field perturbations that give rise to the BOLD effect extend for a distance of up to 5 times the vessel radius, which increases its sensitivity dramatically (Fig 1). The dephasing effect is particularly strong on T2*-weighted images, which are sensitive to both spin-spin relaxation and magnetic field inhomogeneity. As a result, gradient-echo sequences that use a low flip angle, long TE, and long TR are usually employed. T2-weighted images from spin-echo imaging are also affected by the BOLD effect because of the effects of the diffusion of water molecules around the vessels.11 Most interesting, the sensitivity of T2 for a given change in deoxyhemoglobin concentration varies with vessel diameter, rising rapidly and then falling off as the vessel size increases.11 On the other hand, the sensitivity of T2* measurements remains high for approximately every vessel-diameter size that is normally present in the brain. The first consequence of this observation is that T2* measurements (by using gradient-echo) are preferable for oxygenation measurements because they are largely independent of blood vessel size distribution. Second, it is possible to measure oxygenation weighted to vessels of a specific size (such as the capillaries) by adjusting the TE times to vary the diffusion effect by using spin-echo sequences.
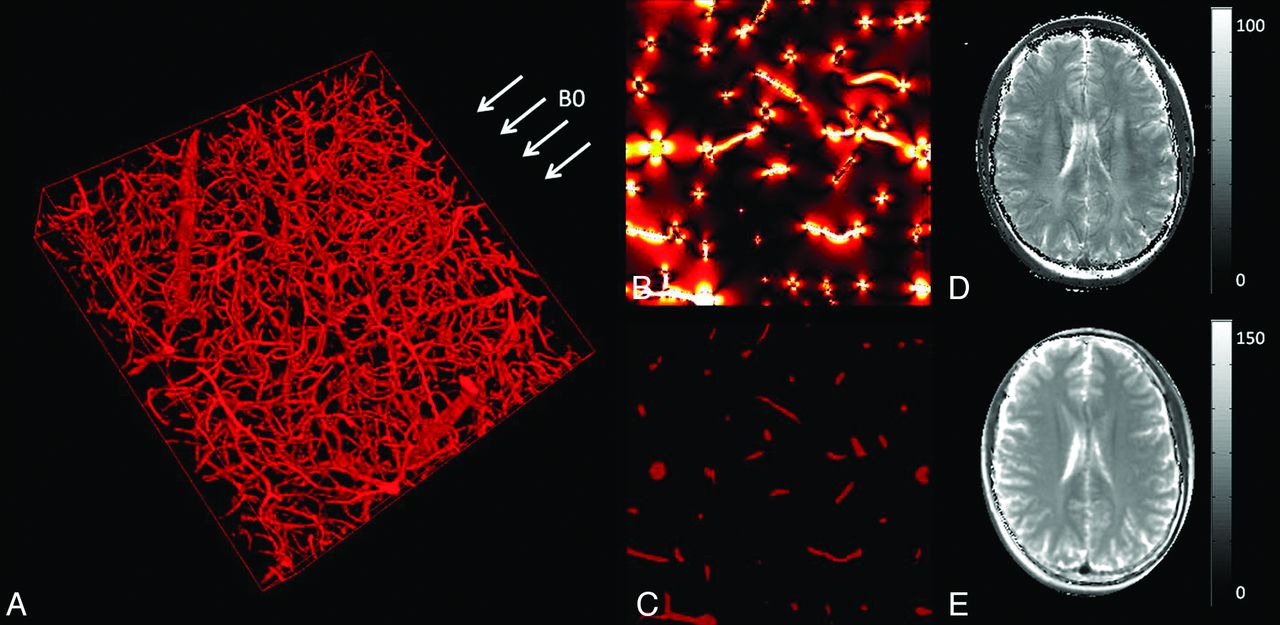
A, 3D representation of a microvascular network acquired with 2-photon microscopy and orientation of the MR imaging main magnetic field B0. B, Simulation of the magnetic field distribution in 1 section of the voxel represented in A when considering a blood oxygen saturation of 60%. C, Blood vessel geometry in the same section as in B. High-resolution T2* map (D) and T2 map (E) acquired in a volunteer at 3T. A–C are adapted from Christen et al.89
Oxygenation Basics
The SO2 is defined as the percentage of oxyhemoglobin in a vessel:
 where [HbO2] and [dHb] represent the concentration of oxy- and deoxyhemoglobin, respectively. With these parameters, the OEF may be defined as
 where SaO2 and SvO2 represent the arterial and venous oxygen saturation, respectively. If the arterial oxygen concentration (O2)a and the CBF are known, the CMRO2 may be determined by using the following relationship:
 A final important parameter for oxygenation measurements is the pO2, defined as the fraction of oxygen present in a gas multiplied by the total gas pressure. According to the hemoglobin dissociation curve (or Barcroft curve), pO2 and SO2 are directly linked inside the blood vessels. Therefore, BOLD measurements can be related to pO2.
These theoretic links between tissue oxygenation and BOLD can be affected by several factors. First, the magnitude of the BOLD effect depends on the total amount of deoxyhemoglobin in the voxel. Therefore, the hematocrit level and the CBV will strongly influence the conclusions about the oxygenation level. For example, with all oxygen levels being equal, a highly vascular part of a tumor will have a lower T2* than the corresponding contralateral tissue, due to its high CBV. Variations in temperature and pH changes due to variations of carbon dioxide or the addition of organic phosphate compounds will also shift or reshape the hemoglobin dissociation curve, affecting the relationship between SO2 and pO2. For BOLD to track tissue oxygenation status, it is important that red blood cells be delivered to the tissue in question. Yet studies on tumors have shown that vessels may be present but perfusion by red blood cells may not occur.12
BOLD Artifacts
BOLD images are subject to several artifacts. Signal enhancement, known as inflow effect, occurs because the signal produced by the water in blood flowing into the imaging section is much stronger than the one produced by the static spins (partially saturated by previous radio-frequency pulses). This effect can be minimized by using a multiecho gradient-echo sequence and computing the T2* relaxation rate (R2* = 1/T2*).13 Magnetic field inhomogeneities caused by magnet imperfections, poor shimming, air-tissue interfaces, metallic implants, or iron deposits can also affect the oxygenation measurements. Additionally, microscopic nuclear electron interactions between neighbor atoms give rise to a dissipative relaxation mechanism described by T2. This transverse relaxation time is linked to the T2* through the parameter T2′, by using the relationship 1/T2* = 1/T2 + 1/T2′. Therefore, the presence of high water content—such as in the setting of vasogenic edema—will increase the measured T2* independent of blood oxygenation changes.
Quantifying the BOLD Effect
Better understanding of the origin of the BOLD effect during the years has led the way to new types of T2*-based approaches. They have been integrated into mathematic models, instead of trying to reduce the previously mentioned confounding factors. Theoretically, this approach, sometimes called qBOLD, enables the extraction of only the deoxyhemoglobin effects, leading to more accurate assessment of brain oxygenation.
A Mathematic Model of Spin-Dephasing
These approaches have in common the use of a biophysical model, which was originally developed by Yablonskiy and Haacke14 and considers the effect of spin-dephasing in the presence of a vascular network. The MR imaging voxel is modeled as 2 compartments: 1) a vascular compartment represented as an ensemble of long cylinders with negligible wall thickness with small volume fraction, and 2) an extravascular compartment surrounding those vessels. Because the theoretic equation of the field perturbation induced by a paramagnetic cylinder is known, one can derive an equation of the MR signal evolution. Perhaps somewhat unexpectedly, instead of monoexponential decay, the MR signal evolution versus time has a quadratic exponential behavior during the first few milliseconds after excitation. This feature has been exploited in some qBOLD approaches to distinguish oxygenation and CBV effects.
Different qBOLD Approaches
The first validation of the qBOLD principle was by Yablonskiy15 in a phantom containing polyethylene tubes. An and Lin16 then demonstrated its applicability in human volunteers by using the method of gradient-echo sampling under the spin-echo, which, in theory, provided measurements of CBV and SO2. He and Yablonskiy17 refined the model by considering signal from gray matter, white matter, CSF, and blood as well as the effect of water diffusion.18,19 One interesting remark about these methods is that the CBV and blood oxygen saturation are observed through dephasing effects caused by the presence of deoxyhemoglobin. Therefore, if one assumes fully oxygenated arterial blood, the values that are derived represent only the venous and capillary portions of the vasculature.
Although an attractive feature of these qBOLD approaches is the determination of multiple parameters with a single noninvasive experiment, numeric simulations and phantom experiments show that reliable estimates are achieved only in the presence of a very high SNR.19,20 Particularly, the distinction between CBV and SO2 is quite challenging under normal experimental conditions. Christen et al21 recently described a multiparametric qBOLD approach that may increase the spatial resolution of the acquisitions and improve the accuracy of the oxygenation estimates by using independent measurements of B0, T2, and CBV combined with T2* estimates. The results show good correlation with blood gas analysis under various oxygenation conditions (Fig 2).21

Results from a multiparametric qBOLD approach. A, MR imaging estimates of SO2 as a function of directly measured SvO2 of the sagittal sinus in rats. Squares, triangles, and diamonds represent rats under conditions of hyperoxia, normoxia, and hypoxia, respectively. B, Representative T2-weighted images and SO2 maps in control and challenge conditions in 2 rats. Adapted from Christen et al.21
BOLD-Based Oxygenation Measurements in Health and Disease
Both simple T2* estimates of oxygenation and qBOLD have been applied to examine changes related to different disease states. Some of the more common clinical applications are described in the following sections.
Healthy Subjects
In vivo, An and Lin16 measured a mean cerebral oxygen saturation of 58 ± 2% in 8 healthy subjects, in excellent agreement with prior measurements performed with oxygen-15 PET.22 However the CBV reported was approximately 3 times higher (16 ± 7%) than prior literature estimates. The impact of shim and intravascular signal was analyzed in further articles,23,24 and validation was performed on rats.25 He and Yablonskiy17 also obtained encouraging results in 9 volunteers, measuring an OEF of 38 ± 5% and a CBV of 1.8 ± 0.1%. In 12 healthy subjects, Christen et al26 measured CBV of 4.3 ± 0.7%, CBF of 44 ± 6 mL/min/100 g, SO2 of 60 ± 6%, and CMRO2 of 157 ± 23 μmol/100 g/min, again in agreement with literature for both perfusion and oxygenation values.
Cerebral Ischemia
Simple T2* measurements have been proposed to delineate the penumbra in acute stroke. Because it reflects the metabolic state of tissues, it could be a good alternative to the simplified concept of the mismatch between PWI and DWI.27 Small case series suggest that T2* changes are present in patients with acute stroke.28⇓–30 As mentioned before, lack of information about T2 and CBV makes it difficult to draw conclusions about quantitative oxygenation in such studies. This is supported by an MR imaging study of 5 patients with acute stroke with hypoxia on PET, in which no relationship between increased PET OEF and hypointensity on T2*-weighted images could be demonstrated.31
Because edema alters considerably the transverse relaxation times, other studies have measured both T2* by using a gradient-echo sequence and T2 by using a spin-echo sequence, enabling measurement of T2′. Geisler et al32 analyzed data from 32 patients with acute stroke in the territory of the middle cerebral artery. T2′ imaging was performed on days 1, 5, and 8. The results showed a clear decrease of T2′ in the infarcted hemisphere compared with the contralateral hemisphere. Furthermore, regions outlined with T2′ appeared distinct from the ADC lesion, and the authors concluded that it yielded a better estimation of the penumbra. A comparison among PWI, DWI, and T2′ imaging was also performed in a study involving a larger cohort of 100 patients with stroke who received intravenous thrombolytic therapy.33 Two independent readers reported that the presence of a T2′ > ADC mismatch was a more specific predictor of infarct growth than was the PWI-derived TTP/ADC mismatch and hence may be of clinical value in patient selection for acute stroke therapies. However, because CBV changes also occur in acute stroke, no firm conclusions about oxygenation levels can be made from these studies.
The qBOLD method has been applied to study oxygenation in a rat stroke model.25 These authors found that SO2 was significantly lower within the areas of eventual infarction than within other regions and that the values within the ischemic territory decreased with time. Several reports of the use of qBOLD in human cerebrovascular disease have been reported. Lee et al34 demonstrated that the CMRO2 measured by MR imaging by using the qBOLD approach in acute ischemic stroke was reduced most severely in tissue that eventually infarcted, with smaller reductions in regions of the perfusion deficit that were spared on follow-up imaging. Xie et al35 showed that hypoxic brain regions can be visualized in patients with steno-occlusive disease of the carotid artery by using the qBOLD technique. Finally, sequences that can acquire multiple gradient-echo and spin-echo images simultaneously36 may enable rapid assessment of T2′ and CBV, which is important during the initial diagnostic evaluation of acute stroke (Fig 3).37

Parametric maps obtained with a quantitative BOLD approach by using a multiecho gradient-echo and spin-echo echo-planar imaging method in a healthy subject (A) and a patient with stroke (B). High OEF can be observed in the affected region of the patient with stroke (white arrow). This method holds promise to evaluate the brain oxygenation status in a rapid fashion, which is critical in the acute stroke work-up. Adapted from Christen et al.37
Tumor Hypoxia
Punwani et al38 found a strong linear relationship between R2* and dHb (estimated by using near-infrared spectroscopy) in neonatal piglets exposed to different fractional inspired oxygen concentrations. However, there is evidence that R2* does not measure or correlate directly with pO2 values in tumors. Baudelet and Gallez39 reported a poor correlation between R2* and measurements of pO2 by using fiber optic electrodes in murine tumors during respiratory challenges, while Chopra et al40 also showed a weak relationship in human prostate cancer. Contrary to this, a significant link was found between R2* and pimonidazole histology (a marker of cellular hypoxia) in patients with prostate carcinoma undergoing radical prostatectomy.41 The results showed that the sensitivity of R2* in depicting tumor hypoxia was high (88%), but its sensitivity was low (36%). McPhail and Robinson42 found good correlation between pimonidazole adduct formation and tumor R2* (1/T2*) in a rat mammary tumor model, but paradoxically, the less hypoxic tumors had higher R2*. The conflicting results of these animal studies may indicate that independent CBV measurements are required to interpret changes in T2*, as mentioned above.
The potential prognostic ability of T2* in tumor was reported by Rodrigues et al.43 They showed that 2 animal tumor models that exhibit different baseline value of R2* also showed radiotherapeuic outcomes. The rat GH3 prolactinoma, which exhibits a relatively high R2* before radiation therapy, showed a substantial reduction in normalized tumor volume 7 days after 15-Gy irradiation, while murine radiation-induced fibrosarcoma-1 fibrosarcomas with low R2* before treatment grew more rapidly. At this time, there are no qBOLD or T2* studies evaluating tumor oxygenation in humans, to our knowledge.
Challenge Paradigms
Dynamic approaches have been proposed to avoid some of the problems inherent to oxygenation imaging with BOLD. By observing the spatial and temporal variations of the MR signal in response to an external stimulus, static artifacts such as field inhomogeneity and T2 variation are minimized. The best-known and most widely used stimulus, task-based activation, is the basis of fMRI. However, other challenges can be applied, most of which affect either O2 directly (such as 100% oxygen gas inhalation) or indirectly through the strong CO2 effects on brain hemodynamics (such as carbogen [95% O2, 5% CO2] gas inhalation, breathhold, and acetazolamide). For example, in the normal brain, changes in the fraction of inspired oxygen from air (21% O2) to 100% oxygen produce changes in MR signal ranging from >30% in large veins to 1.71 ± 0.14% in the basal ganglia and 0.82 ± 0.08% in white matter.44 Caffeine, hyperthermia, or drugs such as hydralazine or nicotinamide have also been proposed as global oxygenation modifiers.13,45
The main application of the observations of dynamic BOLD changes in response to extrinsic challenges has been the development of the quantitative fMRI method.46 The results from hypercapnic experiments in volunteers can be used to calibrate the BOLD signal and obtain quantitative variations of the CMRO2 during functional activation. Oxygen used as a contrast agent may also provide a noncontrast method of obtaining quantitative CBV maps47 or the vessel-size index.48
Cerebral Ischemia
Oxygen challenges have been recently evaluated in the context of stroke. In a model of permanent middle cerebral artery occlusion in rats,49 5 minutes of breathing 100% O2 induced different signal changes within the contralateral cortex, ipsilateral cortex within the PWI/DWI mismatch zone, and ischemic core. Furthermore, the correlation with histology revealed a significant difference between the T2* signal increase in the histologically defined borderzone compared with the ischemic core. The first clinical application of T2*-weighted MR imaging during oxygen challenge was presented by Dani et al.50 In 18 patients with stroke, the area under the curve, gradient of the signal increase, time to maximum signal, and percentage signal change after breathing 100% O2 were measured. Results showed that these parameters within the diffusion lesion were smaller compared with normal tissue. Curves in the presumed penumbral regions showed varied morphology, but at hyperacute time points (<8 hours), they exhibited a tendency to greater percentage signal change. Studies in patients with Moyamoya disease and steno-occlusive disease have been performed by using carefully controlled mixtures of O2 and CO2. These have shown that there is good correspondence between regions with abnormal R2* changes and poor cerebrovascular reactivity,51,52 which may have prognostic implications.53
Tumor Hypoxia
Numerous applications of dynamic BOLD following external stimulus have been performed in tumors. Carbogen has been extensively used because of its large effect on the MR signal (Fig 4). Taylor et al54 investigated a wide range of tumors (lymphoma, squamous carcinoma, transitional carcinoma, adenocarcinoma, and so forth), demonstrating significant increases in BOLD signal (range, 6.5%–82%) with carbogen breathing in 60% of cases. Furthermore, Rodrigues et al43 showed that carbogen-induced ΔR2* is an informative parameter with respect to potential radiotherapeutic outcome. A greater magnitude of the response to carbogen was associated with a better radiotherapeutic response. Additional investigations have shown good correlations between R2* changes and tumor pO2 in animals by using reference standards of either polarographic electrodes,55 electron paramagnetic resonance,56 fluorine-19 perfluorocarbon MR imaging measurements,57 or pimonidazole adduct formation.42 These encouraging results were, however, challenged by the work by Baudelet and Gallez.39 In their study, the evolution of the local BOLD response in a rat tumor model was temporally correlated with local pO2 change, but there was no correlation of the BOLD signal amplitude with absolute pO2. Moreover, the sensitivity of R2* to the change in pO2 varied among tumor types.

Oxygen-sensitive MR imaging in the setting of cerebrovascular challenge during a 2-minute inhalation of carbogen gas (95% O2, 5% CO2). Images were acquired by using a multiple spin- and gradient-echo pulse sequence that enables the measurement of T2* and T2* with high temporal resolution. Note the increase in signal corresponding to decreased T2 and T2* during carbogen inhalation (gray column).
The major limitation of BOLD challenge approaches is the fact that they do not measure absolute tissue SO2 directly and have low SNR. In addition, carbogen inhalation is somewhat poorly tolerated in humans (approximately 25%–35% of patient examinations fail due to respiratory distress).58 These approaches could, however, be useful to guide the design of new and more effective tumor oxygenating agents (which have shown only marginal effect on the radiosensitivity of human tumors55) and to optimize treatments for individual patients. This technique could also offer a possible novel approach to metabolic imaging in acute stroke and provide a more precise assessment of penumbra. Finally, in addition to examining T2*, the shortening of the tissue water T1 value during hyperoxic gas breathing has been proposed to measure oxygenation.59,60 A combination of ΔR2* and ΔR1 measurements may yield new insights into brain tissue oxygenation.
Using MR Phase to Measure Oxygenation
Although not usually exploited, the phase information of the MR signal can be an excellent source of contrast.61 The phase shift in a gradient-echo image represents the average magnetic field in a voxel, which depends on the local magnetic susceptibility. As a consequence, relative abundance of the paramagnetic substances such as myelin or iron can be imaged with phase imaging. In the context of oxygenation, methods that take advantage of the difference in magnetic susceptibility between deoxygenated blood and the surrounding tissue have also been proposed.
Susceptibility-Based Oximetry
Blood oxygen saturation of major vessels (eg, the superior sagittal sinus) can be obtained by measuring the phase difference (Δφ) between blood and surrounding brain parenchyma in a flow-compensated image,62 by using the following relationship:
 where ΔB represents the difference in the magnetic field between the 2 compartments and TE. By modeling the blood vessel as a long paramagnetic cylinder, an exact expression for the incremental field ΔB can be derived as
 where Δχdo = 0.27 ppm (in centimeter-gram-second units) and is the susceptibility difference between fully deoxygenated and fully oxygenated erythrocytes and θ is the angle of the cylinder relative to the applied field B0. If the hematocrit (Hct) is known (eg, determined from a blood sample), the only unknown is the oxygen saturation (SO2).
Fernandez-Seara et al63 measured an SvO2 of 66 ± 8% in the internal jugular vein of 5 volunteers and a decrease in oxygen saturation of 7 ± 3% during breathhold. Another study assessed oxygenation in pial veins of 5 volunteers,64 measuring SO2 = 54 ± 3%. If the blood flow is also quantified in the major inflow vessels (internal carotid arteries and vertebral arteries) by using phase-contrast MR imaging,65 an estimate of the global CMRO2 may be obtained. Using this principle, Jain et al66 reported a global brain SO2 of 64 ± 4%, CBF of 45 ± 3 mL/100 g/min, and CMRO2 of 127 ± 7 mol/100 g/min.
This technique is noninvasive, includes self-calibration, has equal sensitivity to all oxygenation levels, and is relatively straightforward to implement. Possible errors resulting from vessel tilt, noncircularity of vessel cross-section, and induced magnetic field gradients have been evaluated.67,68 These effects are generally low, and methods for correction have already been designed and implemented. The main drawback of susceptometry-based oximetry remains that only medium- to large-sized vessels can be targeted, providing mainly global brain oxygen information, though a recent study has proposed extending the technique to smaller veins with favorable orientations.69
Susceptibility Mapping
Recently, a new technique called susceptibility imaging has been proposed to derive quantitative susceptibility maps from MR phase images. Susceptibility imaging uses recent mathematic developments initially designed for rapidly simulating the field shifts produced by arbitrary susceptibility distributions.70,71 With a dipolar field approximation, there is a simple expression that links phase and susceptibility (χ):
 where FT denotes a Fourier transform, kz is the z-component of the k-space vector parallel to the main magnetic field, and k is the magnitude of the k-space vector. Quantitative maps of susceptibility may be obtained by inverting this equation. However, this process is ill-posed because it cannot be accurately determined in regions near the conical surfaces defined by k2 − 3kz2 = 0. A variety of approaches have been proposed to address this issue, including thresholding to avoid division by zero,72,73 multiple acquisitions while the object is rotated in the scanner,74,75 and Bayesian regularization of the inverse problem.76,77
Susceptibility mapping has many possible applications, including accurate in vivo measurement of the concentration of contrast agents as well as investigation of the relationship between iron content and the progression of neurodegenerative diseases. To date, only 1 study78 has focused on blood oxygenation measurements by using susceptibility mapping, and it found that the major veins in the brain could be visualized. Technical developments are still needed to improve spatial resolution, reduce artifacts, increase the temporal resolution, and evaluate the range of blood oxygen sensitivity that is achievable. However, susceptibility imaging is likely to be a formidable tool to investigate blood oxygenation, even in small vessels (Fig 5).
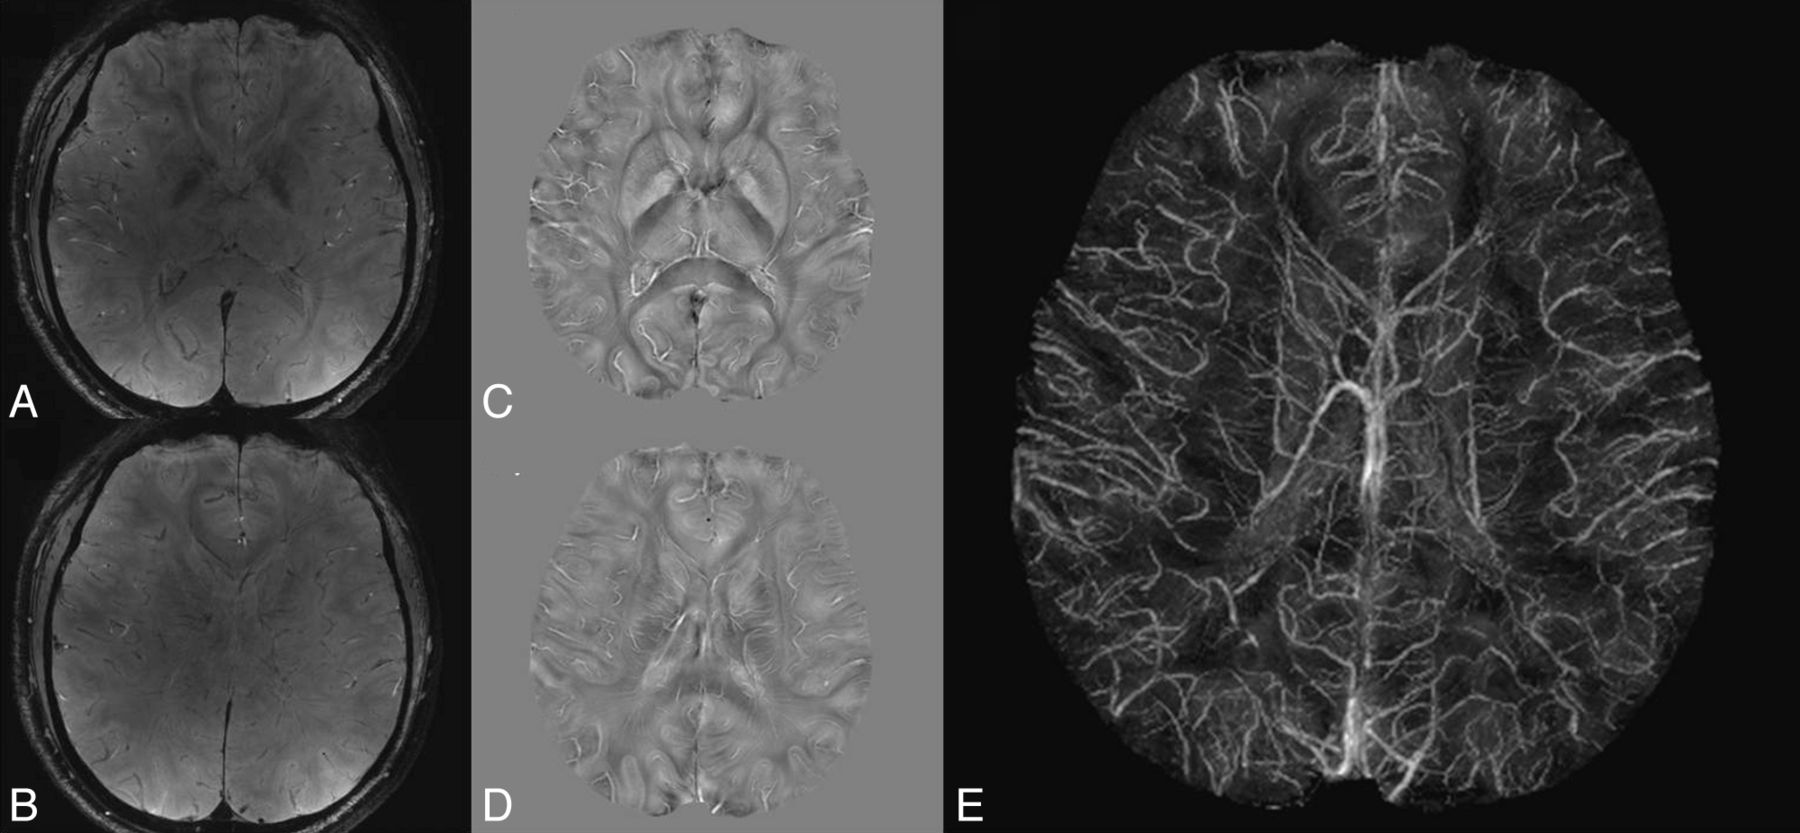
Quantitative magnetic susceptibility mapping in a volunteer at 7T. A and B, Gradient-echo weighted images. C and D, Corresponding magnetic susceptibility maps. E, Maximum intensity projection of the magnetic susceptibility maps over a 20-mm slab. Courtesy of Drs D. Qiu and M. Moseley, Stanford University.
Using Intravascular T2 to Measure Oxygenation
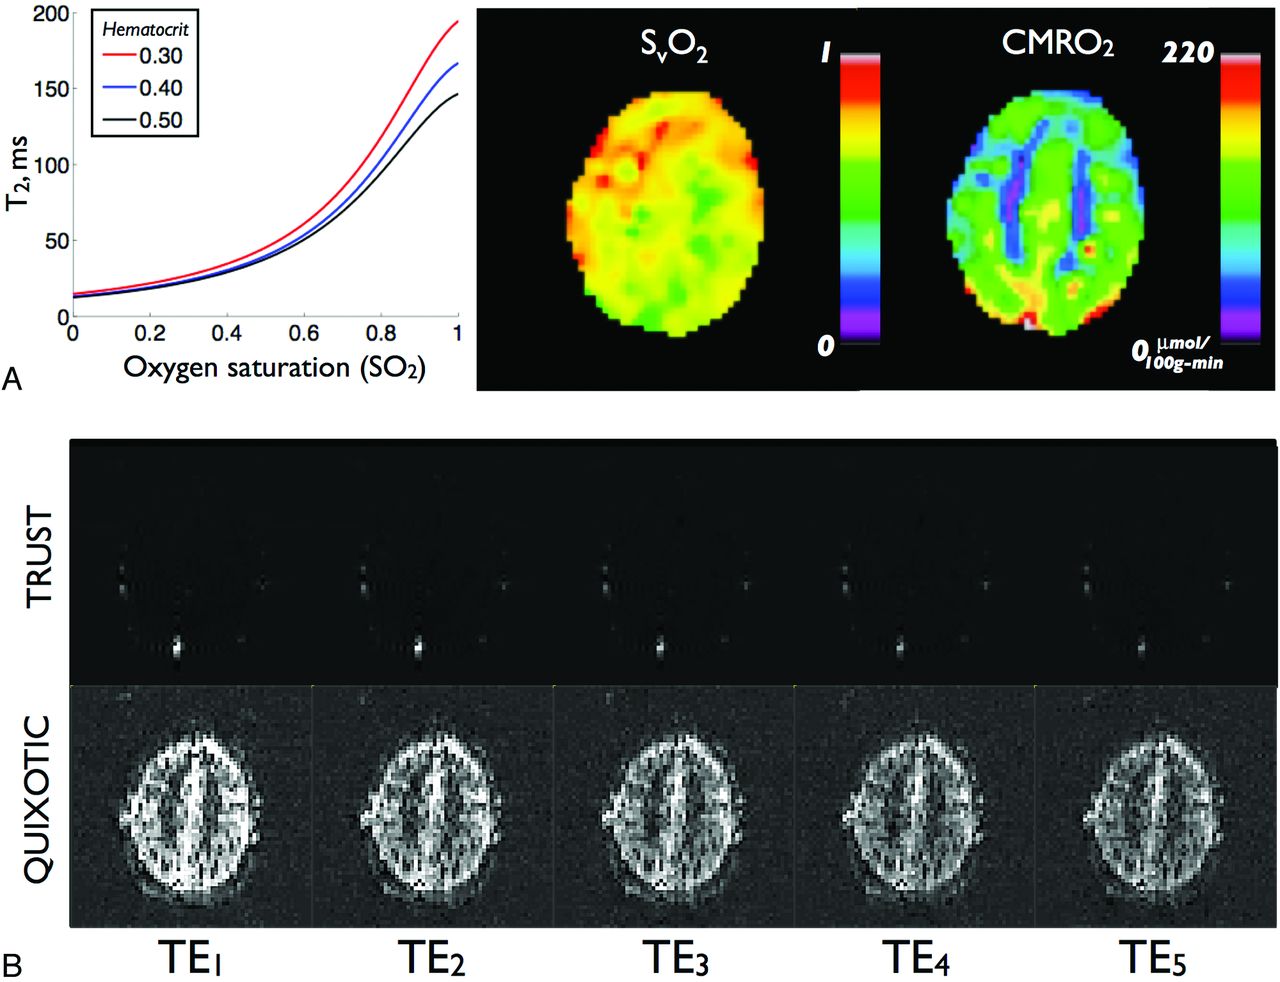
In contrast to T2* and qBOLD methods, which target the effects of dHb on extravascular tissue signal, an alternative approach involves quantifying dHb-induced signal loss in intravascular blood. These techniques invoke an MR signal model that establishes an analytic relationship between the blood T2 relaxation, SO2, and hematocrit and excludes signal contributions from extravascular constituents. The model has been extensively described79⇓⇓–82 and recently applied in humans at 3T.83 With this model, T2-versus-SO2 calibration curves can be generated and used to convert venous blood T2 to absolute SvO2 (Fig 6A).

Results from intravascular T2-based approaches. A, Sample T2 versus SO2 calibration curve for several hematocrit levels. B, Representative venous-blood-weighted images at multiple TEs for TRUST (top row) and QUIXOTIC (bottom row). Adapted from Bolar et al.87
The major challenge in using intravascular T2 to measure SvO2 is isolating pure venous blood signal that is free from extravascular and nonvenous blood components. If this obstacle can be overcome, intravascular methods offer several advantages. First, they are relatively insensitive to non-dHb sources of magnetic field variation, such as static field heterogeneity and tissue iron differences. Second, because signal originates solely from intravascular blood, the percentage contribution of extravascular voxel constituents does not need to be assumed or measured. Third, because empiric T2 and SO2 relationships can be established in vitro with pure blood phantoms, calibration curves for a specific experimental setup and field strength can be determined empirically. As such, exact values of difficult-to-measure biophysical model parameters are not required.
Isolating pure venous blood signal, however, is a nontrivial task. This is primarily due to partial voxel voluming with tissue, CSF, and nonvenous blood. To circumvent this issue, initial intravascular T2 studies targeted blood in large veins only.80,82 These studies used BOLD contrast to first locate draining veins from active sites and then measured T2 and SvO2 in voxels within these vessels. Despite careful voxel selection, however, limits on spatial resolution make partial volume effects difficult to avoid.
TRUST
More recently, spin-labeling–based approaches have been creatively used to isolate venous blood signal. Lu and Ge proposed TRUST MR imaging and measured SvO2 in the sagittal sinus.84 TRUST uses pulsed arterial spin-labeling MR imaging theory,85 but instead labels blood on the venous side of circulation. Paired subtraction (as in typical arterial spin-labeling data processing) results in an image containing blood signal from large veins only, with tissue and CSF completely removed. If one acquires these images at multiple echo times and measuring T2 in a large vein, it is possible to measure global SvO2. Figure 6B (top row) shows representative multiecho TRUST images; T2 signal decay within the sagittal sinus is demonstrated. TRUST has been recently applied and validated in humans, with a study of 17 subjects reporting mean global SvO2 of 63 ± 5%, CBF of 43 ± 7 mL/min/100 g, and CMRO2 of 132 ± 20 μmol/min/100 g.86 Despite being a spin-labeling technique, TRUST has high SNR due to the large blood volume within draining vein voxels and can thus be accurately performed in minutes. A limitation of TRUST is that measurements are restricted to terminal veins, making regional SvO2 estimation difficult.
QUIXOTIC
A second approach dubbed QUIXOTIC extends the utility of spin-labeling and isolates venous blood on a voxel-by-voxel basis, thus allowing localized SvO2 measurements.87 QUIXOTIC uses a velocity-selective excitation scheme that is related to velocity-selective arterial spin-labeling.88 In principle, QUIXOTIC applies velocity-sensitive pulses to eliminate signal from blood flowing above preset cutoff velocities. By carefully timing these pulses, one can exploit the physiologic blood velocity distribution and create a venular-blood bolus that persists after arterial spin-labeling subtraction.87 Signal from static tissue, CSF, and nonvenular blood compartments is eliminated, resulting in a pure venular-blood map. As in TRUST, QUIXOTIC venous blood–weighted images are acquired at multiple TEs (Fig 6B) to generate T2 maps from which SvO2, OEF, and CMRO2 images are subsequently computed (Fig 6C). QUIXOTIC performed in 10 healthy subjects found a mean gray matter SvO2 of 73 ± 2%, CBF of 56 ± 8 mL/min/100 g, OEF of 26 ± 2%, and CMRO2 of 125 ± 15 μmol/min/100 g. Notably, QUIXOTIC reports parenchymal SvO2 values higher than those reported by qBOLD and PET methods. The source of this discrepancy is currently under investigation; an in-depth discussion can be found in Bolar et al.87 The main limitation of QUIXOTIC is low SNR, due to low CBV in a typical parenchymal voxel. This is expected to become less of an issue at higher field strengths and with the use of multiple-element imaging coils. Notably, like arterial spin-labeling, QUIXOTIC can be used in functional imaging to create quantitative SvO2 and OEF activation maps.
Conclusions
These different MR imaging approaches to assess brain oxygenation have great potential, because they are noninvasiveness, have high temporal and spatial resolution, and may be repeated under different conditions, including cerebrovascular reactivity challenges. While each approach has its own advantages and disadvantages, combinations of these methods may complement each other to correct for possible artifacts and incorporate new physiologic information to obtain a global vision of blood oxygenation. For example, phase data about mid-to-large-sized vessels can be analyzed in parallel with the data from qBOLD results on the microvasculature. These results would also help to correct the T2* acquisitions due to macroscopic inhomogeneities or the presence of other sources of magnetic susceptibility such as of tissue iron. A combination of R2* and ΔR2* (from cerebrovascular challenge studies) could lead to a distinction between tissues that are hypoxic but still can or cannot respond to an oxygenation challenge. The future research directions for MR oximetry may extend beyond the quest for absolute values of oxygenation such as SO2 or pO2 per se. Instead, the significance of these methods may be their relationship to treatment response and the opportunity to guide the development of oxygenating agents, which would have significant clinical impact.
Footnotes
Disclosures: Divya Bolar—UNRELATED: Patents (planned, pending, or issued): I have a patent pending called “System and Method to Analyze Blood Parameters using Magnetic Resonance Imaging,” of which I am an inventor. No money has been paid to me or my institution. Greg Zaharchuk—UNRELATED: Consultancy: GE Healthcare Neuroradiology Advisory Board, Grants/Grants Pending: numerous National Institutes of Health grants; some research support from GE Healthcare.
Indicates open access to non-subscribers at www.ajnr.org
REFERENCES
- 1.↵
- 2.↵
- 3.↵
- 4.↵
- 5.↵
- 6.↵
- 7.↵
- 8.↵
- 9.↵
- 10.↵
- 11.↵
- 12.↵
- 13.↵
- 14.↵
- 15.↵
- 16.↵
- 17.↵
- 18.↵
- 19.↵
- 20.↵
- 21.↵
- 22.↵
- 23.↵
- 24.↵
- 25.↵
- 26.↵
- 27.↵
- 28.↵
- 29.↵
- 30.↵
- 31.↵
- 32.↵
- 33.↵
- 34.↵
- 35.↵
- 36.↵
- 37.↵
- 38.↵
- 39.↵
- 40.↵
- 41.↵
- 42.↵
- 43.↵
- 44.↵
- 45.↵
- 46.↵
- 47.↵
- 48.↵
- 49.↵
- 50.↵
- 51.↵
- 52.↵
- 53.↵
- 54.↵
- 55.↵
- 56.↵
- 57.↵
- 58.↵
- 59.↵
- 60.↵
- 61.↵
- 62.↵
- 63.↵
- 64.↵
- 65.↵
- 66.↵
- 67.↵
- 68.↵
- 69.↵
- 70.↵
- 71.↵
- 72.↵
- 73.↵
- 74.↵
- 75.↵
- 76.↵
- 77.↵
- 78.↵
- 79.↵
- 80.↵
- 81.↵
- 82.↵
- 83.↵
- 84.↵
- 85.↵
- 86.↵
- 87.↵
- 88.↵
- 89.↵
- © 2013 by American Journal of Neuroradiology
In this issue


Jump to section
Related Articles
Cited By...
- Spatially resolved quantification of oxygen consumption rate in ex vivo lymph node slices
- MR Thermometry in Cerebrovascular Disease: Physiologic Basis, Hemodynamic Dependence, and a New Frontier in Stroke Imaging
- Comparison of Blood Oxygenation Level-Dependent fMRI and Provocative DSC Perfusion MR Imaging for Monitoring Cerebrovascular Reserve in Intracranial Chronic Cerebrovascular Disease
- Preoperative Cerebral Oxygen Extraction Fraction Imaging Generated from 7T MR Quantitative Susceptibility Mapping Predicts Development of Cerebral Hyperperfusion following Carotid Endarterectomy
- The Brain Thermal Response as a Potential Neuroimaging Biomarker of Cerebrovascular Impairment
- Long-Delay Arterial Spin Labeling Provides More Accurate Cerebral Blood Flow Measurements in Moyamoya Patients: A Simultaneous Positron Emission Tomography/MRI Study
- Noninvasive Assessment of Oxygen Extraction Fraction in Chronic Ischemia Using Quantitative Susceptibility Mapping at 7 Tesla