
Abstract
BACKGROUND AND PURPOSE: 62Cu-diacetyl-bis(N4-methylthiosemicarbazone) was developed as a hypoxic radiotracer in PET. We compared imaging features among MR imaging and 62Cu-diacetyl-bis(N4-methylthiosemicarbazone)-PET, FDG-PET, and L-methyl-[11C]methionine)-PET in gliomas.
MATERIALS AND METHODS: We enrolled 23 patients who underwent 62Cu-diacetyl-bis(N4-methylthiosemicarbazone)-PET and FDG-PET and 19 (82.6%) who underwent L-methyl-[11C]methionine)–PET, with all 23 patients undergoing surgery and their diagnosis being then confirmed by histologic examination as a glioma. Semiquantitative and volumetric analysis were used for the comparison.
RESULTS: There were 10 newly diagnosed glioblastoma multiforme and 13 nonglioblastoma multiforme (grades II and III), including 4 recurrences without any adjuvant treatment. The maximum standardized uptake value and tumor/background ratios of 62Cu-diacetyl-bis(N4-methylthiosemicarbazone), as well as L-methyl-[11C]methionine, were significantly higher in glioblastoma multiforme than in nonglioblastoma multiforme (P = .03 and P = .03, respectively); no significant differences were observed on FDG. At a tumor/background ratio cutoff threshold of 1.9, 62Cu-diacetyl-bis(N4-methylthiosemicarbazone) was most predictive of glioblastoma multiforme, with 90.0% sensitivity and 76.9% specificity. The positive and negative predictive values, respectively, for glioblastoma multiforme were 75.0% and 85.7% on 62Cu-diacetyl-bis(N4-methylthiosemicarbazone), 83.3% and 60.0% on L-methyl-[11C]methionine, and 72.7% and 75.0% on MR imaging. In glioblastoma multiforme, volumetric analysis demonstrated that 62Cu-diacetyl-bis(N4-methylthiosemicarbazone) uptake had significant correlations with FDG (r = 0.68, P = .03) and L-methyl-[11C]methionine (r = 0.87, P = .03). However, the 62Cu-diacetyl-bis(N4-methylthiosemicarbazone)–active region was heterogeneously distributed in 50.0% (5/10) of FDG-active and 0% (0/6) of L-methyl-[11C]methionine)–active regions.
CONCLUSIONS: 62Cu-diacetyl-bis(N4-methylthiosemicarbazone) may be a practical radiotracer in the prediction of glioblastoma multiforme. In addition to FDG-PET, L-methyl-[11C]methionine)–PET, and MR imaging, 62Cu-diacetyl-bis(N4-methylthiosemicarbazone)-PET may provide intratumoral hypoxic information useful in establishing targeted therapeutic strategies for patients with glioblastoma multiforme.
ABBREVIATIONS:
- 62Cu-ATSM
- 62Cu-diacetyl-bis(N4-methylthiosemicarbazone)
- GBM
- glioblastoma multiforme
- MET
- L-methyl-[11C]methionine
- non-GBM gliomas
- World Health Organization grade II and III gliomas
- SUVmax
- maximum standardized uptake value
- T/B ratio
- tumor/background ratio
Gliomas have heterogeneously infiltrative and proliferative features, among which glioblastoma multiforme (GBM) is the most common and has the worst prognosis in adults.1 From a histopathologic standpoint, microvascular proliferation and/or necrosis is essential for the diagnosis of GBM.1 However, random tissue sampling may not always lead to an accurate diagnosis because of tissue heterogeneity. Therefore, other diagnostic modalities to predict highly malignant regions, such as PET imaging, can provide complementary diagnostic and therapeutic information and guide selective target tissue sampling or resection.
Malignant tumor cells display an increased flux of glucose metabolism by increased expression of glucose transporters and hexokinase, as well as an increased rate of amino acid uptake and metabolism.2 This increased transport and high metabolism occur commonly in GBM and can be detected by widely used techniques, such as FDG-PET and L-methyl-[11C]methionine (MET)-PET.3⇓⇓⇓⇓⇓–9 However, the predictive value of these PET imaging techniques has not been adequate for a diagnosis of GBM because uptake of these tracers is not specific in GBM.3,4 On the other hand, tissue hypoxia and necrosis are cardinal features of GBM that are often associated with resistance to radiation therapy and chemotherapy.10 Thus, intratumoral hypoxic information may be useful for an accurate diagnosis and establishment of effective therapeutic strategies for gliomas.
Some clinical investigations by use of [18F]fluoromisonidazole-PET have been recently undertaken to detect tissue hypoxia noninvasively in gliomas.11⇓–13 On the other hand, we previously reported the clinical usefulness of 62Cu-diacetyl-bis(N4-methylthiosemicarbazone) (62Cu-ATSM)-PET imaging for gliomas.14 Our preliminary study revealed a relationship between 62Cu-ATSM uptake values and hypoxia-inducible factor-1α expression, which is increased under hypoxia,14 suggesting that 62Cu-ATSM-PET is a practical hypoxic imaging technique in gliomas. However, whether 62Cu-ATSM uptake is specific in GBM was not determined, and the correlation of 62Cu-ATSM findings with FDG and MET remained unclear in GBM. In addition, to assess whether 62Cu-ATSM uptake is dependent on BBB breakdown and to evaluate an additional value over MR imaging findings, we volumetrically and qualitatively compared 62Cu-ATSM-PET imaging with T1-weighted MR imaging with Gd-DTPA.
Materials and Methods
Patients
This study was approved by the local ethics committee (Institutional Review Board no. B1001111026) after written informed consent was obtained from all patients. Between December 2010 and December 2012, we prospectively performed 62Cu-ATSM-PET in 68 patients with malignant brain tumors. Among them, 23 consecutive patients with pathologically confirmed gliomas (10 men and 13 women; age range, 19–81 years; mean age, 54.2 ± 17.5 years) who received FDG-PET and/or MET-PET with 62Cu-ATSM-PET were retrospectively analyzed. FDG-PET and MET-PET imaging were performed in 23 patients (100%) and 19 patients (82.6%), respectively. Of the 23 patients, 19 (82.6%) were newly diagnosed, and the remaining 4 patients (17.4%), who previously underwent biopsy but had not received any radiation therapy or chemotherapy, were diagnosed as having tumor recurrence. Histologic diagnosis and tumor grade were classified according to the following 2007 World Health Organization criteria: 8 (34.8%) grade II (3 diffuse astrocytomas, 3 oligoastrocytomas, and 2 oligodendrogliomas); 5 (21.7%) grade III (1 anaplastic oligoastrocytoma and 4 anaplastic oligodendrogliomas); and 10 (43.5%) grade IV (GBM). All 10 patients with GBM were newly diagnosed. Thirteen grade II and III gliomas (56.5%) were classified as non-GBM gliomas. The oligodendroglial component was found in 10 (76.9%) of 13 non-GBM gliomas.
Intervals from the MR imaging investigation to 62Cu-ATSM-PET, FDG-PET, and MET-PET were 5.4 ± 4.1, 4.3 ± 3.2, and 5.4 ± 3.4 days, respectively (mean ± SD). All patients underwent surgery the day after a repeated MR imaging study for neuronavigation, and their diagnosis was confirmed on histologic examination. On-Line Table 1 summarizes the patient characteristics.
PET and MR Image Acquisition
Preparation of 62Cu-ATSM, FDG, and MET has been described in previous reports.15,16 To acquire 62Cu-ATSM-PET and FDG-PET/CT images, a whole-body PET/CT scanner (Aquiduo PCA-7000B; Toshiba, Tokyo, Japan) with a 16-row detector in the CT component was used at the Yokohama City University Hospital (Yokohama, Japan). MET-PET imaging was performed with PET/CT scans (Biograph 16; Siemens, Erlangen, Germany) at the National Center for Global Health and Medicine (Tokyo, Japan). An image quality phantom (NU 2–2001; National Electrical Manufacturers Association) was used for cross-calibration because such phantoms are widely used and allow estimation of optimal acquisition times.
For 62Cu-ATSM-PET/CT and FDG-PET/CT, the following conditions were used for acquisition of low-dose CT data: 120 kVp, an auto-exposure control system, a beam pitch of 0.875 or 1, and a 1.5- or 2-mm × 16-row mode. No iodinated contrast material was administered. After intravenous injection of 740 MBq of 62Cu-ATSM, the patients were placed in a supine “arm-up” position. Dynamic data acquisition was carried out for 30–40 minutes, and PET/CT images were reconstructed from the data. For studies of FDG, the patients received an intravenous injection of 370 MBq of FDG after at least 6 hours of fasting, followed by an uptake phase of approximately 60 minutes. For MET-PET/CT, the following conditions were used for acquisition of low-dose CT data: 120 kVp, an auto-exposure control system, a beam pitch of 0.875, and a 3-mm × 16-row mode. After 6 hours of fasting, 370 MBq of MET was intravenously injected, followed by data acquisition at 20 minutes after the injection. The following acquisition settings were used for 62Cu-ATSM-PET/CT and FDG-PET/CT: 3D data acquisition mode; 180 seconds/bed; field of view, 500 mm; 4 iterations; 14 subsets; matrix size, 128 × 128; 8-mm Gaussian filter, full width at half maximum; and reconstruction, ordered subset expectation maximization. For MET-PET/CT, the following acquisition settings were used: 3D data acquisition mode; 180 seconds/bed; field of view, 300 mm; 4 iterations; 14 subsets; matrix size, 256 × 256; 4-mm Gaussian filter, full width at half maximum; and reconstruction, ordered subset expectation maximization. The estimated internal absorbed doses of 62Cu-ATSM, FDG, and MET were approximately 10, 2.5, and 1.9 mSv, respectively.
MR imaging was performed on a 1.5T system (Magnetom Symphony; Siemens). 3D T1-weighted MR imaging with a MPRAGE sequence was used with the following parameters to acquire axial T1-weighted images after administration of 0.2 mL/kg of Gd-DTPA: field of view, 250 × 250 mm2; matrix size, 512 × 512; TR, 1960 ms; TE, 3.9 ms; TI, 1100 ms; and flip angle, 15°. In total, 120 contiguous 2-mm images were obtained from each patient.
Image Interpretation
Four board-certified nuclear medicine specialists who were unaware of the clinical information assessed the PET images semiquantitatively and volumetrically in consensus (62Cu-ATSM and FDG, U.T. and T.I.; MET, R.M. and T.I.). MR imaging findings were also assessed by board-certified radiologists (U.T. and T.I.), who interpreted the tumors as either GBM or non-GBM gliomas. A volume of interest was outlined within areas of increased tracer uptake and was measured on each section. In extensively heterogeneous lesions, regions of interest covered all components. For semiquantitative interpretations, the standardized uptake value was determined by a standard formula. The tumor/background ratio (T/B ratio) of 62Cu-ATSM and MET was calculated relative to the uptake in the contralateral frontal cortex. The FDG T/B ratio was calculated relative to the uptake in the contralateral white matter. The uptake values of the 62Cu-ATSM, FDG, and MET tracers were determined by assessment of the maximum standardized uptake value (SUVmax) values and T/B ratios.
Dr. View version R 2.5 for LINUX (Infocom, Tokyo, Japan) software was used to merge the PET images with the MR images,4,13,14 and each PET and MR image was volumetrically compared. To evaluate volumetric analysis, we extracted the uptake regions of the 62Cu-ATSM images on the basis of the optimal T/B ratio thresholds of ≥1.8, a cutoff value for predicting hypoxia-inducible factor-1α expression in our previous study.14 The uptake regions of the FDG and MET images were extracted on the basis of the T/B ratio thresholds of ≥1.5 and ≥1.3, respectively, in accordance with previous reports.5,9 These uptake regions were rated as metabolically active volumes. For GBM, we extracted the tumor volume by measuring a completely covered contrast-enhanced region with necrotic and cystic components on MR imaging. The contrast-enhanced volume was also separately extracted by measuring a contrast-enhanced region without any necrotic and cystic components. Metabolically active regions shown by each PET tracer were overlaid on the MR images for qualitatively comparing metabolically active regions among the 3 tracers. Tumors with 62Cu-ATSM–active regions that demonstrated ≤50% volumetric overlap with the active regions of FDG and MET were rated as heterogeneous with respect to intratumoral oxygenation. Correlations among 62Cu-ATSM, FDG, and MET were also volumetrically analyzed. On the basis of the optimal cutoff value for prediction of GBM (T/B ratio, 1.9), which was defined by receiver operating characteristic analysis, tumors having 62Cu-ATSM T/B ratios ≥1.9 were rated as GBM. The optimal cutoff threshold of the MET T/B ratio was set by receiver operating characteristic analysis, and tumors having MET T/B ratios ≥3.0 were rated as GBM. To assess the clinical value of 62Cu-ATSM-PET findings relative to those of MET-PET and MR imaging findings for prediction of GBMs, we evaluated the positive and negative predictive values independently.
Statistical Analysis
All parameters were expressed as means ± SDs. Two-way repeated measures ANOVA was used to compare the mean uptake values of each tracer. To determine the optimal radiotracer for prediction of GBM by semiquantitative analysis, we performed receiver operating characteristic analysis. To evaluate volumetric correlations of 62Cu-ATSM with FDG and MET, we used linear regression analysis. The Wilcoxon signed rank test was used to compare the mean tumor volume, contrast-enhanced volume, and metabolically active volumes determined by the 3 PET tracers. The Fisher exact probability test was used to compare the 62Cu-ATSM-PET with contrast-enhanced MR imaging and MET-PET imaging features. The level of statistical significance was set at P < .05. JMP 10 statistical software (SAS Institute, Cary, North Carolina) was used for statistical analyses.
Results
Semiquantitative Analysis of PET Studies According to Tumor Classification
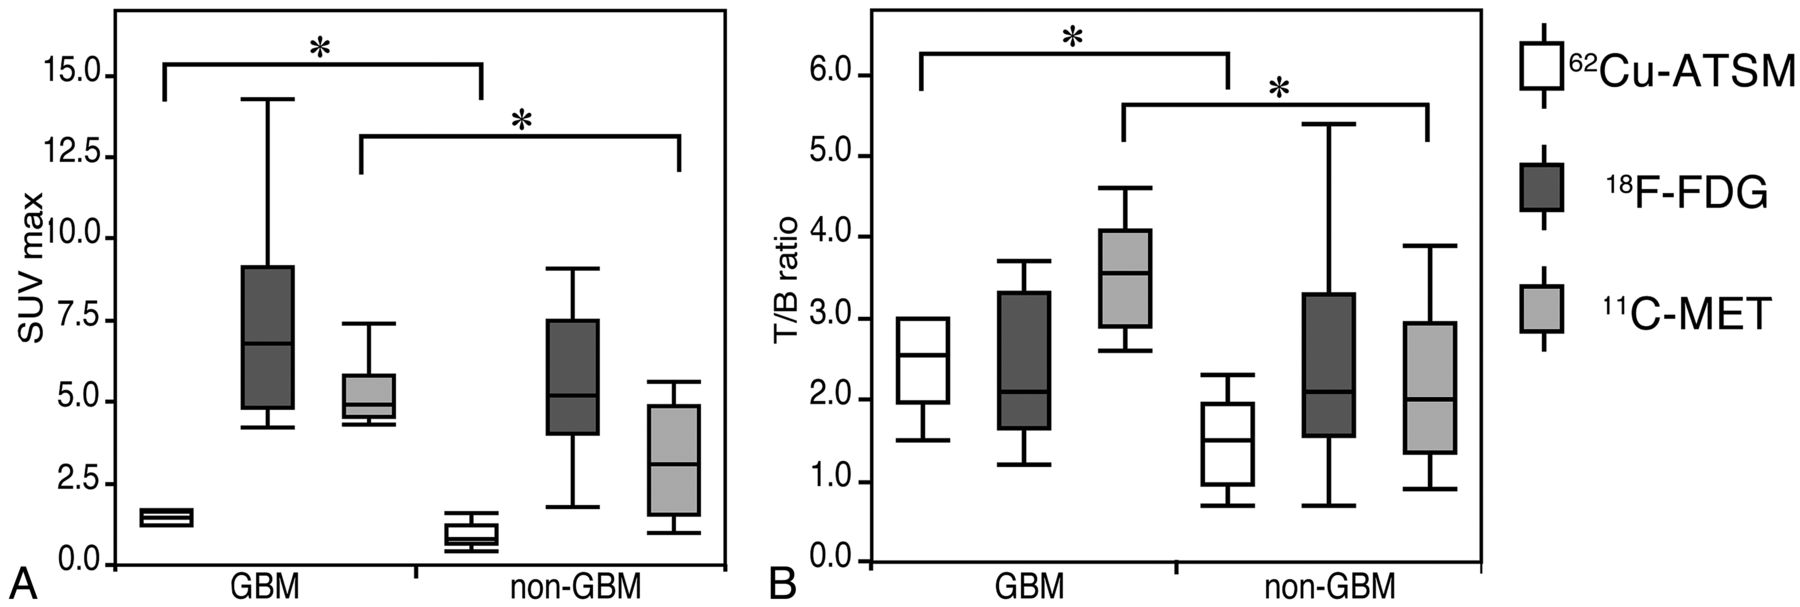
A summary of the uptake values for each PET tracer is presented in On-Line Table 2. Representative images are shown in Fig 1 and in the On-Line Figure. The average 62Cu-ATSM SUVmax values in GBM and non-GBM gliomas were 1.68 ± 0.94 and 0.98 ± 0.52, respectively. The 62Cu-ATSM SUVmax was significantly higher for GBM than for non-GBM gliomas (P = .03; Fig 2A). A significant difference in SUVmax was also detected between GBM and non-GBM gliomas for MET (5.23 ± 1.11 and 3.25 ± 1.66, respectively; P = .02; Fig 2A) but not for FDG (7.31 ± 3.22 and 5.72 ± 2.25, respectively; P = .18; Fig 2A).
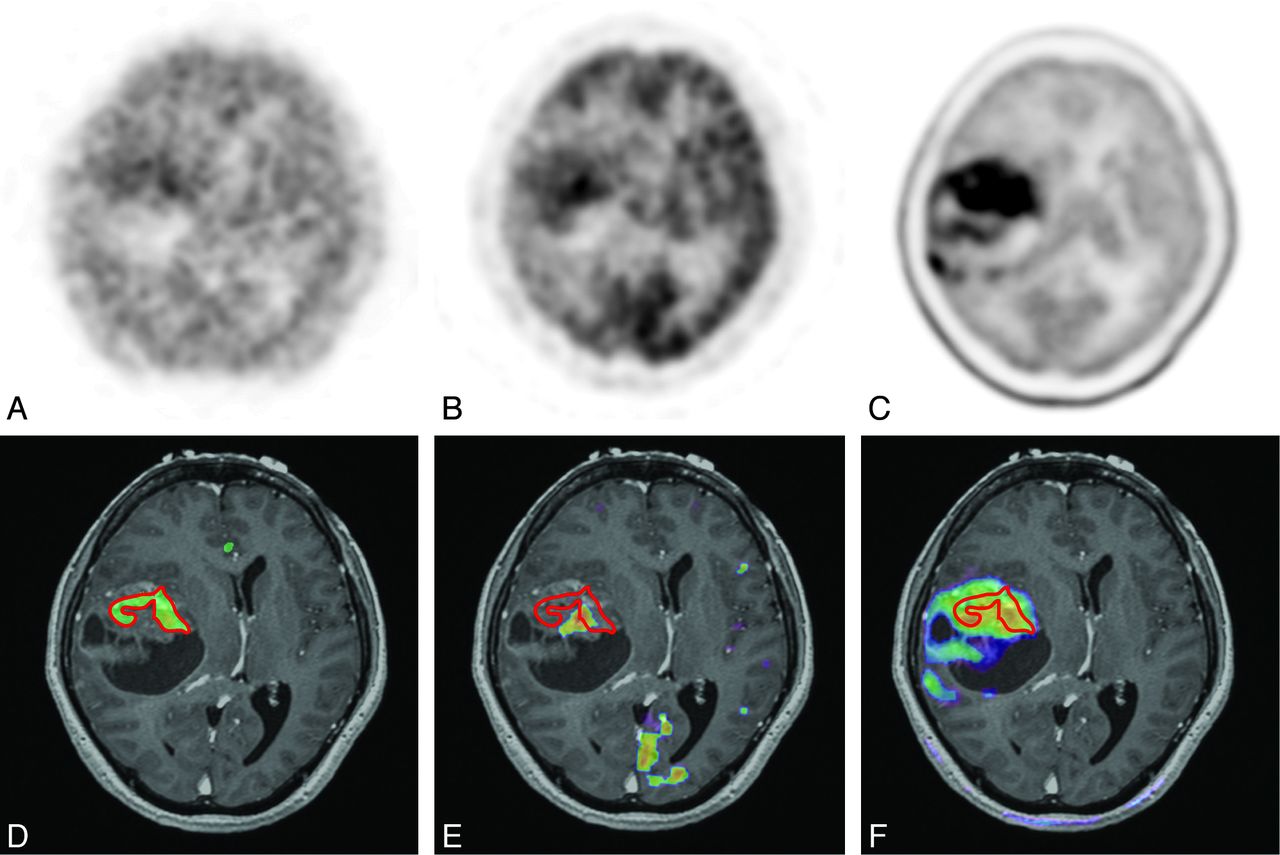
Case 21. A 59-year-old woman with GBM in the right temporal lobe (tumor volume, 79.6 cm3). PET images of 62Cu-ATSM (A), FDG (B), and MET (C) are shown; the 62Cu-ATSM–active regions are outlined by red lines (D–F, respectively). 62Cu-ATSM-PET/MR imaging fusion image (D) showing the intratumoral hypoxic region (11.8 cm3), which is less than that of the contrast-enhanced volume (30.9 cm3). FDG-PET/MR imaging fusion image (E) also indicating the intratumoral active region (4.6 cm3), which is heterogeneously distributed compared with the 62Cu-ATSM–active region. MET-PET/MR imaging fusion image (F) showing the more extensive active region (73.1 cm3), which completely covered the 62Cu-ATSM–active regions.

Boxplots comparing uptake values between GBM and non-GBM gliomas. The 62Cu-ATSM and MET SUVmax values show significant differences (P = .03 and P = .02); however, FDG SUVmax values are not significantly different (P = .18; A). The 62Cu-ATSM and MET T/B ratios also show significant differences (P = .03 and P = .01), but no significant difference is observed in the FDG T/B ratio (P = .65; B). *P < .05.
The mean 62Cu-ATSM T/B ratios in GBM and non-GBM gliomas were 3.10 ± 2.37 and 1.47 ± 0.57, respectively, which were also significantly different (P = .03; Fig 2B). Receiver operating characteristic analysis indicated that a 62Cu-ATSM T/B ratio cutoff threshold of 1.9 was most predictive of GBM, with 90.0% sensitivity and 76.9% specificity (area under the curve, 0.88). Similar to the SUVmax results, there was a significant difference in the T/B ratio between GBM and non-GBM gliomas for MET (3.53 ± 0.70 and 2.27 ± 0.97, respectively; P = .01; Fig 2B) but not for FDG (2.71 ± 1.56 and 2.44 ± 1.28, respectively; P = .65; Fig 2B). Receiver operating characteristic analysis showed an optimal T/B ratio of 3.0 for MET (sensitivity, 83.3%; specificity, 76.9%; area under the curve, 0. 83, respectively), which was slightly less than that for 62Cu-ATSM.
Volumetric and Qualitative Comparison among 3 Tracers in GBM
A summary of tumor volume and contrast-enhanced volume on MR imaging and the active volume for each PET tracer is presented in On-Line Table 3. Table 1 shows the relationships of the metabolically active volumes in GBM: for 62Cu-ATSM (T/B ratio ≥1.8), FDG (T/B ratio ≥1.5), and MET (T/B ratio ≥1.3); the volumes were 8.2 ± 14.0, 11.0 ± 12.0, and 38.0 ± 19.0 cm3, respectively. The mean active volume of 62Cu-ATSM in GBM was not significantly different from that of FDG (P = .63) but was significantly less than that of MET (P = .03). In addition, the active volume of 62Cu-ATSM in GBM correlated significantly with that of FDG (r = 0.68, P = .03) and MET (r = 0.87, P = .03). However, compared with the active regions of FDG and MET, those of 62Cu-ATSM were heterogeneously distributed (≤50% volumetric overlap with the active regions of FDG and MET) in 50% (5/10) and 0% (0/6) of the tumors with metabolically active regions, respectively. The 62Cu-ATSM–active regions were fully covered within the MET-active regions in all cases.
Volumetric correlation of 62Cu-ATSM with FDG and MET in GBM
Volumetric Comparison with MR Imaging
The mean tumor volume and contrast-enhanced volume in GBMs were 45.4 ± 26.5 and 21.6 ± 14.3 cm3, respectively (Table 2), which were significantly greater than those of the metabolically active volumes for 62Cu-ATSM (P = .002 and P = .002, respectively) and FDG (P = .002 and P = .006, respectively). The mean active volume of MET was not significantly different from the mean tumor volume (P = .56) and contrast-enhanced volume (P = .06).
Volumetric comparison of radiotracers in MRI for GBM
Predictive Values of 62Cu-ATSM-PET, MET-PET, and MR Imaging for Distinguishing GBM
In 19 newly diagnosed gliomas, tumors having 62Cu-ATSM–active regions and strongly contrast-enhanced regions on MR imaging were detected in 63.2% (12/19) and 57.9% (11/19), respectively. No statistical correlation was observed between the 2 modalities (P = .07). The positive predictive values of 62Cu-ATSM and MR imaging for distinguishing GBM were 75.0% and 72.7%, respectively. In contrast, the negative predictive values of 62Cu-ATSM and MR imaging were 85.7% and 75.0%, respectively. On the other hand, when tested by the optimal cutoff threshold on MET (T/B ratio, 3.0), the positive and negative predictive values for a diagnosis of GBM were 83.3% and 60.0%, respectively. We found no significant correlation between 62Cu-ATSM and MET (P = .59).
Discussion
Our present PET study demonstrated that 62Cu-ATSM is a predictive radiotracer for GBM. Many clinical PET studies with FDG and MET have been conducted to discriminate among World Health Organization grades of gliomas.4,5,7,8 Several imaging studies have demonstrated the usefulness of FDG-PET in the differentiation between low-grade and high-grade gliomas and even between grade III and grade IV gliomas.5,7,8 Because of the associated increased glucose uptake and high rates of glycolysis, FDG-PET shows high FDG uptake in GBM.8 However, FDG-PET has a low signal-to-noise ratio in brain tumors, which is a result of the high glucose metabolism in normal brain tissue.4 Moreover, because FDG uptake reflects an increased glycolytic rate in rapidly growing brain tumor cells even in grade II and III gliomas,7,12 it may not be a suitable radiotracer to predict GBM. On the other hand, malignant gliomas demonstrate increased rates of amino acid uptake and metabolism. MET readily crosses the intact BBB through a neutral amino acid transporter and is incorporated into active tumor areas, which allows tumor visualization even in low-grade gliomas.9
In our current study, MET-PET revealed a significant difference between GBM and non-GBM despite the high frequency of oligodendroglial tumors. However, these oligodendroglial tumors are reported to show relatively high uptake of MET irrespective of their grade on MET-PET,3,4 which is not yet established as a standard imaging technique for a diagnosis of GBM. Recently, another technique, hypoxic imaging, has been used clinically and may be another diagnostic tool to discriminate GBM from non-GBM gliomas because poor microcirculation with respect to metabolic demand induces relative tissue hypoxia and necrosis, a cardinal feature of GBM.10
Hypoxic PET studies with [18F]fluoromisonidazole and 62Cu-ATSM have demonstrated their usefulness separately in hypoxic imaging. Under hypoxic conditions, 62Cu-ATSM retention is induced by microsomal cytochrome reductase enzymes, which is different from [18F]fluoromisonidazole retention by mitochondrial nitroreductase enzymes.17 Cu-ATSM was developed as a radiotracer to detect regional hypoxia in the ischemic myocardium and hypoxic tissues in tumors,18,19 and its image contrast may be greater than that of [18F]fluoromisonidazole, because Cu-ATSM has rapid blood clearance and is retained in hypoxic tissues with a high hypoxic/normoxic tissue-to-activity ratio.20 On the other hand, [18F]fluoromisonidazole can detect a wider range of partial oxygen tension values than 61Cu-ATSM.17 Experimental investigations with glioma models have demonstrated that 61,64,67Cu-ATSM uptake correlates with tissue hypoxia.19 Our preliminary clinical study also showed that 62Cu-ATSM uptake values correlated highly with hypoxia-inducible factor-1α expression, which is a biomarker of tissue hypoxia,14 and the optimal cutoff threshold to predict hypoxia-inducible factor-1α expression (T/B ratio, 1.8) was similar to that of our present study in the prediction of GBM (T/B ratio, 1.9). It has been well established that overexpression of hypoxia-inducible factor-1α, a transcription factor that is part of the stress response mechanism, is initiated in the presence of low oxygen tensions and induces hypoxia-regulated molecules, such as vascular endothelial growth factor, glucose transporters, and carbonic anhydrase IX,21 which correlate with treatment resistance and are highly expressed in GBM.10 Therefore, 62Cu-ATSM-PET may be a radiotracer useful in the identification of treatment-resistant hypoxic regions in patients with glioma. Our present study also demonstrated that hypoxic imaging by use of 62Cu-ATSM for discrimination of GBM from non-GBM gliomas may be as effective as [18F]fluoromisonidazole,12 indicating that hypoxic imaging, including 62Cu-ATSM, would be a better choice than FDG in the prediction of GBM.
However, to our knowledge, correlations between hypoxic regions depicted by PET studies and high-uptake regions in FDG or MET have not been precisely studied in GBM. In our present study, we showed that 62Cu-ATSM uptake in GBM correlates significantly with FDG by volumetric assessments, but half of the uptake regions were distributed heterogeneously. Under hypoxia, glycolysis is increased by hypoxia-inducible factor-1α activation,21 whereas in malignant tumor cells, aerobic glycolysis is driven even under nonhypoxic conditions.2 Therefore, FDG uptake might indirectly and partially reflect hypoxic regions as well as nonhypoxic regions.22
In line with these observations, several clinical studies on lung and cervical cancers have directly compared 62Cu-ATSM-PET with FDG-PET and suggested that intratumoral distribution and uptake values may be different, depending on the histopathologic type of the tumor.15,23 In addition, a previous study using a lung cancer model demonstrated that 64Cu-ATSM was predominantly accumulated in hypoxic and quiescent tumor cells, a finding that differs from the FDG distribution with features of high proliferation.24 In accordance with these findings, a hypoxic imaging study by use of [18F]fluoromisonidazole revealed a positive relationship but not a precisely matched uptake to that of FDG in gliomas,11 which seems to be similar to the results of our present study. These findings imply that the positive relationship between FDG-PET and hypoxic-PET may indicate increased glycolysis, glucose uptake, and hypoxia in GBM. In contrast, the parts of hypoxic regions not shown on FDG-PET might indicate severe ischemia and hypoxia where glucose delivery is also severely disturbed, an idea that should be explored in future investigations.
In contrast, no PET study has compared 62Cu-ATSM and MET. Our present study showed that MET had larger active volumes than did 62Cu-ATSM in GBM, which was fully covered within MET-active regions. There was also a significant volumetric correlation between 62Cu-ATSM and MET. A volumetric correlation of MET-PET–delineated regions with hypoxic PET by [18F]fluoromisonidazole has also been documented,13 which corroborates our results. However, it is not clear why hypoxic regions delineated by 62Cu-ATSM not depicted by FDG-PET still show high MET uptake. If disturbance of substrate delivery such as that of glucose is the mechanism leading to FDG-PET–negative hypoxic regions, MET delivery should also be disturbed. Multifactorial effects of tracer kinetics, such as a switch from a metabolic to a catabolic state in hypoxic tumor cells,25 as well as a threshold setting, would cause this discrepancy in complex and heterogeneous GBMs.
From a clinical point of view, MET-PET enables more accurate delineation of glioma extension than MR imaging,6,9 suggesting that MET is a practical radiotracer for the detection of infiltrative regions around contrast-enhanced regions on MR imaging, which can provide important clinical information for treatment. By combining 62Cu-ATSM- and MET-PET imaging, delineation of hypoxic regions within MET-PET–active regions would provide additional value to delineate therapeutic targets as treatment-resistant hypoxic regions for more intensive therapy (ie, intensity-modulated radiation therapy and chemotherapy by use of convection-enhanced delivery as well as biopsy targets in GBM). However, the hypoxic mechanism is not fixed in time, and variability in spatial uptake can occur among repeated PET scans.26 Therefore, it is crucial for PET imaging to elucidate the mechanism of changes in intratumoral radiotracer distribution as a clinical application. In addition, to confirm the differences among 62Cu-ATSM, FDG, and MET in GBM, further precise metabolic evaluation within GBM is required.
Among these available imaging modalities, it is not clear which is best for distinguishing GBM from non-GBM. Contrast enhancement on MR imaging might provide a simple index; however, it is sometimes ambiguous.27 To compare diagnostic reliability, we compared positive and negative predictive values for MR imaging, MET-PET, and 62Cu-ATSM-PET and showed that for the prediction of GBM, both were higher in 62Cu-ATSM than in MR imaging, indicating that 62Cu-ATSM-PET is a better imaging technique for the prediction of GBM than is MR imaging. In addition, the negative predictive value was also higher for 62Cu-ATSM-PET (85.7%) vs MET-PET (60.0%), though the positive values were lower. This finding would suggest that combined assessment by use of 62Cu-ATSM and MET may provide a more accurate diagnosis. However, because of the small number of patients in our present study, further clinical evaluation in a larger group of patients is required to confirm these hypotheses.
Study Limitations
One of the limitations of our study was that it is unknown how BBB disruption affects 62Cu-ATSM kinetics. To gain some insight, we demonstrated that the 62Cu-ATSM–active volumes in GBM were significantly less than those of the contrast-enhanced volumes on MR imaging, which are dependent on BBB breakdown accompanying neovascularization in gliomas.6 Thus, it is suggested that 62Cu-ATSM uptake would be determined by other factors in addition to BBB breakdown. Indeed, it has been shown that the oxygen pressure in GBM is relatively lower than the pressure in the surrounding cortex.28 Thus, 62Cu-ATSM is likely to be a tracer that reflects part of the hypoxic region. Further clinical validation of the relationship between 62Cu-ATSM uptake and tissue oxygen tension is required to determine the precision of hypoxic imaging.
In addition, our present study may have been affected by several biases, including threshold settings and MET-PET not being performed in all cases. Moreover, no published studies have compared 62Cu-ATSM and [18F]fluoromisonidazole for clinical use. Finally, 62Cu-ATSM is rarely applicable for every institution because of limited radionuclide production. Nonetheless, multiple PET imaging by use of 62Cu-ATSM, FDG, and MET may provide complementary valuable intratumoral metabolic information, all of which is important in the establishment of targeted therapeutic strategies for patients with GBM.
Conclusions
The results of our study suggest that 62Cu-ATSM-PET is predictive of GBM. In addition to the information obtained by FDG-PET, MET-PET, and MR imaging, 62Cu-ATSM-PET may provide intratumoral hypoxic information useful in establishing targeted therapeutic strategies for patients harboring GBM.
Acknowledgments
We thank Tsuneo Saga, Masayuki Inubishi, Toshimitsu Fukumura, and Yasuhisa Fujibayashi of the Diagnostic Imaging and Molecular Probe Groups, Molecular Imaging Center, National Institute of Radiologic Sciences, Chiba, Japan; Hidehiko Okazawa of the Department of Radiology, Biomedical Imaging Research Center, Faculty of Medical Sciences, University of Fukui, Fukui, Japan; and Hirofumi Fujii, Functional Imaging Division, Research Center for Innovative Oncology, National Cancer Center Hospital East, Chiba, Japan, for their assistance.
Footnotes
Disclosures: Satoshi Nakanowatari—RELATED: Grant: Grant-in-Aid for Scientific Research from the Japan Society for the Promotion of Sciences (No. 24791515).* Nobutaka Kawahara—RELATED: Grant: Ministry Eduction, Culture, Sports, Science and Technology,* Comments: This grant is a public research grant offered from the Government. *Money paid to institution.
This work was supported by Japan Advanced Molecular Imaging Program (J-AMP) of the Ministry of Education, Culture, Sports, Science and Technology (MEXT), Japan, and was partly funded by a Grant-in-Aid for Scientific Research from the Japan Society for the Promotion of Sciences (No. 24791515).
Indicates open access to non-subscribers at www.ajnr.org
References
- Received April 3, 2013.
- Accepted after revision June 2, 2013.
- © 2014 by American Journal of Neuroradiology


