
Abstract
BACKGROUND AND PURPOSE: Preoperative identification of plaque vulnerability may allow improved risk stratification for patients considered for carotid endarterectomy. The present study aimed to determine which plaque imaging technique, cardiac-gated black-blood fast spin-echo, magnetization-prepared rapid acquisition of gradient echo, source image of 3D time-of-flight MR angiography, or noncardiac-gated spin-echo, most accurately predicts development of microembolic signals during exposure of carotid arteries in carotid endarterectomy.
MATERIALS AND METHODS: Eighty patients with ICA stenosis (≥70%) underwent the 4 sequences of preoperative MR plaque imaging of the affected carotid bifurcation and then carotid endarterectomy under transcranial Doppler monitoring of microembolic signals in the ipsilateral middle cerebral artery. The contrast ratio of the carotid plaque was calculated by dividing plaque signal intensity by sternocleidomastoid muscle signal intensity.
RESULTS: Microembolic signals during exposure of carotid arteries were detected in 23 patients (29%), 3 of whom developed new neurologic deficits postoperatively. Those deficits remained at 24 hours after surgery in only 1 patient. The area under the receiver operating characteristic curve to discriminate between the presence and absence of microembolic signals during exposure of the carotid arteries was significantly greater with nongated spin-echo than with black-blood fast spin-echo (difference between areas, 0.258; P < .0001), MPRAGE (difference between areas, 0.106; P = .0023), or source image of 3D time-of-flight MR angiography (difference between areas, 0.128; P = .0010). Negative binomial regression showed that in the 23 patients with microembolic signals, the contrast ratio was associated with the number of microembolic signals only in nongated spin-echo (risk ratio, 1.36; 95% confidence interval, 1.01–1.97; P < .001).
CONCLUSIONS: Nongated spin-echo may predict the development of microembolic signals during exposure of the carotid arteries in carotid endarterectomy more accurately than other MR plaque imaging techniques.
ABBREVIATIONS:
- AUC
- area under the receiver operating characteristic curve
- BB-FSE
- black-blood fast spin-echo
- CEA
- carotid endarterectomy
- CR
- contrast ratio
- MES
- microembolic signals
- ROC
- receiver operating characteristic
- SE
- spin-echo
- SI-MRA
- source image of 3D time-of-flight MR angiography
- TCD
- transcranial Doppler
For appropriately selected patients, carotid endarterectomy (CEA) can effectively prevent stroke,1⇓–3 with few neurologic deficits observed immediately following the procedure. Surgical site embolism represents >70% of intraoperative procedure-related strokes.4 When one monitors the middle cerebral artery by using intraoperative transcranial Doppler (TCD), microembolic signals (MES) are detected in >90% of patients undergoing CEA4⇓–6; however, the quality and quantity of MES detected depends on the stage of CEA.5⇓–7 During exposure procedures for the carotid arteries, plaque that represents a source of emboli and has not been removed remains exposed to blood flow. Under such conditions, manipulation of the carotid arteries can dislodge emboli from the surgical site into the intracranial arteries.8 Furthermore, because the target vessel remains closed during the exposure procedure, detectable MES are thought to represent solid masses, such as thrombi, necrosis, or lipid.6 In contrast, once the walls of the carotid arteries are cut for endarterectomy, a high number of harmless gaseous MES may develop during carotid declamping due to air entering the lumen of the arteries.6,9 Detection of MES during the exposure procedure has been shown to correlate with postoperative neurologic deficits immediately after CEA.5⇓–7,9⇓–11
Several investigators have compared MES during the exposure procedure for the carotid arteries in CEA with histopathologic findings of excised carotid plaque and have demonstrated that development of the MES was strongly associated with vulnerable carotid plaques consisting primarily of intraplaque hemorrhage and/or intraluminal thrombus.12,13 Intraplaque hemorrhage might cause formation of intraluminal thrombus likely due to chemical mediators, increased stenosis, or changes in eddy currents, though the associations among these remain unclear. Other research has shown that more cerebrovascular adverse events related to CEA occurred in patients with atheromatous plaques compared with patients with fibrous plaques.9 Preoperative identification of plaque vulnerability may thus allow improved risk stratification for patients considered for CEA.
Intraplaque characteristics are generally assessed by using MR imaging based on T1-weighted sequences,14 and the detection of intraplaque hemorrhage on preoperative MR imaging is associated with the development of MES during the procedure for exposure of the carotid arteries.12 However, there has been inconsistency among published findings on vulnerable plaques.15 This could be due to interinstitutional differences in the methodology for such imaging techniques as cardiac-gated black-blood fast spin-echo (BB-FSE),16⇓⇓–19 magnetization-prepared rapid acquisition of gradient echo,12,20⇓–22 source image of 3D time-of-flight MR angiography (SI-MRA),23 and noncardiac-gated spin-echo (SE).15,24,25 Although the cardiac-gated BB-FSE method is most commonly used for T1-weighted MR plaque imaging,17,18 the TR is dependent on a single R-R interval from electrocardiography, which occasionally results in an overly long TR to diminish proton density–weighted contrast and to enhance T1-weighted contrast.25
In addition to cardiac gating, proton density–weighted contrast is preserved when using T1-weighted spoiled gradient-echo techniques, which are generally used for MRA.23 The use of T1-weighted spoiled gradient-echo techniques on SI-MRA could result in insufficient contrast between fibrous and lipid/necrotic plaques.15 Originally developed for direct thrombus imaging, MPRAGE is a modified sequence in which the TI is set to permit black-blood effects.21 Because the signal intensity of the lipid/necrotic component tends to show T1 values similar to those of blood, the intensity can theoretically be attenuated.15 The substantial influence of the proton density and inversion recovery pulse can be avoided in nongated SE; however, this sequence requires a relatively long acquisition time and is known to be susceptible to patient motion even when motion correction is used.15 Among these 4 kinds of imaging techniques, substantial variation is observed in the contrast provided by T1-weighted MR plaque imaging and its ability to characterize intraplaque components. Furthermore, quantitative color-coded MR plaque imaging performed by using the nongated SE sequence has recently been shown to provide accurate evaluation of the composition (ie, fibrous tissue, lipid/necrosis, or hemorrhage) of excised carotid plaques compared with histopathologic findings in patients undergoing CEA.26
The purpose of the present study was thus to determine which plaque imaging technique, BB-FSE, MPRAGE, SI-MRA, or nongated SE, all of which are variations of T1-weighted imaging, can most accurately predict development of MES during exposure of the carotid arteries in CEA.
Materials and Methods
Study Design
The present study was designed as prospective observational research. This protocol was reviewed and approved by the institutional ethics committee, and written informed consent was obtained from all patients or their next of kin before participation.
Patient Selection
The present study included patients with ipsilateral ICA stenosis ≥70% as per the below-mentioned method and useful residual function (modified Rankin Scale score, 0–2) who underwent CEA of the carotid bifurcation in our institution. Patients who did not undergo any of the 4 kinds of MR plaque imaging preoperatively were excluded. Patients without reliable TCD monitoring throughout the entire operation because of failure to obtain an adequate bone window were also excluded from analysis.
Angiography and Data Processing
All patients underwent angiography with arterial catheterization, and the degree of ICA stenosis was determined by using the North American Symptomatic Carotid Endarterectomy Trial criteria3 and was based on the comment of Fox et al27 as follows: Distal ICA was measured beyond the bulb, where the walls are parallel and no longer tapering. To prevent underestimation of the percentage stenosis for the distal ICA with reduced axial diameter due to near-occlusion, if the diameter of the coaxial section of the distal ICA was at least 80% smaller than the diameter on the contralateral side, we substituted the diameter of the contralateral distal ICA for calculating the degree of stenosis of the affected ICA. If the contralateral ICA was occluded or stenotic (>70%) and the diameter of the distal ICA on the affected side was less than the diameter of the distal external carotid artery, the diameter of the distal external carotid artery was substituted for calculating the degree of stenosis of the affected ICA.
The length of the ICA stenotic lesion was measured, and the height of the distal end of the lesion relative to the cervical vertebra was determined in the lateral view on angiography. The inflection point was also defined as the center of stenotic lesion curvature. Lesion tortuosity was defined as the angle formed by the 2 tangential lines drawn on the ICA side and the common carotid artery side starting from the inflection point, by using the anteroposterior or lateral view on angiograms in which the curvature in the stenosis of the carotid artery was most visible.28 A stenotic lesion was classified as having ulceration when it fulfilled the radiographic criteria for an ulcer niche, seen in profile as a crater penetrating a stenotic lesion in any projection on angiography.29
Pre-, Intra-, and Postoperative Management
All patients received antiplatelet therapy until the morning of the day CEA was performed and underwent the operation under general anesthesia by a single senior neurosurgeon using an operative microscope from the skin incision. This neurosurgeon was blinded to the findings on MR plaque imaging. The senior neurosurgeon has experienced approximately 600 CEAs as an operator for 15 years. Dissection of the carotid sheath and exposure of the carotid arteries were routinely performed as follows30: The upper plane of the carotid sheath surrounding the common carotid artery was first cut with scissors; next, the other planes of the carotid sheath were bluntly separated from the common and external carotid arteries and the ICA with Pean forceps. Scissors were used when the carotid sheath adhered to carotid arteries. The surgeon and surgical assistants were blinded to intraoperative TCD findings and consistently proceeded with surgical procedures regardless of these findings. A patient was prospectively defined as having adhesions during carotid exposure when scissors were required throughout the dissection of the carotid sheath and exposure of the carotid arteries.30
During exposure of the carotid arteries, attempts were made to keep the increase in systolic blood pressure at least +10% above the preoperative value.31 If needed, a vasodilator (nitroglycerin or nicardipine) or a vasoconstrictor (adrenalin) was administered intravenously. No intraluminal shunt or patch graft was used in these procedures. A bolus of heparin (5000 IU) was administered before ICA clamping.
All patients were neurologically tested immediately before induction of general anesthesia and after recovery from general anesthesia by a neurologist who was blinded to patient clinical information, including intraoperative findings such as the presence or absence of MES; and the presence or absence of new postoperative neurologic deficits was recorded.
Another senior neurosurgeon blinded to the clinical and imaging findings of patients retrospectively reviewed videos recorded through an operative microscope from skin incision to carotid declamping and determined the degree of stress on the carotid arteries occurring with manipulation.
MR Plaque Imaging and Data Processing
MR plaque imaging of the affected carotid bifurcation was performed within 1 week before CEA by using a 1.5T MR imaging scanner (Echelon Vega; Hitachi Medical, Tokyo, Japan) and an 8-channel neurovascular coil under the same imaging protocol described previously.15 This scanner can image BB-FSE, MPRAGE, SI-MRA, and nongated SE in a single imaging session.15 The section direction was carefully set as perpendicular to the long axis of the carotid bifurcation on the sagittal 2D phase-contrast MR angiography, the section for BB-FSE was set at the location of most severe stenosis, and the midsections of MPRAGE, SI-MRA, and nongated SE were set at a location identical to that for BB-FSE.
Data processing was performed by one of the authors blinded to the clinical and imaging findings except the side on which CEA was performed. First, signal intensities of the carotid plaque and adjacent sternocleidomastoid muscle for the side on which CEA was performed were measured for the section in which the 4 kinds of images were obtained. ROIs were manually traced on a liquid crystal display by using the polygon cursor of a free software package (zioTerm2009; Ziosoft, Tokyo, Japan). Each signal-intensity value was obtained, and the contrast ratio (CR) of the carotid plaque was calculated by dividing the plaque signal intensity by the muscle signal intensity.15
Second, nongated SE plaque image data from the DICOM files for the same section used in the first study were transferred to a plaque analysis software package (PlaqueViewer; Hitachi Medical). For the side on which CEA was performed, the software automatically divided internal areas of the plaques into 3 color-coded components (fibrous tissue, green; lipid/necrosis, yellow; and hemorrhage, red) according to the CRs of the plaques, with cutoff values of 1.17 (fibrous tissue versus lipid/necrosis) and 1.55 (lipid/necrosis versus hemorrhage) as obtained from previous studies.24,26 Next, percentage areas of each component were automatically calculated (Hemorrhage + Lipid / Necrosis + Fibrous Tissue = 100%).
TCD Monitoring
TCD was performed by using an EME Pioneer TC2020 system (Nicolet Vascular, Golden, Colorado; software Version 2.50) (probe, 2 MHz; diameter, 1.5 cm; insonation depth, 40–66 mm; scale, −100 and +150 cm/s; sample volume, 2 mm; 64-point fast Fourier transform; fast Fourier transform length, 2 mm; fast Fourier transform overlap, 60%; high-pass filter, 100 Hz; detection threshold, 9 dB; minimum increase time, 10 ms) for insonation of the MCA ipsilateral to the carotid artery undergoing CEA. TCD data were stored on a hard disk by using a coding system and were later analyzed manually by a clinical neurophysiologist who was blinded to patient information. MES were identified during exposure of the carotid arteries (from skin incision until ICA clamping) according to the recommended guidelines.32
Statistical Analysis
Data are expressed as the mean ± SD. We used receiver operating characteristic (ROC) curves to assess the accuracy of the CR and percentage area in predicting the development of MES during exposure of the carotid arteries. Pair-wise comparisons of the area under the receiver operating characteristic curve (AUC) for each MR image or the percentage area of each component were performed as proposed by Pepe and Longton.33 A negative binomial model was fitted to investigate the relationship between the CR in each MR plaque sequence and the number of MES only in patients with MES during exposure of the carotid arteries. The relationship between each variable and the development of MES during exposure of the carotid arteries was evaluated with univariate analysis by using the Mann-Whitney U or χ2 test. Multivariate statistical analysis of factors related to the development of MES during exposure of the carotid arteries was performed by using logistic regression modeling. Variables showing values of P < .2 in univariate analyses were entered into the final model. For all statistical analyses, significance was set at the P < .05 level, with the exception of the pair-wise comparison followed by the Bonferroni inequality correction for those differences deemed statistically significant at the level of P < .05/6 = .0083 (AUC for the MR image) or P < .05/3 = .0167 (AUC for percentage area of the component).
Results
During the 20 months of the study, 93 patients satisfied the inclusion criteria. Of these, 2 patients who underwent urgent CEA due to crescendo transient ischemic attacks did not undergo all 4 kinds of MR plaque imaging. The remaining 91 patients successfully underwent all 4 kinds of MR plaque imaging and subsequent CEA. TCD was attempted in all 91 patients, but 11 patients did not show reliable TCD monitoring throughout the entire operation because of failure to obtain an adequate bone window. These 13 patients were excluded from analysis. Eighty patients were thus enrolled in the present study.
MES were detected in 23 of the 80 patients (29%) studied when the ICA was manipulated to allow exposure from the carotid sheath. Three (13%) of the 23 patients developed new neurologic deficits after recovery from general anesthesia. All deficits included hemiparesis contralateral to the CEA. Those deficits resolved completely within 12 hours in 2 patients. However, neurologic deficits in the remaining patient remained at 24 hours after the operation. None of the 57 patients without MES during exposure of the carotid arteries developed new neurologic deficits postoperatively.
Figures 1 and 2 show the relationship between the CR with each MR plaque imaging technique and the development of MES during exposure of the carotid arteries and the ROC curves for the former in predicting the latter, respectively. AUCs for nongated SE, MPRAGE, SI-MRA, and BB-FSE were 0.821, 0.715, 0.693, and 0.567, respectively. The AUC was significantly greater for nongated SE than for MPRAGE (difference between areas, 0.106; P = .0023), SI-MRA (difference between areas, 0.128; P = .0010), or BB-FSE (difference between areas, 0.258; P < .0001). No significant differences between the AUCs of other combinations (BB-FSE versus MPRAGE: difference between areas, 0.148 and P = .0341; BB-FSE versus SI-MRA: difference between areas, 0.132 and P = .0955; MPRAGE versus SI-MRA: difference between areas, 0.022 and P = .4124) were observed.

The relationship between contrast ratio from each MR sequence for plaque imaging and the development of microembolic signals during exposure of the carotid arteries. Dashed horizontal lines denote the cutoff points lying closest to the left upper corners of the receiver operating characteristic curves in predicting the development of MES during exposure of the carotid arteries. The horizontal line denotes the cutoff points lying closest to the left upper corners of the ROC curve in predicting the development of ≥6 MES during exposure of the carotid arteries.

ROC curves used to compare accuracy among contrast ratios in each MR image for predicting the development of MES during exposure of the carotid arteries. Pair-wise comparison analysis shows a significantly greater area under the ROC curve for nongated SE compared with AUCs for BB-FSE, MPRAGE, or SI-MRA.
Sensitivity, specificity, and positive- and negative-predictive values for CR at the cutoff point lying closest to the left upper corner of the ROC curve in predicting development of MES during exposure of the carotid arteries were 100%, 49%, 44%, and 100% (cutoff point = 1.155) for nongated SE; 48%, 97%, 85%, and 82% (cutoff point = 1.876) for MPRAGE; 44%, 95%, 77%, and 81% (cutoff point = 1.977) for SI-MRA; and 100%, 19%, 33%, and 100% (cutoff point = 0.874) for BB-FSE, respectively (Figs 1 and 2).
Figure 3 shows comparisons of CR for the 4 kinds plaque imaging and the number of MES in 23 patients with MES during exposure of the carotid arteries. Negative binomial regression showed no effect of CR for BB-FSE, MPRAGE, or SI-MRA on the number of MES. However, CR for nongated SE had a significant association with the number of MES: For every 1.0 increase in CR for nongated SE, the expected MES count increased by a factor of 1.36 (95% confidence interval, 1.01–1.97; P < .001). Sensitivity, specificity, and positive- and negative-predictive values for CR on nongated SE at the cutoff point lying closest to the left upper corner of the ROC curve in predicting the development of ≥6 MES34 during exposure of the carotid arteries were 100%, 74%, 27%, and 100% (cutoff point = 1.600), respectively (Figs 1 and 2).

Comparisons of contrast ratios in each MR image and the number of MES in patients with MES during exposure of the carotid arteries. In negative binominal regression analysis, CR was associated with the number of MES only in nongated SE. The dashed horizontal line denotes 6 MES as the optimal cutoff point for predicting the development of new postoperative ischemic events.34
Results of univariate analysis of factors related to the development of MES during exposure of the carotid arteries are summarized in the Table. The incidences of symptomatic lesions and ulceration of stenotic lesions were significantly higher in patients with MES than in those without. No other variables showed significant associations with the development of MES during exposure of the carotid arteries. None of the 80 patients studied was defined as having adhesions during carotid exposure. Although the degree of stress on carotid arteries by manipulation could not be categorized, this degree was determined to be equivalent among patients.
Risk factors related to the development of MES during exposure of the carotid arteries
For multivariate statistical analysis of factors related to the development of MES during exposure of the carotid arteries, symptomatic lesions and ulceration of the stenotic lesion were adopted as confounders in the logistic regression model, as items showing P < .2 in univariate analyses. The CR in nongated SE, for which the AUC in predicting development of MES during exposure of the carotid arteries was greatest among the 4 kinds of MR plaque imaging, was also added as a confounder. Analysis revealed that symptomatic lesions (95% CI, 1.10–21.53; P = .0375) and CR in nongated SE (95% CI, 4.13–90.91; P = .0002) were significantly associated with the development of MES during exposure of the carotid arteries.
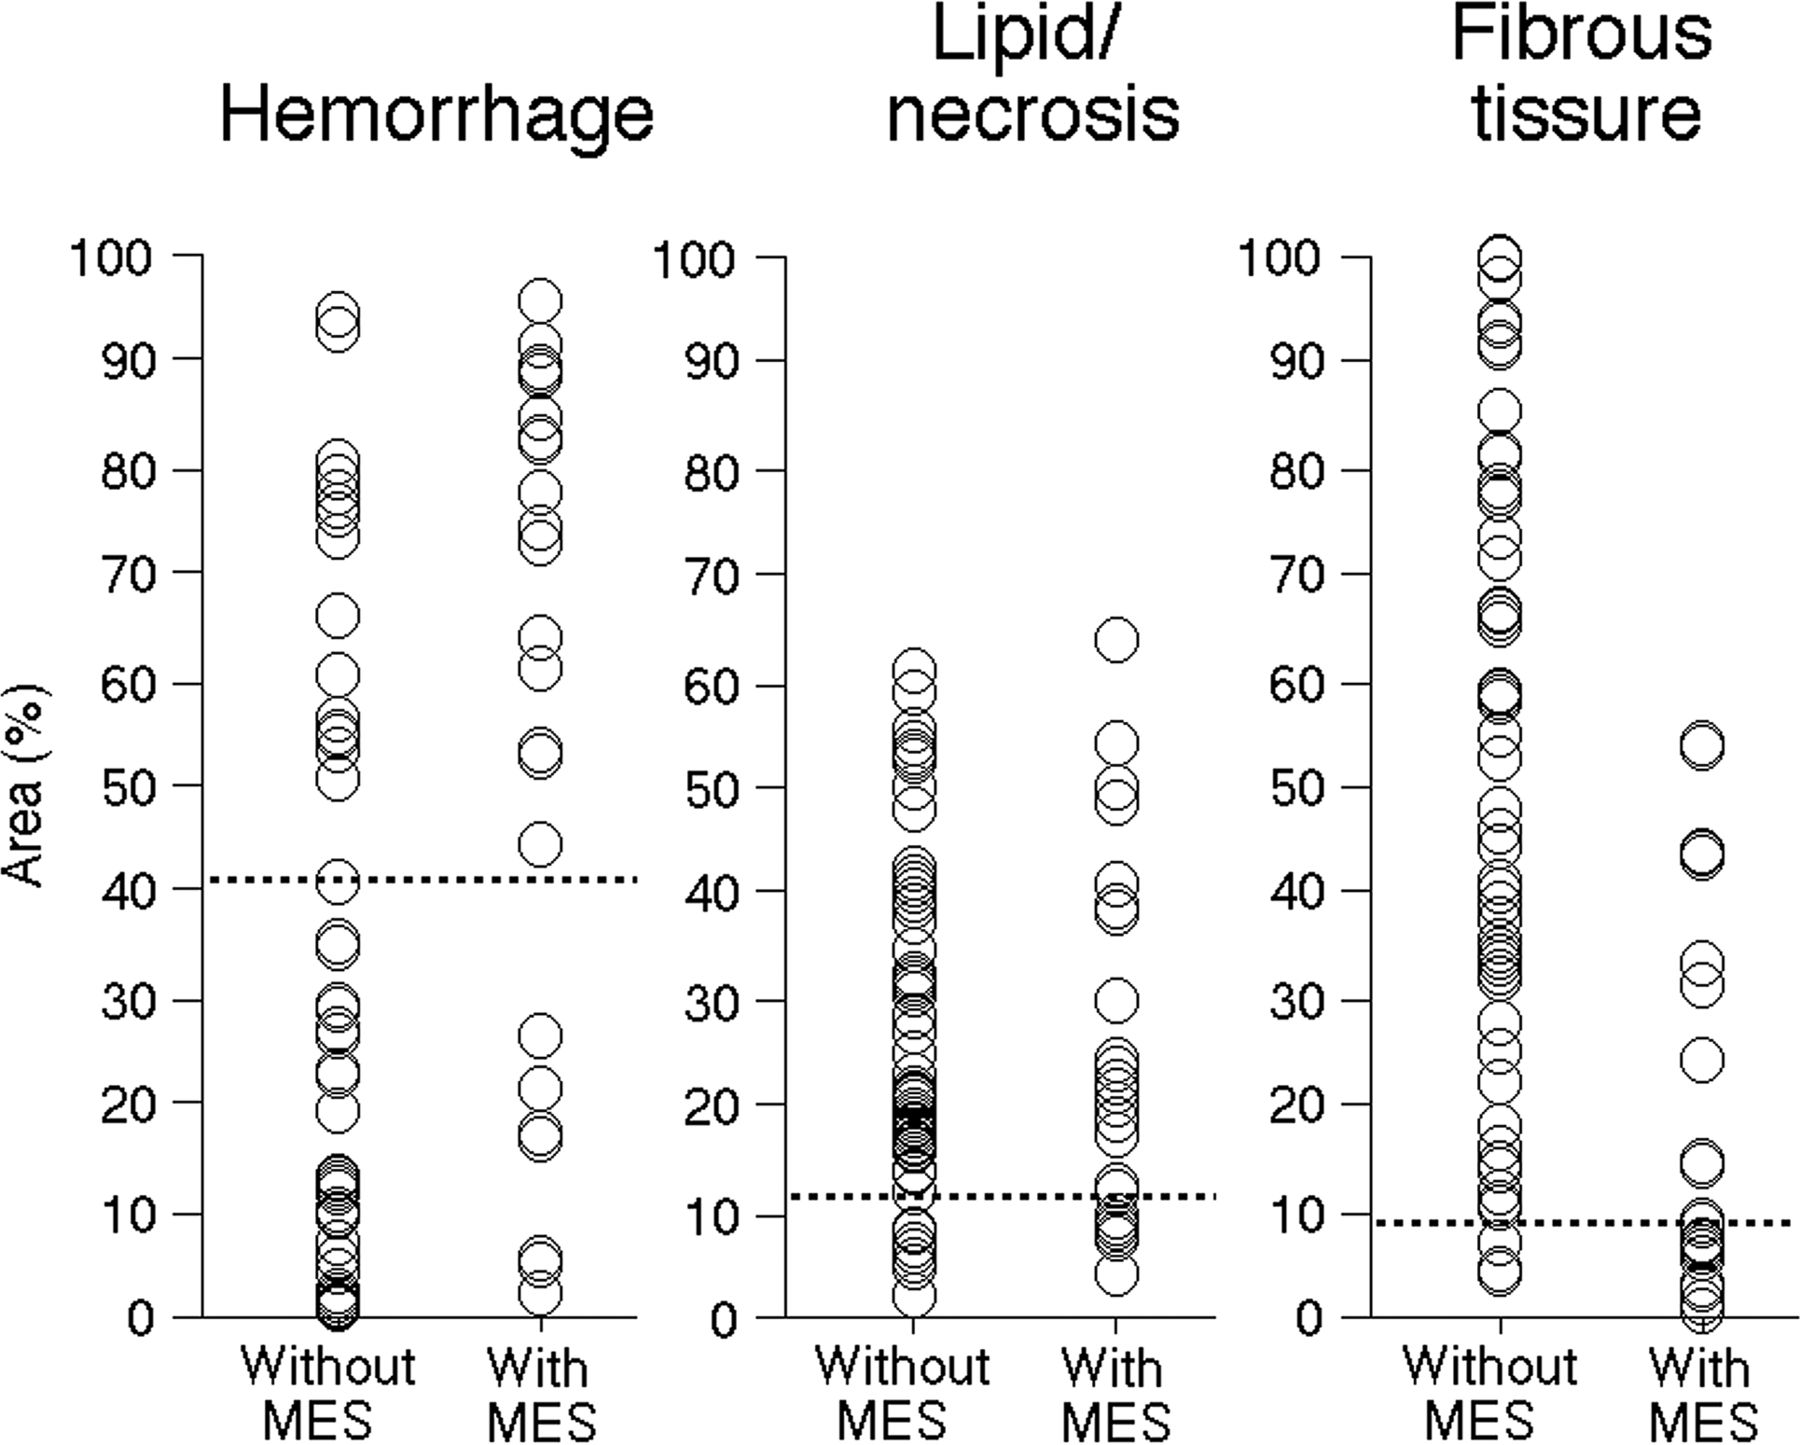
Figures 4 and 5 show the relationship between the percentage areas of each component in quantitative color-coded MR plaque imaging derived from the nongated SE sequence and the development of MES during exposure of the carotid arteries and ROC curves for the former in predicting the latter, respectively. AUCs for percentage areas of hemorrhage, lipid/necrosis, and fibrous tissue were 0.771, 0.533, and 0.787, respectively. The AUC was significantly greater for hemorrhage (difference between areas, 0.238; P < .0001) and fibrous tissue (difference between areas, 0.255; P = .0002) than for lipid/necrosis. No significant difference between AUCs for hemorrhage and fibrous tissue (0.016) was observed (P = .5026).

The relationship between the percentage area of each component in quantitative color-coded MR plaque imaging and the development of MES during exposure of the carotid arteries. The dashed horizontal lines denote the cutoff points lying closest to the left upper corners of the ROC curves in predicting the development of MES during exposure of the carotid arteries.
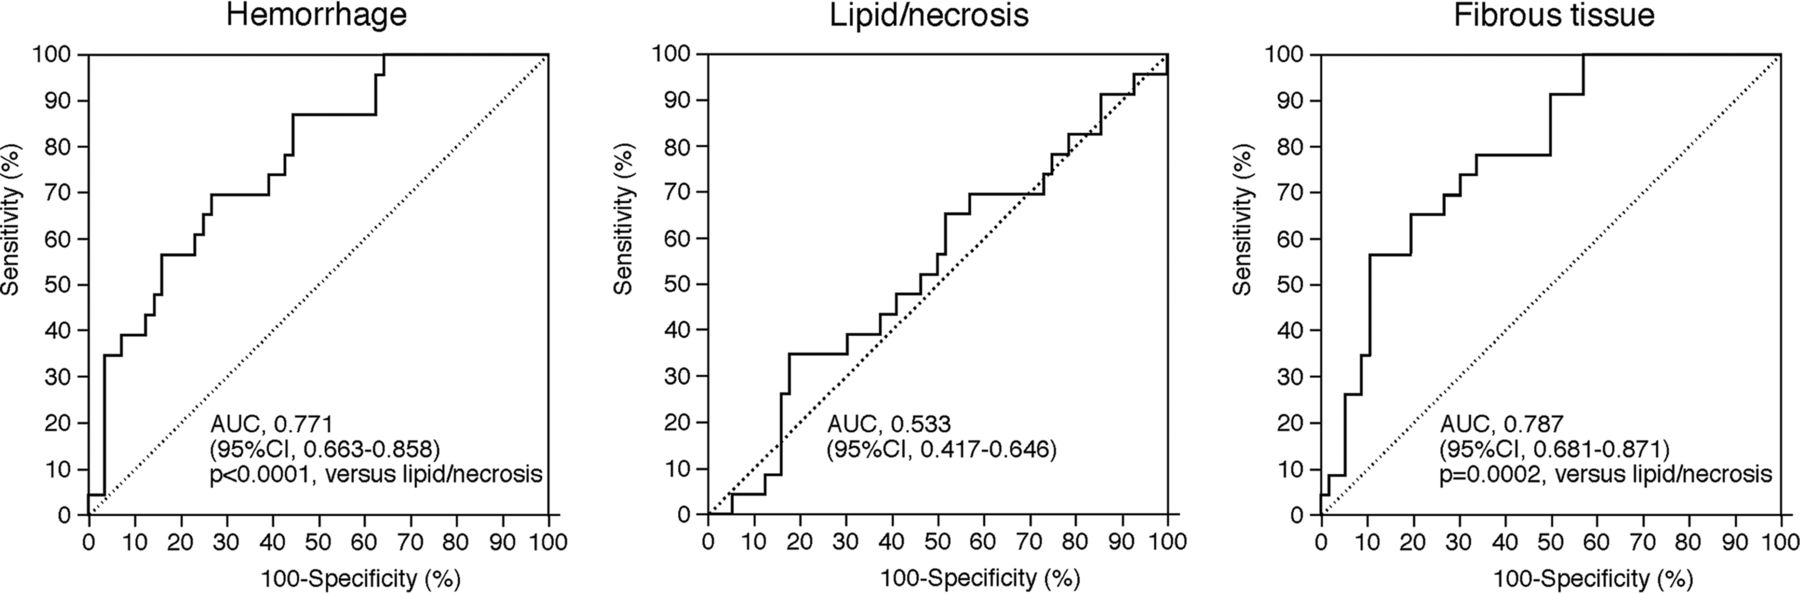
ROC curves used to compare accuracy among percentage areas of each component in quantitative color-coded MR plaque imaging for predicting the development of MES during exposure of the carotid arteries. Pair-wise comparison analysis shows significantly greater AUCs for hemorrhage or fibrous tissue than for lipid/necrosis.
Sensitivity, specificity, and positive- and negative-predictive values for percentage areas of hemorrhage, lipid/necrosis, or fibrous tissue at the cutoff point lying closest to the left upper corner of the ROC curve in predicting development of MES during exposure of the carotid arteries were 70%, 73%, 52%, and 85% (cutoff point = 40.7%); 35%, 82%, 44%, and 75% (cutoff point = 12.3%); or 57%, 89%, 86%, and 83% (cutoff point = 9.0%), respectively (Figs 4 and 5).
Representative images for the 4 kinds of MR plaque imaging and quantitative color-coded MR plaque images from a single patient with MES during exposure of the carotid arteries are shown in Fig 6.
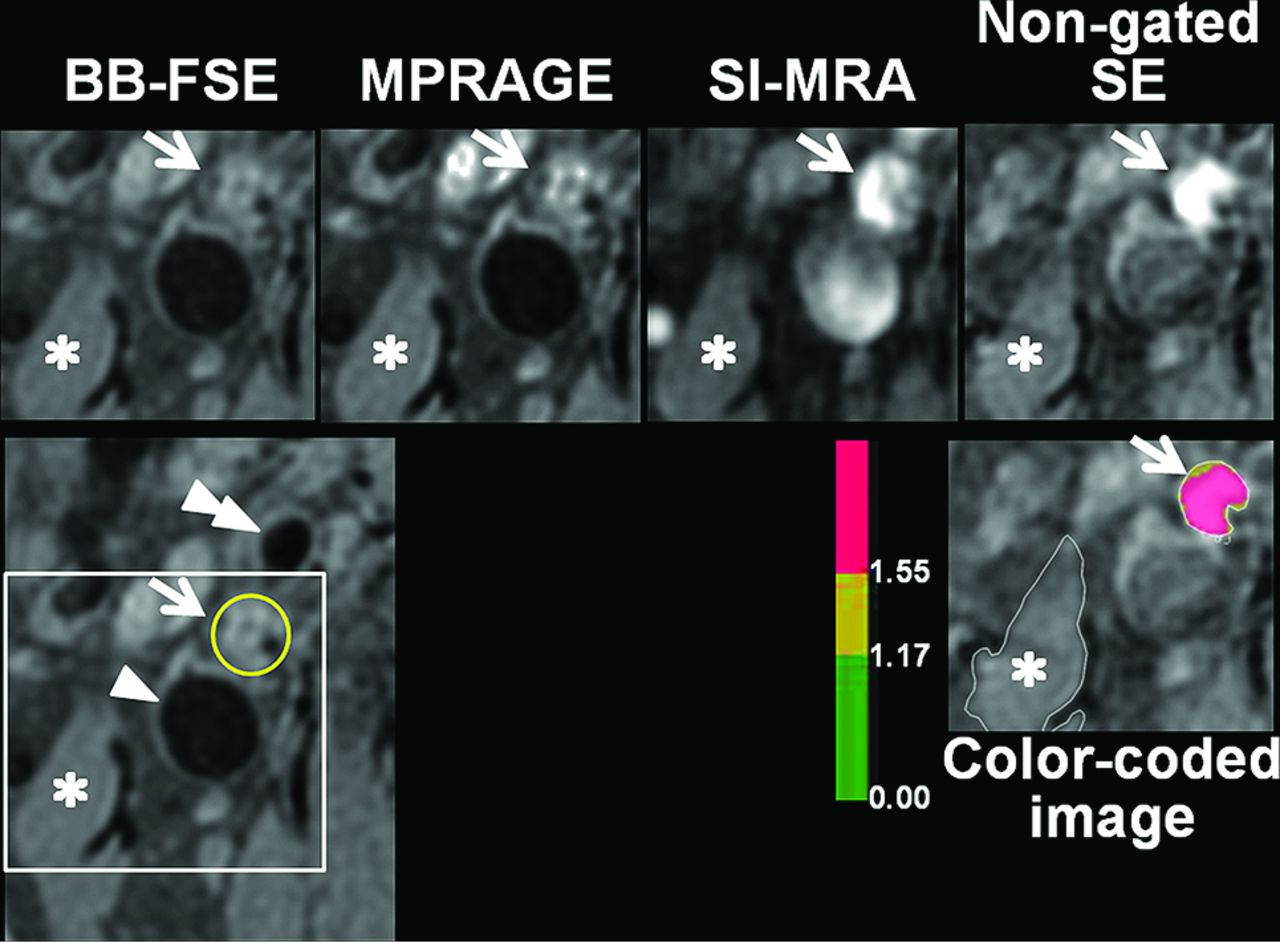
Four kinds of MR plaque images (upper) and quantitative color-coded MR plaque image (right lower) in the symptomatically stenosed (95%) right internal carotid artery of a 72-year-old man showing MES during exposure of the carotid arteries in endarterectomy. A larger FOV image (left lower) indicates anatomic relationships among each vessel (arrow, internal carotid artery; yellow circle, lumen of the internal carotid artery filled with plaque; single arrowhead, internal jugular vein; double arrowhead, external carotid artery; and white square, FOV identical to that of other images). Signal intensities of the plaque in the internal carotid artery (arrows) relative to those of the sternocleidomastoid muscle (asterisks) are, in ascending order, BB-FES, MPRAGE, SI-MRA, and nongated SE. The plaque comprises mainly red and partially yellow areas on the color-coded MR plaque image. On the basis of contrast ratios, hemorrhage, lipid/necrosis, and fibrous tissue are displayed as red, yellow, and green, respectively.
Discussion
The present study demonstrated that nongated SE may predict development of MES during exposure of the carotid arteries in CEA more accurately than other MR plaque imaging.
According to the comparison of findings from different plaque imaging sequences with those from specimens obtained by CEA, nongated SE is superior to BB-FSE, MPRAGE, and SI-MRA for discriminating main intraplaque components such as hemorrhage, lipid-rich necrotic core, and fibrous tissue.15 In the present study, the ROC area to discriminate between patients with and without MES was significantly greater in nongated SE than in other MR images. In addition, among patients with MES, whereas intraplaque signal intensity in nongated SE correlated with the number of MES, no correlation was evident between intraplaque signal intensity in other MR imaging techniques and the number of MES. These findings indicate that nongated SE more accurately predicts the development of MES during exposure of the carotid arteries in CEA than other MR plaque imaging techniques, corresponding with previous results for comparing findings from different plaque imaging sequences with those from specimens obtained by CEA. Multivariate analysis also revealed that as well as symptomatic lesions, CR in nongated SE was significantly associated with the development of MES during exposure of the carotid arteries. Furthermore, at the optimal cutoff point of ROC analysis for CR on nongated SE, while approximately half of the patients who did not develop MES were incorrectly categorized as possibly developing MES, no patients who developed MES were missed. These findings suggest that CR on preoperative nongated SE may identify patients at risk for MES during exposure of the carotid arteries in CEA as a clinical screening test. Nongated SE can avoid substantial influences of the proton density and inversion recovery pulse.15 The sequence method is also widely applicable in any scanner and may be used for multicenter trials.
The present study by using quantitative color-coded MR plaque imaging demonstrated that the increased or reduced occupation rate of hemorrhage or fibrous tissue, respectively, in carotid plaque was more strongly associated with the development of MES during exposure of the carotid arteries than the occupying rate of lipid/necrosis. The high association of hemorrhage or fibrous tissue corresponded with previous findings.9,12 In contrast, no reports have described the reduced association for lipid/necrosis. Signal intensity for each component in the carotid plaque is, in descending order, hemorrhage, lipid/necrosis, and fibrous tissue in any MR plaque imaging.15 However, the present results from quantitative color-coded MR plaque imaging indicated that accurate discrimination of these 3 components is necessary to predict the development of MES during exposure of the carotid arteries. Nongated SE is superior to other plaque imaging techniques for discriminating these components15; this finding supports nongated SE as suitable for predicting the development of MES during exposure of the carotid arteries.
According to the concept presented by Caplan and Hennerici,35 low blood flow velocity in the cerebral arteries may impair clearance of emboli generated from a proximal lesion, subsequently facilitating the onset of ischemia due to emboli in poorly perfused areas of the brain. Actually, several investigators have demonstrated that when microemboli are generated during exposure of the carotid arteries in CEA and pass through the MCA, low blood flow velocity in the MCA is significantly associated with the development of postoperative cerebral ischemic events,36 and increased MCA flow velocity by intentional hypertension (keeping the increase in systolic blood pressure at least +10% above the preoperative value) during exposure of the carotid arteries in CEA prevents postoperative development of new cerebral ischemic events due to intraoperative MES.31 In the present study, positive and negative predictive values for CR on nongated SE at the optimal cutoff point of 1.155 in predicting development of MES during exposure of the carotid arteries were 44% and 100%, respectively, and the 2 values for CR on nongated SE at the optimal cutoff point of 1.600 in predicting development of ≥6 MES during exposure of the carotid arteries were 27% and 100%, respectively.
One study, performed by using the same methods for measuring the degree of stenosis in the ICA and MES on TCD as those used in the present study and with patient characteristics similar to those in the present study, showed that the optimal cutoff point for the number of MES in predicting development of new postoperative ischemic events is 6.34 Another study indicated that early clamping of the common and external carotid arteries before exposure of the ICA containing fragile plaque prevents development of new postoperative ischemic events due to MES during exposure of the carotid arteries.37 Intentional hypertension and early clamping of the carotid arteries are easily performed and inexpensive. On the basis of these findings, we propose a practical clinical algorithm to prevent development of MES-related ischemic events in CEA: Patients undergo preoperative MR imaging of plaque by using nongated SE; and when the CR is >1.155, intentional hypertension is performed during exposure of the carotid arteries. Furthermore, when the CR is >1.600, early clamping of the carotid arteries is provided; and when the CR is ≤1.155, both procedures are unnecessary.
Comparison of the 4 kinds of MR plaque imaging has limitations that must be taken into account when interpreting the results, and these limitations have already been discussed in the literature.15 In the present study, the signal intensity of the carotid plaque was measured in only 1 axial section, set at the location where the stenosis was most severe. This measurement represents the most serious limitation because MES during exposure of the carotid arteries do not always originate from the location with the most severe stenosis. Novel techniques for 3D MR imaging of plaques have recently been developed.38,39 Further investigation of whether volumetric analysis of the whole plaque by using 3D MR imaging may improve the accuracy of predicting MES development during exposure of the carotid arteries in CEA would be of benefit. As another limitation, all patients underwent the operation by the same senior neurosurgeon, to perform surgical procedures in as standardized a manner as possible. Another senior neurosurgeon retrospectively reviewed videos that had been recorded through an operative microscope and determined that the degree of stress on the carotid arteries due to manipulation during carotid exposure was equivalent among patients. Because the degree of stress may affect the development of MES, our findings may not be generalizable to other surgeons. The small sample size (total, 80 patients; 32 patients with events) and patient selection bias (12% of patients were excluded because of failure to obtain TCD data) were also limitations. In addition, because the present study was designed as observational research, prospective studies to validate the accuracy of our data, including the cutoff point for CR in predicting development of MES during exposure of the carotid arteries, will be needed.
Conclusions
The present study demonstrated that nongated SE, which is widely applicable in any scanner, may predict development of MES during exposure of the carotid arteries in CEA more accurately than other MR imaging techniques for plaque imaging.
Footnotes
Disclosures: Kuniaki Ogasawara, Shinsuke Narumi—RELATED: Grant: grant-in-aid for Strategic Medical Science Research Center of Ministry of Education, Culture, Sports, Science and Technology-Japan and Core Research for Evolutional Science and Technology of Japan Science and Technology Agency (25861122). Makoto Sasaki—RELATED: Consulting Fee or Honorarium: Hitachi Medical, Comments: M.S. is a consultant for Hitachi Medical Corporation and has received honoraria from them; UNRELATED: Grants/Grants Pending: Japanese Ministry,* Hitachi Medical,* Astra-Zeneca,* Mitsubishi,* Otsuka*; Payment for Lectures (including service on Speakers Bureaus): Daiichi Sankyo, Ezai, Sanofi, Mitsubishi, Johnson & Johnson, Bayer, Astra-Zeneca, Kowa, Fuji, Hitachi Medical, GE Healthcare; Travel/Accommodations/Meeting Expenses Unrelated to Activities Listed: Olea Medical. *Money paid to the institution.
This work was partly supported by grants-in-aid for Strategic Medical Science Research (S1491001, 2014–2018) from the Ministry of Education, Culture, Sports, Science and Technology of Japan and a grant-in-aid for Scientific Research (15K10313) from the Japan Society for the Promotion of Science.
Indicates open access to non-subscribers at www.ajnr.org
References
- Received July 7, 2014.
- Accepted after revision November 27, 2015.
- © 2016 by American Journal of Neuroradiology


