
Abstract
BACKGROUND AND PURPOSE: Precise in vivo measurement of deep GM volume change is a highly demanded prerequisite for an adequate evaluation of disease progression and new treatments. However, quantitative data on the reproducibility of deep GM structure volumetry are not yet available. In this paper we aim to investigate this reproducibility using a large multicenter dataset.
MATERIALS AND METHODS: We have assessed the reproducibility of 2 automated segmentation software packages (FreeSurfer and the FMRIB Integrated Registration and Segmentation Tool) by quantifying the volume changes of deep GM structures by using back-to-back MR imaging scans from the Alzheimer Disease Neuroimaging Initiative's multicenter dataset. Five hundred sixty-two subjects with scans at baseline and 1 year were included. Reproducibility was investigated in the bilateral caudate nucleus, putamen, amygdala, globus pallidus, and thalamus by carrying out descriptives as well as multilevel and variance component analysis.
RESULTS: Median absolute back-to-back differences varied between GM structures, ranging from 59.6–156.4 μL for volume change, and 1.26%–8.63% for percentage volume change. FreeSurfer had a better performance for the outcome of longitudinal volume change for the bilateral amygdala, putamen, left caudate nucleus (P < .005), and right thalamus (P < .001). For longitudinal percentage volume change, Freesurfer performed better for the left amygdala, bilateral caudate nucleus, and left putamen (P < .001). Smaller limits of agreement were found for FreeSurfer for both outcomes for all GM structures except the globus pallidus. Our results showed that back-to-back differences in 1-year percentage volume change were approximately 1.5–3.5 times larger than the mean measured 1-year volume change of those structures.
CONCLUSIONS: Longitudinal deep GM atrophy measures should be interpreted with caution. Furthermore, deep GM atrophy measurement techniques require substantially improved reproducibility, specifically when aiming for personalized medicine.
ABBREVIATIONS:
- AD
- Alzheimer disease
- ADNI
- Alzheimer Disease Neuroimaging Initiative
- BTB
- back-to-back
- FIRST
- FMRIB Integrated Registration and Segmentation Tool
- LoA
- limit of agreement
- MCI
- mild cognitive impairment
- SEM
- standard error of measurement
Neurodegeneration occurs in Alzheimer disease (AD). The process is characterized by neuronal loss and axonal and synaptic degeneration.1⇓⇓–4 Growing evidence reveals that this process happens within early phases of the disease and before making a clinical diagnosis.5,6 The development of neurodegeneration on a large scale during disease leads to loss of tissue volume (the so-called atrophy), which can be quantified by using structural MR imaging.
Atrophy has been found to be associated with impaired neurologic and neurocognitive performance.7⇓⇓–10 More recently, research revealed that deep GM atrophy specifically plays an important role in the characterization, course, and progression of AD11⇓⇓⇓⇓⇓–17 and in other diseases like MS18⇓–20 and Parkinson disease.21⇓–23 Measurements of deep GM atrophy could therefore be of importance in the evaluation of neuroprotective treatment (eg, in investigating drug efficacy). Currently, a growing number of clinical trials are incorporating brain volume changes as an early biomarker.24 To use atrophy as a reliable biomarker for the extent of neurodegeneration and axonal damage, the precision and reproducibility of volume change measurement techniques should be evaluated. Of note, having precise and reproducible methods would increase statistical power, which reduces sample sizes for detecting effects in clinical trials.
Among automated tissue segmentation software for deep GM structures, FreeSurfer (http://surfer.nmr.mgh.harvard.edu)25 and the FMRIB Integrated Registration and Segmentation Tool (FIRST; part of FSL, http://fsl.fmrib.ox.ac.uk/fsl/fslwiki/FIRST)26⇓⇓–29 are freely available and widely used. Whereas FreeSurfer has a longitudinal pipeline by which multiple time points can be analyzed, FIRST is a cross-sectional technique that analyses only a single time point. Despite the importance of the measurement of deep GM atrophy rate, little is known about reproducibility of the measurements over time in large multicenter datasets.
In this paper, to assess reproducibility, we used data from the Alzheimer Disease Neuroimaging Initiative (ADNI) study30 acquired at 1.5T, including 2 back-to-back (BTB) 3D T1-weighted images at each time point.31 We quantified reproducibility by using BTB differences of 1-year volume change and of percentage volume change for the bilateral amygdala, caudate nucleus, globus pallidus, putamen, and thalamus. To this end, we used 3 different statistical methods. First, we used descriptive statistics by which median absolute differences are reported. This method is frequently used, but its outcome measures cannot be compared statistically between methods. Therefore, we additionally used analytical statistics based on the difference in the regression coefficient. Lastly, we used the method of determination of the standard error of measurement, which very precisely maps reproducibility by modeling different components related to variability in BTB measures.
Materials and Methods
ADNI Dataset
Data used in this study were taken from the ADNI1 study.30 The primary goal of the ADNI has been to test whether serial MR imaging, PET, other biologic markers, and clinical and neuropsychologic assessments can be combined to measure the progression of mild cognitive impairment (MCI) and early AD.
A total of 800 included subjects from 55 sites in the US and Canada were enrolled between 2004 and 2010 and were followed up in a 2- to 3-year time interval. Written informed consent was obtained before each baseline visit. Inclusion criteria were age between 55–90 years, having a study partner able to provide an independent evaluation of functioning, and speaking either English or Spanish. All subjects were willing and able to undergo all test procedures including neuroimaging and agreed to longitudinal follow-up. Exclusion criteria were specific psychoactive medications. For control subjects, inclusion criteria were as follows: Mini-Mental State Examination scores between 24–30 (inclusive), a clinical dementia rating of 0, and no history of depression, MCI, and dementia. The age range was matched to that of MCI and AD subjects. For subjects with MCI, inclusion criteria were as follows: Mini-Mental State Examination scores between 24–30 (inclusive), a memory complaint, objective memory loss measured by education-adjusted scores on the Wechsler Memory Scale Logical Memory II, a clinical dementia rating of 0.5, absence of high levels of impairment in other cognitive domains, essentially preserved activities of daily living, and an absence of dementia. For subjects with mild AD, inclusion criteria were as follows: Mini-Mental State Examination scores between 20–26 (inclusive), clinical dementia rating of 0.5 or 1.0, and meets National Institute of Neurological and Communicative Disorders and Stroke/Alzheimer's Disease and Related Disorders Association criteria for probable AD. A standardized imaging protocol carried out over qualified sites included the acquisition of 2 sequential 3D T1-weighted MPRAGE scans (ie, BTB) at baseline and at the 1-year study time point.32
Subjects
Our study involved 562 subjects who had exactly 2 MPRAGE scans acquired at both the baseline and at 1 year, with 3D T1-weighted BTB images acquired at both time points at 1.5T. Three hundred twenty-two (57.3%) subjects were male and 240 (42.7%) were female. The median age at baseline was 75.3 years (interquartile range, 8.7). One hundred fourteen (30.4%) were diagnosed with probable AD, 277 (49.3%) with MCI, and 171 (20.3%) were healthy controls. Data were requested after written compliance to the ADNI data use agreement and data sharing policy and were obtained from the ADNI data image and data archive LONI (Laboratory of Neuro Imaging; http://adni.loni.usc.edu). All data were received anonymized by ADNI procedures and with assignment of a unique ADNI study number to subjects.
Volumetric Measurements
MR image acquisition included standard automated adjustments with no additional postprocessing such as intensity nonuniformity correction or gradient warp correction. DICOM images of subjects were converted to NIfTI format for further processing by using dicom2nifti (http://www.cabiatl.com/mricro/mricron/dcm2nii.html).
Automated deep GM segmentations were performed on the NCAgrid (a 64-bit Linux computer cluster with 512 cores) by using 2 freely available and frequently used software packages: FreeSurfer version 5.3.025 and FIRST implemented in FSL version 5.0.8.26⇓⇓–29
For FreeSurfer, images were segmented by using the longitudinal image processing stream, which analyzes 2 time points simultaneously to improve the estimation of volumes and volume change. Within FIRST, the default parameters were used.25 Segmentations were carried out for both BTB scans at baseline and at the 1-year study time point, leading to a total number of 134,880 segmentations.
Outcome Measures
The 2 derived main outcome measures in our study were the longitudinal volume change and percentage volume change. The volume change (ΔV, in μL) was calculated for each longitudinal scan pair (two BTB1 and two BTB2) as:
 and
and

The percentage volume change for both ΔV1 and ΔV2 was calculated separately as:

Fig 1 schematically shows study time points and the calculation of the volume change and percentage volume change by using BTB scans.
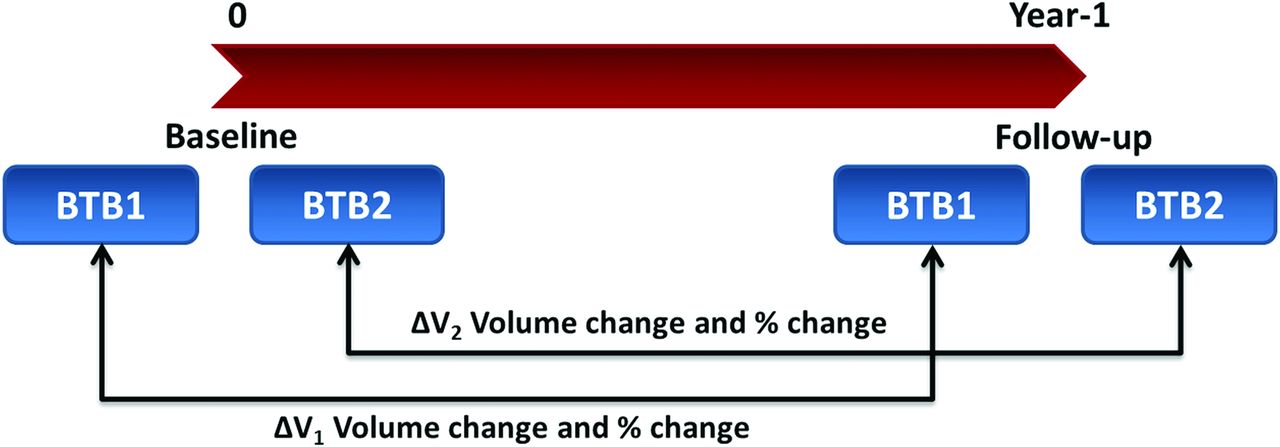
Scheme showing both BTB scans at each time point and calculation of the volume change and percentage volume change.
In both BTB scans (BTB1 and BTB2), at each time point, the brain is assumed to be identical; therefore ΔV2 − ΔV1 can be used as a measure of reproducibility for each outcome measure (ie, absolute and percentage volume change).
Statistical Analysis
Data distribution and missing data were carefully checked before all statistical analyses. Reproducibility according to BTB scans is reported by using 3 methods of analysis for both software packages. First, we used median absolute BTB differences. Second, we compared the absolute BTB differences based on differences in the regression coefficient (effect size). This involved the construction of separate linear multilevel models for each deep GM structure and each hemisphere. Data were natural log-transformed before analysis to avoid fitting the model to a skewed distribution of our data. In our multilevel models, a random intercept was chosen to correct for the dependency of observations clustering within each same subject. Variance around the intercept was assumed to be normally distributed. Statistics were reported as P values, back-transformed effect sizes, and their corresponding 95% confidence intervals.
Finally, as a third method, we assessed reproducibility by determining the limit of agreement (LoA), which is considered as a very sensitive method of analysis.33⇓–35 This was done by constructing separate linear multilevel models for each deep GM structure summing the variance components attributable to BTB scans to determine the level of random bias in both outcome variables. Because the method is based on variance, contrary to the first 2 methods, it uses the original (nonabsolute) values of each volume change analysis. Fixed factors in our multilevel model included hemisphere, software package (FreeSurfer or FIRST), sex, diagnostic group, and all possible interactions between these variables. Random factors in the model included hemispheres, software package, time point, all possible interactions between them, and the use of a random intercept on the subject level. Nesting of the factors was carried out according to the method described by Mulder and colleagues.35 We used restricted maximum likelihood as the estimating procedure in all multilevel analyses and assumed an independent covariance matrix. The best fitting model to the data was then chosen based on the lowest Akaike information criterion. Interscan standard errors of measurement (SEMs) attributable to BTB scans for each software package were calculated by summing the random variance components of the multilevel models related to BTB (ie, the variance attributable to the interaction between the random chosen variables and time point; see Equation 1 below). The separate variance components required to sum SEM were assumed to be independent of each other. The variance component containing the highest interaction (ie, σ2 [time point × hemisphere × software package) was considered to be completely part of the error variance in our calculations. Furthermore, all variance components containing a time point were allowed to vary within software package.

Then, LoA, as a measure of reproducibility, was derived and reported from the SEM for each software package by using Equation 2. The lower the LoA, the better the reproducibility.

The quality of all MR images was inspected visually. Regarding the quality of the segmentation, we identified severe outliers based on implausible results of the outcome measures. Implausible outliers in terms of longitudinal volume change or percentage longitudinal volume change were considered to be a consequence of a failure in segmentation. An implausible outlier was identified if the longitudinal BTB difference was more than 25% of its corresponding baseline volume. We created separate linear multilevel models with and without implausible large outliers to evaluate their impact on our SEM. These outliers were treated as missing data in our final analysis. In addition, we compared the number of outliers between FreeSurfer and FIRST in all deep GM structures. This was carried out by using the binominal test, which tested an equal distribution of the number of outliers for both FreeSurfer and FIRST.
For illustrating agreement, Bland-Altman plots were created. A Bland-Altman plot represents the difference in BTB of an outcome measure versus its mean.36,37 We created plots for both outcome measures of FreeSurfer and FIRST, with and without implausible outliers. In this paper, for this method, we present the results of analysis performed on data excluding implausible outliers.
All statistical analysis was carried out by using SPSS version 21 (IBM, Armonk, New York) except for the modeling of data to obtain SEM and derived LoAs, which was carried out by using SAS Studio version 3.4 (SAS Institute, Cary, North Carolina). The level of significance in our models was set to 0.05 (5%).
Results
Median follow-up time (χ2 = 1.566; df, 2; P = .45) and age (χ2 = 0.992; df, 2; P = .60) did not differ between the 3 study groups. To enable a direct comparison of reproducibility metrics to the measured (percentage) volume change values, nonannualized median atrophy rates are presented in Table 1. As expected, atrophy rates were generally higher in patients with AD compared with patients with MCI and control patients, with the highest rates found for the amygdala. For 2 different male healthy control patients, FreeSurfer and FIRST segmentation failed. Therefore, for each software package, 561 subjects were included in the longitudinal data analysis. A typical example of FreeSurfer and FIRST segmentations is shown in Fig 2. BTB differences are illustrated by the example in Fig 3, which shows Bland-Altman plots of BTB difference in longitudinal volume change for the left caudate nucleus for both FreeSurfer and FIRST, excluding the improbable outliers.
Nonannualized atrophy rates for deep GM structures for each hemisphere per group

A, An example of a 3D T1-weighted image segmented with B, FIRST and C, FreeSurfer.
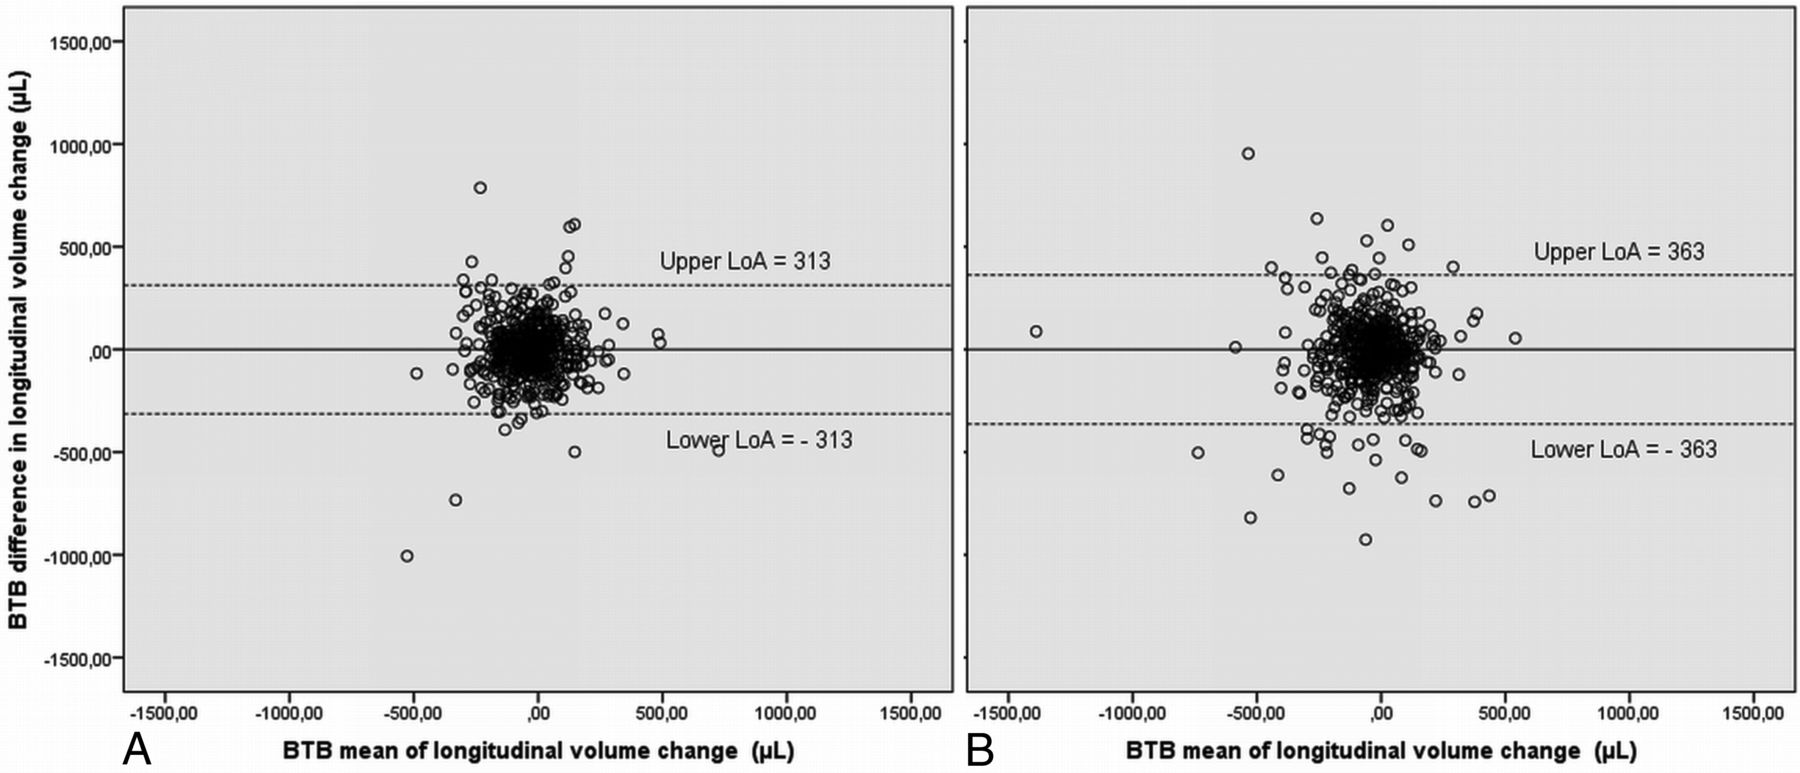
Bland-Altman plots for the left caudate nucleus, presented for the outcome measures of BTB difference in longitudinal volume change, to illustrate agreement for A, FreeSurfer and B, FIRST. Plots show the difference between the 2 measurements (ie, the “BTB difference”) along the vertical axis versus the mean of the 2 measurements along the horizontal axis. LoAs for FreeSurfer are obviously smaller (ie, better reproducibility) than those of FIRST.
Descriptive Statistics
Descriptive statistics for each hemisphere for each deep GM structure for measuring longitudinal volume change and longitudinal percentage volume change are presented in Tables 2 and 3, respectively. Based on these reported descriptive statistics (median absolute BTB differences with corresponding 90th percentile indicating spread), as expected, the smaller deep GM structures tended to have smaller BTB differences in longitudinal volume change and larger BTB differences in percentage volume change.
Median absolute BTB difference in longitudinal volume change for each deep GM structure for both hemispheres. Effect size, corresponding 95% confidence CI, and P values based on linear multilevel modelling are also presented
Median absolute BTB difference in longitudinal percentage volume change for each deep GM structure for both hemispheres. Effect size, corresponding 95% CI and P values based on linear multilevel modelling are also presented
Effect Sizes
Effect sizes, based on the difference in the regression coefficient, corresponding P values, and 95% confidence intervals of comparison between segmentation by using FreeSurfer and FIRST are presented in Tables 2 and 3. The effect size in these Tables can be interpreted as the mean improvement of reproducibility in both longitudinal outcome variables when switching from FSL to FreeSurfer. For the outcome measure of the absolute BTB difference in longitudinal volume change, FreeSurfer performed significantly better than FIRST for the left and right amygdala (both P < .001), left caudate nucleus (P = .003), left (P < .001) and right (P = .003) putamen, and right thalamus (P < .001). Concerning the outcome measure of the absolute BTB difference in longitudinal percentage volume change, FreeSurfer performed significantly better than FIRST for the left amygdala (P = .02), left (P = .002) and right (P = .004) caudate nucleus, and left putamen (P < .001). For the right amygdala and putamen, results are not presented because of lack of validity caused by failures in model fit.
Outliers
For the right amygdala, number of outliers were significantly different in all groups, when comparing 2 segmentation software packages (P < .002). This difference was not significant for other structures. Table 4 shows the number of excluded cases (extreme outliers) for each deep GM structure and their proportion within each segmentation software used and the total sample size. The proportion of excluded cases was relatively small in the total sample of data; however it turned out to be more frequent when using FIRST compared with FreeSurfer.
Number and proportion of excluded cases (extreme outliers) presented for each software for each deep GM structure
Limits of Agreement
Based on our third method to evaluate reproducibility, values for the LoAs of FreeSurfer and FIRST derived from linear multilevel modeling are reported in Table 5. This analysis showed a visible trend for a better performance of FreeSurfer for both the measurement of longitudinal volume change and longitudinal percentage volume change, except for the globus pallidus, for which FIRST performed better. There was also a trend for an influence of the typical cross-sectional volume of a structure. Smaller deep GM structures showed smaller LoAs for longitudinal volume change measurement and larger LoAs for longitudinal percentage volume change.
SEMs and LoAs derived from variance component analysis out of a linear multilevel model for each deep GM structure
Discussion
Brain atrophy reflecting neurodegeneration and neuroaxonal damage is known to be an important characteristic of diseases like AD and MS. In the current study, we investigated the reproducibility of volume change and percentage volume change measurement of 5 deep GM structures in a large multicenter dataset. To this end, we used 2 frequently used segmentation software packages, FreeSurfer and FIRST.
It is worth mentioning that FreeSurfer does provide a longitudinal pipeline to analyze multiple time points whereas FIRST only offers a cross-sectional analysis. Strikingly, for both software packages, the reproducibility error was comparable with the measured atrophy rates. Our results showed that BTB differences in 1-year percentage volume change (ranging from 1.26% for left thalamus to 8.63% for right amygdala) were roughly 1.5–3.5 times larger than the average atrophy rates of these deep GM structures (approximately 0.9% and 2.5%, respectively).
We used 3 different statistical methods that complement each other. Although reporting median and 90th percentile absolute differences alone is an easy and robust way to interpret results, statistical comparison in outcome measurements between methods of segmentation is not possible. Therefore, we next performed additional analytical statistics based on the difference in the regression coefficient. Finally, we used the method of determination of SEM, which provides a very precise way to map reproducibility and allows modeling of different sources of variability. This method is also proposed to be applied in determining agreement to map measurement error, an important measurement property in medicine.33,34,38 The sensitivity of this method is mainly attributable to the determination of specific variance components of a model, from which LoAs can be determined. In addition, the SEM method is a more suitable way for determining specific random variance in an outcome measure, which could provide additional information of the estimation of variance in a population. Using a large ADNI dataset makes such estimations more accurate. Another advantage of this method is that it is based on spread, contrary to the second regression-based method, and instead of signed or absolute BTB differences, the clinical variables of interest (eg, volume change, percentage volume change) are modeled directly. This method for determining LoAs, however, is strongly affected by large outliers, and its procedure is much more costly and time-consuming.
Both methods of analytical statistics, namely determination of SEM with derived LoAs and the method based on difference in the regression coefficient, were carried out by using linear multilevel modeling. The general advantages of linear multilevel analysis are its flexibility in dealing with missing data, the ability to objectively include factors and covariates into 1 whole model, and a necessary applied correction for the dependency of data for measurements within the same subjects.39,40
For both software packages, the reproducibility error was substantial compared with the measured atrophy (see Table 1 for the measured atrophy). However, FreeSurfer had better reproducibility compared with FIRST within the whole longitudinal outcome spectrum (except for globus pallidus), though the differences were not very large. The reproducibility was dependent on the structure baseline volume and also on the desired outcome measure (ie, volume change or percentage volume change). For example, compared with larger structures, smaller GM structures had smaller reproducibility errors for volume change and larger reproducibility errors for percentage volume change. For the structures measured in our study, when measuring the longitudinal volume change, the larger GM structures (putamen and thalamus) had BTB differences roughly twice as large as smaller structures (amygdala, globus pallidus), whereas for the outcome of longitudinal percentage volume change, this was reversed: here, larger structures outperformed smaller structures by approximately a factor of 5. A study on cross-sectional volume measurement by using FreeSurfer,41 reported generally larger relative scan–rescan errors for smaller structures. Such variability could cause poorer reproducibility of longitudinal volume change for smaller structures.
This poor reproducibility could be linked to the poor delineation of such brain structures by using automated software. To improve this, increase in the SNR and contrast-to-noise ratio (eg, by increasing the field strength or by further optimization of the acquisition) are recommended. In addition, multimodal segmentation, which includes other tissue information such as diffusion and susceptibility, could increase the accuracy and reproducibility of the segmentation and volume estimation.
Our study had some limitations. Because of the very large number of segmentations performed, visual inspection of segmentation results was impractical. However, we used an automated method to exclude gross segmentation errors by using the BTB information. The very few occurring implausible outliers in our outcome measures were assumed to be caused by incorrect segmentations of 1 or more scans of that subject. To identify such gross outliers without excluding true atrophies, we applied a very wide cutoff criterion of 25% in longitudinal volume change or in percentage volume change compared with the baseline. As expected, the LoAs were very large when including the improbable outliers.
Conclusions
We provided quantitative information for 5 deep GM structures by using the widely used segmentation algorithms FreeSurfer and FIRST by 3 different methods of analysis. In general, FreeSurfer performance was better than that of FIRST. However, our results showed that BTB differences in 1-year percentage volume change were roughly 1.5–3.5 times larger than the atrophy rates of those deep GM structures. This suggests that longitudinal deep GM atrophy measures should be interpreted with caution. Finally, to provide a reliable additional biomarker, deep GM atrophy measurement techniques require substantially improved reproducibility, specifically when aiming for personalized medicine.
Footnotes
A. Meijerman and H. Amiri contributed equally to this work.
Disclosures: Marianne Jonker—UNRELATED: Consulting Fee or Honorarium: Vrije University Medical Center, Department of Epidemiology and Biostatistics, Comments: as a common practice, our department is paid for doing consultancy*. Ronald van Schijndel—OTHER RELATIONSHIPS: Image Analysis Center (IAC), Comments: partly working for the IAC, which is a contract research organization of the Vrije University Medical Center. Keith Cover—UNRELATED: Grants/Grants Pending: European Community FP7 Project, Comments: funded by the Neugrid4you project (grant agreement 2835262) from 2011 to 2015; studied methods for measuring atrophy of the brain in MRI*. Hugo Vrenken—UNRELATED: Grants/Grants Pending: Novartis Pharma, Comments: brain atrophy in MS; Teva Europe, Comments: brain atrophy in MS; Merck Serono, Comments: brain atrophy and lesions in MS*. *Money paid to the institution.
This work was supported by the Alzheimer Disease Neuroimaging Initiative (ADNI) (National Institutes of Health grant U01 AG024904) and Department of Defense ADNI (Department of Defense award number W81XWH-12-2-0012). ADNI is funded by the National Institute on Aging, the National Institute of Biomedical Imaging and Bioengineering, and through generous contributions from the following: AbbVie, Alzheimer's Association; Alzheimer's Drug Discovery Foundation; Araclon Biotech; BioClinica, Inc.; Biogen; Bristol-Myers Squibb Company; CereSpir, Inc.; Eisai Inc.; Elan Pharmaceuticals, Inc.; Eli Lilly and Company; EuroImmun; F. Hoffmann-La Roche Ltd and its affiliated company Genentech, Inc.; Fujirebio; GE Healthcare; IXICO Ltd.; Janssen Alzheimer Immunotherapy Research & Development, LLC.; Johnson & Johnson Pharmaceutical Research & Development LLC.; Lumosity; Lundbeck; Merck & Co., Inc.; Meso Scale Diagnostics, LLC.; NeuroRx Research; Neurotrack Technologies; Novartis Pharmaceuticals Corporation; Pfizer Inc.; Piramal Imaging; Servier; Takeda Pharmaceutical Company; and Transition Therapeutics. The Canadian Institutes of Health Research is providing funds to support ADNI clinical sites in Canada. Private sector contributions are facilitated by the Foundation for the National Institutes of Health (www.fnih.org). The grantee organization is the Northern California Institute for Research and Education, and the study is coordinated by the Alzheimer Disease Cooperative Study at the University of California, San Diego. ADNI data are disseminated by the Laboratory for Neuro Imaging at the University of Southern California.
Data used in preparation of this article were obtained from the Alzheimer's Disease Neuroimaging Initiative (ADNI) data base (adni.loni.usc.edu). As such, the investigators within the ADNI contributed to the design and implementation of ADNI and/or provided data, but did not participate in the analysis or writing of this report. A complete listing of ADNI investigators can be found at: http://adni.loni.usc.edu/wp-content/uploads/how_to_apply/ADNI_Acknowledgement_List.pdf.
Indicates open access to non-subscribers at www.ajnr.org
References
- Received June 16, 2017.
- Accepted after revision August 28, 2017.
- © 2018 by American Journal of Neuroradiology


Jump to section
Related Articles
Cited By...
- Quantification of Thalamic Atrophy in MS: From the Multicenter Italian Neuroimaging Network Initiative Data Set to Clinical Application
- Multisite Test-Retest Reliability and Compatibility of Brain Metrics derived from FreeSurfer Versions 7.1, 6.0, and 5.3
- Untangling normal aging from disease-related brain atrophy in MS