
Abstract
BACKGROUND AND PURPOSE: O6-methylguanine-DNA methyltransferase (MGMT) promoter methylation status in primary and recurrent glioblastoma may change during treatment. The purpose of this study was to correlate MGMT promoter methylation status changes with DWI and DSC PWI features in patients with recurrent glioblastoma after standard treatment.
MATERIALS AND METHODS: Between January 2008 and November 2016, forty patients with histologically confirmed recurrent glioblastoma were enrolled. Patients were divided into 3 groups according to the MGMT promoter methylation status for the initial and recurrent tumors: 2 groups whose MGMT promoter methylation status remained, group methylated (n = 13) or group unmethylated (n = 18), and 1 group whose MGMT promoter methylation status changed from methylated to unmethylated (n = 9). Normalized ADC and normalized relative CBV values were obtained from both the enhancing and nonenhancing regions, from which histogram parameters were calculated. The ANOVA and the Kruskal-Wallis test followed by post hoc tests were performed to compare histogram parameters among the 3 groups. The t test and Mann-Whitney U test were used to compare parameters between group methylated and group methylated to unmethylated. Receiver operating characteristic curve analysis was used to measure the predictive performance of the normalized relative CBV values between the 2 groups.
RESULTS: Group methylated to unmethylated showed significantly higher means and 90th and 95th percentiles of the cumulative normalized relative CBV values of the nonenhancing region of the initial tumor than group methylated and group unmethylated (all P < .05). The mean normalized relative CBV value of the nonenhancing region of the initial tumor was the best predictor of methylation status change (P < .001), with a sensitivity of 77.78% and specificity of 92.31% at a cutoff value of 2.594.
CONCLUSIONS: MGMT promoter methylation status might change in recurrent glioblastoma after standard treatment. The normalized relative CBV values of the nonenhancing region at the first preoperative MR imaging were higher in the MGMT promoter methylation change group from methylation to unmethylation in recurrent glioblastoma.
ABBREVIATIONS:
- CCRT
- concurrent chemoradiation therapy
- EGFR
- epidermal growth factor receptor
- GBM
- glioblastoma
- IDH
- isocitrate dehydrogenase
- MGMT
- O6-methylguanine-DNA methyltransferase; MM = methylated
- MU
- methylation to unmethylation
- nADC
- normalized ADC
- NER
- nonenhancing region
- nrCBV
- normalized relative CBV
- rCBV
- relative CBV
- TMZ
- temozolomide
- UU
- unmethylated
- VASARI
- Visually Accessible Rembrandt Images
- WHO
- World Health Organization
Glioblastoma (GBM) is the most common malignant brain tumor and has a poor prognosis, with a median survival time of 12–15 months, even after operation followed by concurrent chemoradiation therapy (CCRT) with adjuvant temozolomide (TMZ).1 Patients with GBM containing a methylated O6-methylguanine-DNA methyltransferase (MGMT) gene promoter are associated with a favorable outcome after TMZ chemotherapy, whereas patients with an unmethylated MGMT promoter do not have such a benefit.2 The MGMT gene encodes a DNA repair protein involved in the removal of TMZ-induced damaged DNA, and epigenetic silencing by methylation of its promoter on the O6 position of guanine is correlated with the cytotoxic effect of TMZ.3 MGMT promoter methylation is reported to be present in 35%–75% of GBMs.4 Pseudoprogression after CCRT is more common in tumors with MGMT promoter methylation in GBM, and methylation of the MGMT promoter should be considered when interpreting follow-up MR imaging.5
MGMT promoter methylation status in primary and recurrent GBM may change during treatment.3,6,7 Some authors have suggested that reduced MGMT promoter methylation in recurrent GBM after TMZ treatment is one of the mechanisms for the acquisition of therapeutic resistance; however, controversy remains as to whether changes in the methylation status of the MGMT promoter may be a prognostic factor for recurrent GBM.8,9
Many authors have reported the relationships of MGMT promoter methylation status and imaging features, including CT, DWI, DSC PWI, or DTI, in patients with high-grade glioma or GBM before treatment.10⇓⇓-13 However, to our knowledge, there has been no previous report regarding the correlation of DSC PWI and DWI with changes in the MGMT promoter methylation status in recurrent GBM. Therefore, the purpose of our study was to correlate changes in the MGMT promoter methylation status with DSC PWI and DWI features in patients with recurrent GBM after standard treatment.
MATERIALS AND METHODS
Patients
This retrospective study was approved by the institutional review board of Seoul National University Hospital. The requirement for informed consent was waived. One hundred one patients with anaplastic astrocytoma or GBM who underwent surgical resection and a second operation for suspected recurrence at our hospital between January 2008 and November 2016 were screened for this study from the neurosurgery data base. The inclusion criteria were as follows: 1) histopathologic diagnosis of anaplastic astrocytoma or GBM based on the World Health Organization (WHO) 2016 criteria at the initial operation; 2) histopathologic diagnosis of recurrent GBM based on the WHO 2016 criteria at the second operation; and 3) a CCRT and adjuvant TMZ-based regimen between the operations. Sixty-one patients were excluded because of the following: 1) unavailable pathologic specimen from either operation (n = 15); 2) unavailable appropriate MR imaging from either operation (n = 22); and 3) a third and fourth operation (n = 24).
Finally, 40 consecutive patients (20 men, 20 women; mean age, 49.85 years; range, 21–74 years) were included in the present study. We reviewed the clinical characteristics of each patient, including age, sex, preoperative Karnofsky Performance Status score at the first and second operation, MGMT promoter methylation status, isocitrate dehydrogenase (IDH) 1 or 2 mutation status, epidermal growth factor receptor (EGFR) amplification results at each operation, radiation dose, TMZ cycles, and treatment options after the second operation from the electronic medical records of our institution. These patients were divided into 3 groups according to the MGMT promoter methylation status of the initial and recurrent tumors: unchanged MGMT promoter methylation status, further divided into methylated (group MM, n = 13) and unmethylated (group UU, n = 18), and changed MGMT promoter methylation status from methylation to unmethylation (group MU, n = 9) (Fig 1). The extent of resection was defined on the basis of immediate postoperative MR imaging obtained within 24–72 hours after the operation.14
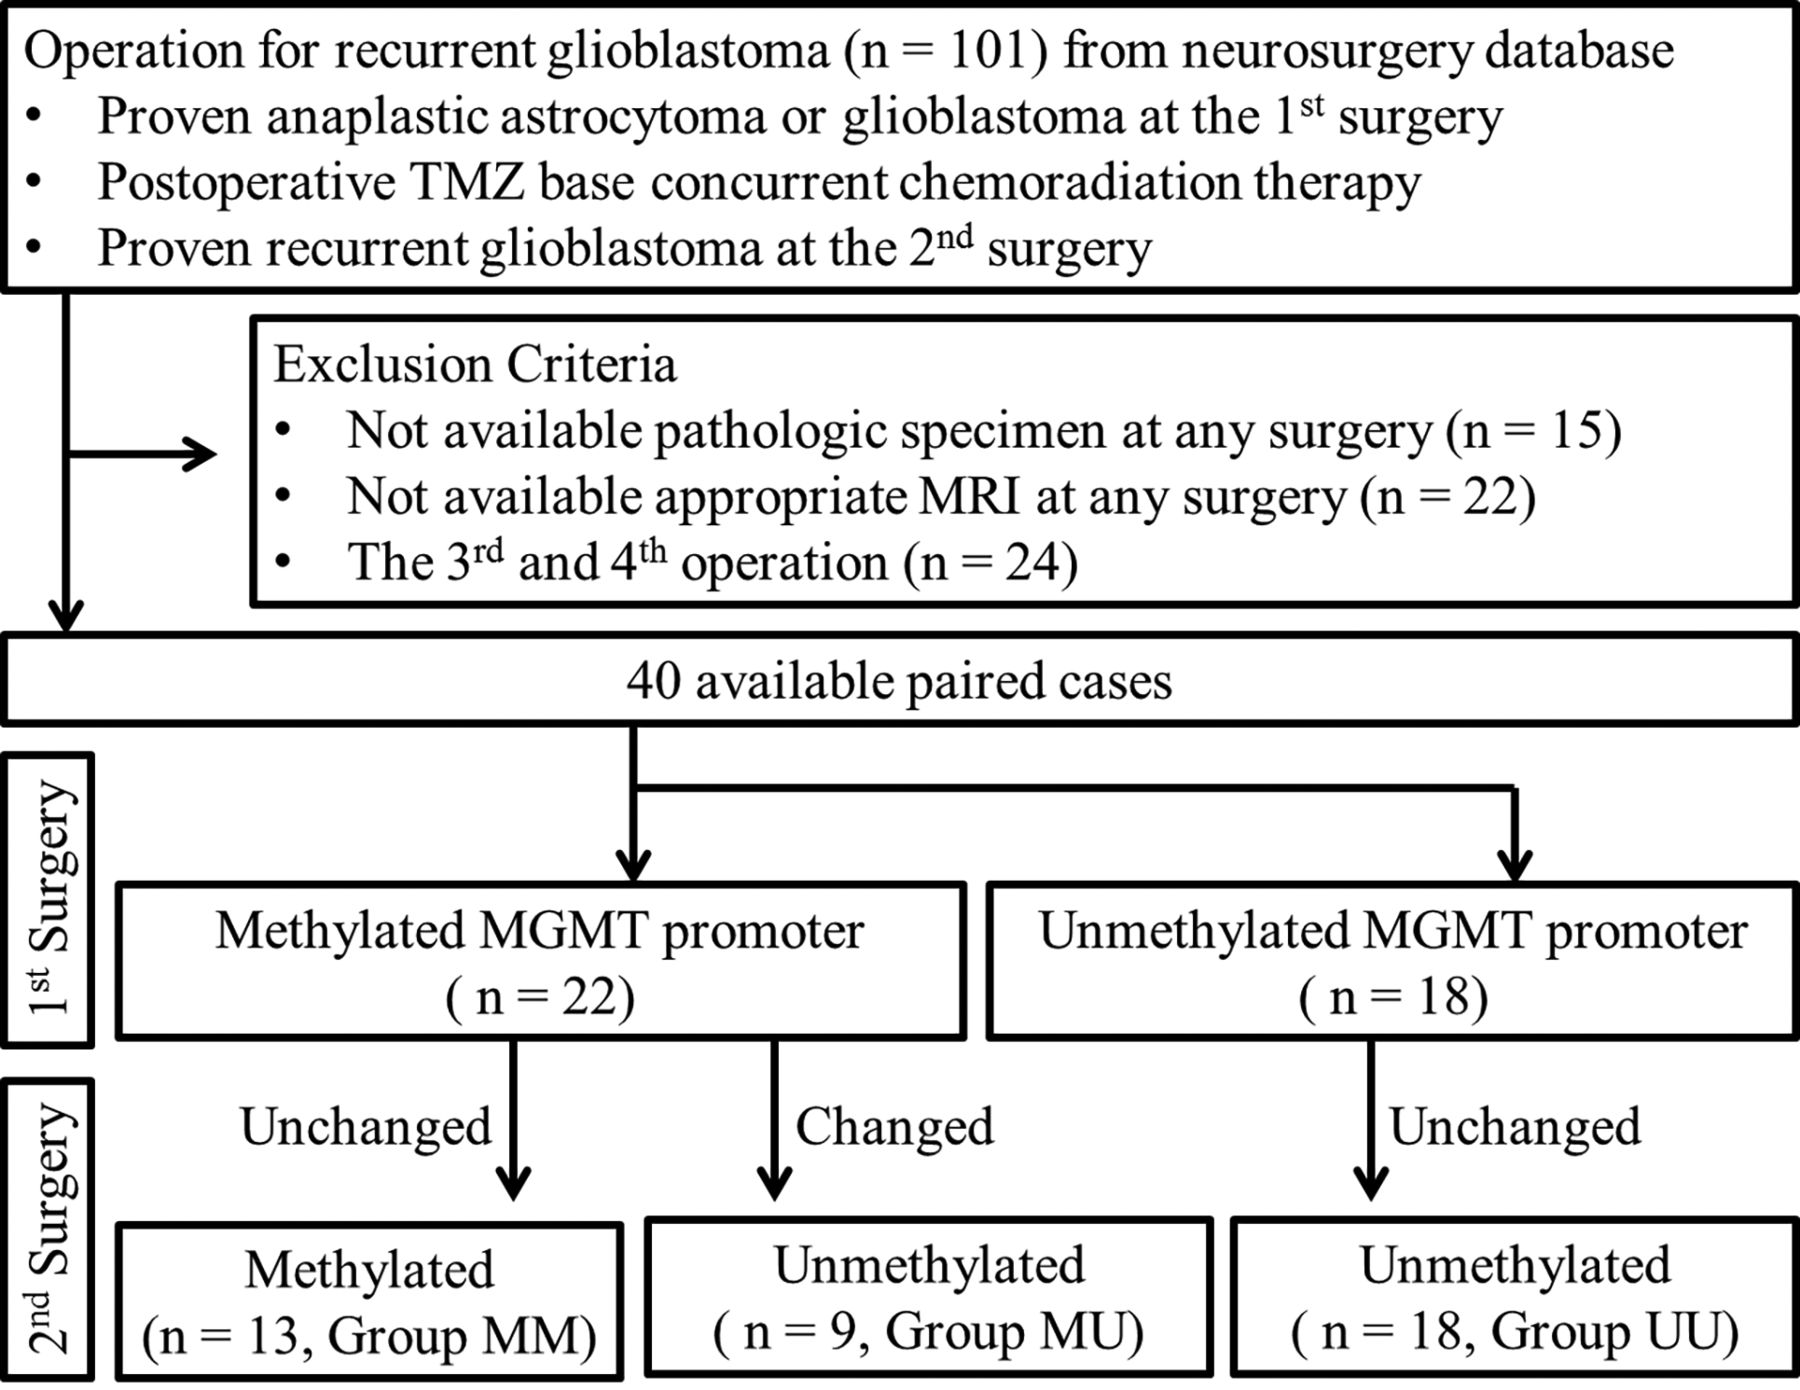
Study design.
Imaging Acquisition
A total of 80 MR images were obtained for 40 patients with 1.5T or 3T MR imaging scanners (3T Signa Excite [n = 11], 1.5T Signa HDxt [n = 17], and 1.5T Signa HDx [n = 1], GE Healthcare; 3T Verio [n = 45], 3T Magnetom Trio [n = 3], 3T Magnetom Skyra [n = 1], and 3T Biograph mMR [n = 1], Siemens; and 3T Ingenia [n = 1], Philips Healthcare) with variable channel head coils (8-, 16-, 32-, and 64-channel). Imaging sequences of the brain included spin-echo or gradient-echo T1WI, FSE T2WI, FLAIR T2WI, SWI, contrast-enhanced spin-echo or gradient-echo T1WI with gadobutrol (Gadovist; Bayer Schering Pharma) and DSC PWI. DWI was performed with a single-shot spin-echo EPI sequence in the axial plane with b-values of 0 and 1000 s/mm2. Using these data, we calculated ADC maps on a voxel-by-voxel basis with the software that was incorporated into the MR imaging unit. For DSC PWI, a single-shot gradient-echo EPI sequence was used. Sixty images were obtained in each section at intervals equal to the TR. After 4–5 time points, a bolus of gadobutrol at a dose of 0.1 mmol/kg of body weight and a rate of 4 mL/s was injected with an MR imaging–compatible power injector (Spectris; Medrad). The imaging parameters of the MR imaging scanners are shown in the Online Supplemental Data. Patients generally undergo MR imaging at presurgery, pre-CCRT, immediate post-CCRT, and continued follow-up. The first preoperative MR imaging for the initial tumor at presurgery and the second preoperative MR imaging at recurrence were reviewed (Online Supplemental Data).
Image Postprocessing and Analysis
Postprocessing and histogram analysis were performed with dedicated software, NordicICE and Nordic TumorEX (NordicNeuroLab), using the first preoperative and second preoperative MR images. Relative CBV (rCBV) was obtained with an established tracer kinetic model for the first-pass data.15,16 Realignment for minimizing motion, γ-variate fitting for reducing the recirculation effect, and correction of the dynamic curve for reducing the leakage effect were applied. To minimize variances in the rCBV in an individual patient, we normalized the pixel-based rCBV maps by dividing every rCBV value in a specific section by the value in the unaffected contralateral deep white matter.17 Normalized ADC (nADC) values were obtained using the same equation. Coregistrations between the contrast-enhanced T1WI and the rCBV maps and between the contrast-enhanced T1WI and the ADC maps were performed on the basis of geometric information stored in the respective datasets. The differences in section thickness between images were corrected automatically by re-slicing and coregistration, which were based on the underlying structural images. Two neuroradiologists (H.J.C. and S.H.C. with 6 and 15 years of experience in neuroradiology, respectively) manually defined the ROIs in consensus. To contain each complete enhancing tumor and avoid macrovessels and cystic, hemorrhagic, or necrotic portions, they drew ROIs on every tumor section on contrast-enhanced T1WI using a semiautomatic method with signal intensity thresholds and seed-growing. To obtain exclusively T2 hyperintense nonenhancing regions (NERs), we determined exclusion ROIs (based on FLAIR and ROIs based on contrast-enhanced T1WI) in the batch process.
After obtaining the total voxel values of the normalized rCBV (nrCBV) and nADC of each enhancing region and the NER of the tumor (Online Supplemental Data), we performed histogram analysis as follows: The mean, 90th percentile, and 95th percentile of nrCBV and the mean, 5th percentile, and 10th percentile of nADC of histogram values were calculated. The ratios of the nrCBV and nADC histogram values of the recurrent and initial tumors were calculated by (nrCBVrecurrent/nrCBVinitial) and (nADCrecurrent/ nADCinitial), respectively.
Selected conventional MR imaging features of the tumors were recorded by a neuroradiologist (H.J.C.) according to the Visually Accessible Rembandt Images (VASARI) feature scoring system for human glioma.18 Preoperative tumor volumes based on contrast-enhanced T1WI and FLAIR images were also measured.
Molecular/Genetic Analysis
Immunohistochemical staining was performed using a Bench Mark XT (automated immunohistochemical slide staining system; Roche Diagnostics). Immunohistochemistry was performed on individual whole block sections using antibodies against the IDH 1 R132H mutant protein (H09; Dianova, 1: 50). Sanger sequencing was used to analyze the frequency of IDH 1 and 2 mutations. Labeled locus-specific EGFR SpectrumOrange/CEP7 SpectrumGreen dual color probes (Abbott Molecular) were used to determine the status of the EGFR gene. MGMT-specific polymerase chain reaction using a methylation EZ Kit (https://www.qiagen.com/us/listpages/ez1-kits/) was used to evaluate the methylation status of the MGMT promoter.
Statistical Analysis
Data for each parameter were assessed for normality with the Kolmogorov-Smirnov test or Shapiro-Wilk normality test. The ANOVA and the Kruskal-Wallis test followed by post hoc tests were performed to compare histogram values among the 3 groups. Focusing on the initially methylated MGMT groups, we used independent t tests and Mann-Whitney U tests to compare group MM and group MU. Additionally, to evaluate the diagnostic performance of the imaging parameters, we performed receiver operating characteristic curve analysis, and the area under the curve was calculated to identify the optimal threshold for maximizing sensitivity and specificity. Additionally, multivariable logistic regression analysis was performed with statistically significant variables on univariable analysis. All statistical analyses were performed using R statistical and computing software (https://www.R-project.org) and MedCalc for Windows, Version 17.1 (MedCalc Software). A P value < .05 was considered statistically significant.
RESULTS
Clinical Characteristics
The clinical characteristics of the patients, including age, sex, IDH mutation status, EGFR fluorescence in site hybridization results (on primary and recurrent tumors), histopathology, surgical extent, first and second preoperative Karnofsky Performance Status scores, postoperative treatment, and radiation dose after the first operation were not significantly different among the 3 groups (Table 1).
Clinical characteristics of the patientsa
Histogram Analysis
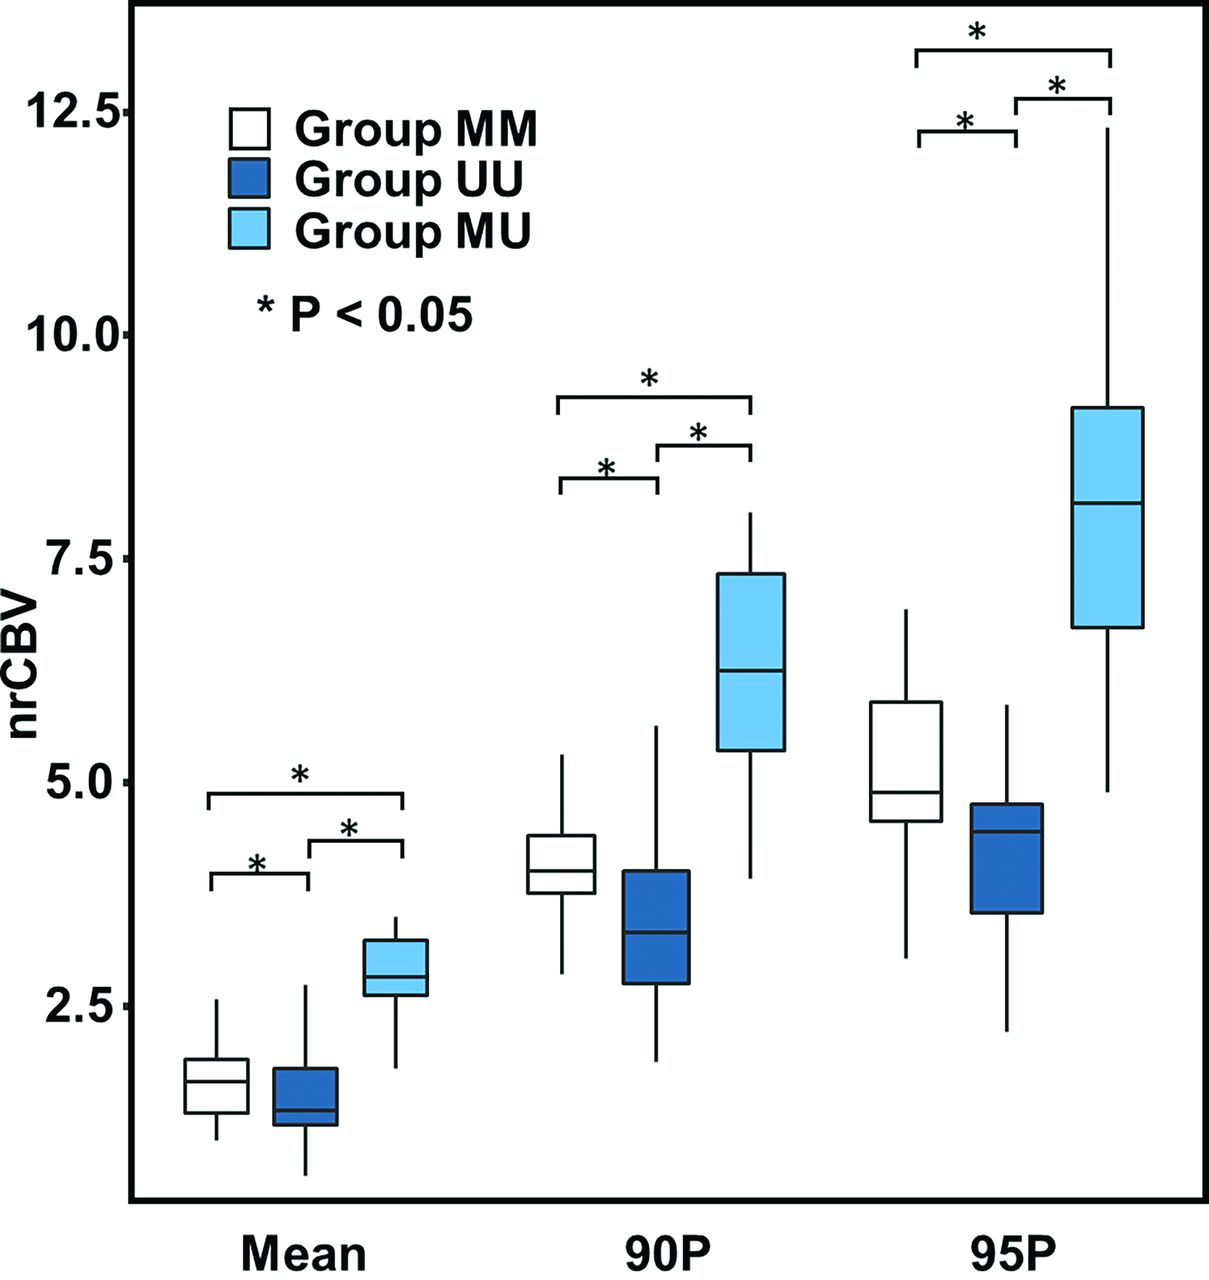
The mean, 90th percentile, and 95th percentile of the nrCBV values of the NER of the initial tumor were significantly higher in group MU than in group MM and group UU (P = 0.006, P = 0.001 and P < .001, respectively) (Online Supplemental Data and Figs 2 and 3). The mean nADC of the NER of recurrent tumors in group MU was significantly higher than that in group MM and group UU (P < .001) (Online Supplemental Data). In addition, the ratio of the mean nADC values of the NER was also significantly higher in group MU than in group MM and group UU (P < .001) (Online Supplemental Data). There was no statistically significant difference in the nrCBV or nADC values among the 3 groups in the enhancing region of the initial or recurrent tumors. There was no significant difference in the nADC values in the NER of the initial tumors among the 3 groups.

Comparison of nrCBV histogram parameters across each group of NER in the initial tumor. The mean, 90th percentile, and 95th percentile of the nrCBV values of the NER of the initial tumor were significantly higher in group MU than in group MM and group UU. Asterisks represent statistically significant differences among groups. 90P indicates the 90th percentile; 95P, the 95th percentile.

FLAIR images (A–C) and nrCBV maps (D–F) with corresponding cumulative histograms (G–I) for representative patients. A, D, G, A 34-year-old woman in group MM. B, E, H, A 37-year-old woman in group UU. C, F, I, A 32-year-old man in group MU. The histogram values (mean, 90th percentile, and 95th percentile) of the nrCBV in the NER of the tumors in group MU are higher than those in group UU or group MM.
Imaging feature trends through time for each group are demonstrated in the Online Supplemental Data.
Subgroup Analysis in Groups MM and MU
In the subgroup analysis, focusing on the initially methylated MGMT promoter groups (group MM versus group MU), there was no significant difference in the nADC or nrCBV values in the enhancing region of the initial tumors (Online Supplemental Data). In the NER of the initial tumors, the mean 90th percentile and 95th percentile values of the nrCBV were higher in group MM than in group MU (P = .002). For recurrent tumors, the nrCBV values in the NER were not significantly different among the 3 groups. In terms of the mean nADC value of the NER of recurrent tumors, group MU showed significantly higher values than group MM (P < .001).
Table 2 summarizes the diagnostic performance of the cumulative histogram nrCBV and nADC values for discriminating sustained MGMT methylation status (group MM) from changed MGMT methylation status (group MU) on the basis of the NER of the initial tumor. The mean histogram value of the nrCBV in the NER of the initial tumors showed the highest area under the curve (0.889, P < .001; 95% CI, 0.682–0.982). Multivariable logistic regression was performed with the statistically significant variables (mean, 90th percentile, and 95th percentile values of the nrCBV of the NER of initial tumors and mean value of the nADC of the enhancing region of recurrent tumors) on univariable analysis. Only the mean nrCBV value of the NER of the initial tumors was significant (OR = 9.53, P = 0.01; 95% CI, 1.575–57.703) in multiple logistic regression analysis.
Diagnostic performance of the nrCBV values for discriminating unchanged MGMT methylation status (group MM) from changed MGMT methylation status (group MU) on the basis of the NER of the initial tumor
Conventional Imaging Features and Volume Measurements among the 3 Groups
Several conventional imaging features based on the selected VASARI scale showed no significant differences among the 3 groups for initial and recurrent tumors (Online Supplemental Data). Only the enhancing volumes of the recurrent tumors of group UU were significantly larger than those of group MU (P = .03).
DISCUSSION
The results of the present study demonstrate that among patients with recurrent GBM, the histogram parameters of the nrCBV of the NER of tumors are higher for the group whose MGMT promoter methylation status changed from methylated to unmethylated than for the group whose MGMT promoter methylation status was unchanged (either methylated or unmethylated).
By repairing DNA damaged by alkylating agents such as TMZ, the MGMT protein is thought to provide resistance against the cytotoxic effect of the anticancer drug.19 In addition, silencing the MGMT gene by promoter methylation achieves a therapeutic effect by means of increasing sensitivity to alkylating agents.19 In routine diagnostics, the MGMT promoter methylation status has predictive and prognostic value.20 Many investigators have reported that MGMT promoter methylation status may change from that of the initial tumor when GBM recurs after treatment.3,6,7 This shift was also observed in in vitro experiments with patient-derived GBM cell lines.6,21 We found stability of MGMT promoter methylation in 31 of 40 patients (77.5%) from the first to the second operation. Nine of 40 (22.5%) patients showed changes in methylation status, which was slightly higher than that reported in the latest meta-analysis (71/476, 14.9%).22 However, the range of changes in MGMT promoter methylation is very wide, on the basis of the different methods and cutoff values and the presence of selection bias.22
Meanwhile, conventional and advanced imaging features in GBM based on MGMT promoter methylation have been studied by many researchers. Previous studies revealed that tumors with methylated MGMT promoters showed less aggressive imaging features, including less edema, higher ADC, and low CBV values.10,23⇓-25 However, conflicting results have also been reported, indicating that the imaging features of tumors with methylated MGMT promoters are not clearly distinguished from those with an unmethylated status.10,13,26⇓-28 As far as we know, there is no previous work analyzing the imaging features associated with MGMT promoter methylation changes after standard treatment.
In the present study, we focused on the imaging features of initial and recurrent tumors after treatment according to the change in the MGMT promoter methylation status. There was no significant difference in the nADC or nrCBV values among the groups in the enhancing region of initial or recurrent tumors. However, in the NER of initial tumors, the nrCBV values were higher in group MU than in the other groups. The importance of the NER in GBM is increasing in diagnostics, treatment, and prognosis.29⇓⇓⇓⇓-34 In a recent study, the rCBV of the NER was a significant prognostic biomarker, independent of morphologic features in GBM.35 In addition, the volume transfer constant in the NER could be a potential prognostic imaging biomarker in GBM.36,37 Blood perfusion in the tumor and surrounding tissue may be related to the chemotherapeutic agent in drug delivery.38 Yoo et al39 reported that an enhancing lesion with a low volume transfer constant and ve (volume of extravascular extracellular space) was more likely to progress because of its low permeability or leakiness of the BBB, in which the delivery of TMZ to viable tumor cells might be less effective during standard treatment. A recent study about the combination of tumor perfusion and MGMT promoter methylation indicated a potential interaction effect in the treatment of recurrent GBM with TMZ.38 The authors hypothesized that GBM contains immature vessels from neoangiogenesis, which may influence drug delivery to the tumor cells. Given that the therapeutic strategy of TMZ involves reduction of MGMT activity,40 it could be assumed that higher nrCBV in the NER of the tumor could be related to depleting the methylated MGMT. Further studies are necessary to evaluate whether epigenic alterations during the clinical course of the disease are related to the perfusion feature of the remaining tumor burden.
In recurrent GBM, treatment strategies are less established.41 Systemic chemotherapy is one option for treatment, but no chemotherapeutic agents showed major differences in efficacy. Nevertheless, TMZ rechallenge in patients with MGMT promoter methylation is a reasonable option.38 In patients with an unmethylated MGMT promoter, another treatment option can be suggested according to the results from the recurrent tumor.42 PWI provides information on nrCBV in a noninvasive manner, and we suggest that it should be considered in deciding the follow-up duration or treatment option for patients with higher mean nrCBVs in the NER of primary tumors with MGMT promoter methylation. The clinical impact and imaging features should be further investigated.
This study has some limitations, including its retrospective nature and small cohort size. First, because different scanners were used to acquire MR imaging data, there was inherent heterogeneity in the raw data and postprocessing steps. To overcome this limitation, we used normalized values for the CBV and ADC values to standardize the data and postprocessing leakage correction to obtain the CBV values. Second, the evaluation of MGMT promoter methylation with an MGMT-specific polymerase chain reaction has some technical issues.43 Furthermore, hemimethylated promoters were not considered in the MGMT evaluation.43 Nevertheless, MGMT-specific polymerase chain reaction is a widely accepted method with a significant correlation with MGMT activity.9 Third, the results of MGMT promoter methylation status were tested in surgical specimens obtained primarily from enhancing tumors. There have been reports about differences in MGMT promoter methylation and expression, depending on the sampling area in the GBM.44 However, MGMT promoter methylation is usually seen as homogeneous within the tumor.45 We did not examine serial sections of the tumor, hypothesizing that MGMT promoter methylation in the specimens was homogeneous. Further studies are needed to address the issue of intratumoral heterogeneity in MGMT promoter methylation. Fourth, 3 anaplastic astrocytomas were included in the first operation. The inclusion criteria were patients with recurrent glioblastoma who had primarily surgery and TMZ-based CCRT followed by adjuvant TMZ. Therefore, 3 anaplastic astrocytomas were included in the first operation. We re-tested after removal of the 3 cases and found that there was no significant change in the results (Online Supplemental Data).
CONCLUSIONS
MGMT promoter methylation status might change in recurrent GBM after standard treatment. The nrCBV values of the NER at the first preoperative MR imaging were higher in the MGMT promoter methylation change group from methylation to unmethylation in recurrent GBM.
Footnotes
This study was supported by a grant from the Korea Healthcare Technology R&D Projects, Ministry for Health, Welfare & Family Affairs (HI16C1111); the Brain Research Program through the National Research Foundation of Korea funded by the Ministry of Science, ICT and Future Planning (NRF-2016M3C7A1914002); National Research Foundation of Korea funded by the Korea government (MSIT) (NRF-2020R1G1A11027701); the Basic Science Research Program through the National Research Foundation of Korea funded by the Ministry of Science, ICT and Future Planning (NRF-2020R1A2C2008949 and NRF-2020R1A4A1018714); the Creative-Pioneering Researchers Program through Seoul National University; and the Institute for Basic Science (IBS-R006-A1).
Disclosures: Seung Hong Choi—RELATED: Grant: governmental grants.* Chul-Kee Park—UNRELATED: Employment: Seoul National University Hospital. *Money paid to the institution.
Indicates open access to non-subscribers at www.ajnr.org
References
- Received July 28, 2020.
- Accepted after revision November 16, 2020.
- © 2021 by American Journal of Neuroradiology


Jump to section
Related Articles
Cited By...
- No citing articles found.