
Abstract
BACKGROUND AND PURPOSE: The incidence of cerebral hyperperfusion and hypoperfusion, respectively, resulting from hypercapnia and hypocapnia in hospitalized patients is unknown but is likely underrecognized by radiologists and clinicians without routine performance of quantitative perfusion imaging. Our purpose was to report the clinical and perfusion imaging findings in a series of patients confirmed to have hypercapnic cerebral hyperperfusion and hypocapnic hypoperfusion.
MATERIALS AND METHODS: Conventional cerebral MR imaging examination was supplemented with arterial spin-labeled (ASL) MR perfusion imaging in 45 patients during a 16-month period at a single institution. Patients presented with an indication of altered mental status, metastasis, or suspected stroke. Images were reviewed and correlated with arterial blood gas (ABG) analysis and clinical history.
RESULTS: Patients ranged in age from 1.5 to 85 years. No significant acute findings were identified on conventional MR imaging. Patients with hypercapnia showed global hyperperfusion on ASL cerebral blood flow (CBF) maps, respiratory acidosis on ABG, and diffuse air-space abnormalities on same-day chest radiographs. Regression analysis revealed a significant positive linear relationship between cerebral perfusion and the partial pressure of carbon dioxide (pCO2; β, 4.02; t, 11.03; P < .0005), such that rates of cerebral perfusion changed by 4.0 mL/100 g/min for each 1-mm Hg change in pCO2.
CONCLUSIONS: With the inception of ASL as a routine perfusion imaging technique, hypercapnic-associated cerebral hyperperfusion will be recognized more frequently and may provide an alternative cause of unexplained neuropsychiatric symptoms in hospitalized patients. In a similar fashion, hypocapnia may account for a subset of patients with normal MR imaging examinations with poor ASL perfusion signal.
Hypercapnia has been long known as a potent stimulator of cerebral blood flow (CBF) through its vasodilatory effect on cerebral vasculature.1–6 Gas mixtures with elevated concentrations of carbon dioxide (CO2) are commonly used in both the research and clinical settings to evaluate cerebrovascular reserve, most frequently in patients with stenotic or occlusive cerebrovascular disease before extracranial-to-intracranial bypass.2,7,8 Even small increases in the partial pressure of CO2 (pCO2) on the order of 5 to 6 mm Hg are capable of generating appreciable changes on perfusion imaging.3,4,7–13 Techniques such as transcranial Doppler, nuclear medicine positron-emission tomography (PET) and single-photon emission CT, angiography, phase-contrast MR imaging, and arterial spin-labeled (ASL) MR perfusion have been used to evaluate the experimental hypercapnic effect on cerebral perfusion.4,7,11–23 It is not uncommon that hospitalized patients can have marked increases in pCO2 in excess of 30 mm Hg from baseline, both on an acute or on a chronic basis. In a similar fashion, hyperventilation may produce marked hypocapnia.24 The effect of substantial hypercapnia and hypocapnia on clinical MR perfusion imaging has not been characterized. Our purpose was to report the clinical and perfusion imaging findings in a series of patients confirmed to have hypercapnic cerebral hyperperfusion and hypocapnic hypoperfusion.
Materials and Methods
Pulsed ASL was performed in 7000 consecutive clinical MR imaging examinations from December 2006 through April 2008. We retrospectively identified patients with a clinical history of altered mental status, stroke, headache, or seizure who had at least 1 arterial blood gas (ABG) obtained within 40 hours (mean, 12.9 hours) of the MR imaging examination. Patient exclusion criteria included any territorial infarct, anoxic injury, or other significant intracranial pathologic condition that could alter global gray matter perfusion values. Patient data including clinical history, ABG measurements, and average gray matter CBF (mL/100 g tissue/min) were correlated with conventional imaging findings. The institutional review board at Wake Forest University approved this retrospective study.
We generated quantitative CBF maps using quantitative imaging of perfusion using a single subtraction with thin-section TI1 periodic saturation (QUIPSS II TIPS a.k.a. Q2TIPS) with a flow-sensitive alternating inversion recovery sequence as described previously.25 In brief, this sequence generates 60 tag and control image pairs. Imaging parameters were TE, 28 ms; TI1, 800 ms; TI1s, 1200 ms; TI, 2000 ms; TR, 3000 ms; receiver bandwidth, 62.5 kHz; flip angle, 90°; FOV, 24 cm (frequency) × 18 cm (phase); acquisition matrix, 64 × 48 (11 sections, 8-mm thickness, 0-mm section gap); and frequency encoding direction anterior/posterior. The sequence was performed with use of Signa Excite HD scanners (GE Healthcare, Milwaukee, Wis) at field strengths of 1.5 and 3T. A diffusion gradient with an equivalent b-value of 5.25 mm2/s was added to suppress intra-arterial spins.26 Total acquisition time was 6.5 minutes. Perfusion images were generated with use of a previously described fully automated data processing pipeline.27 These steps are performed by distributed grid processing with the Sun Grid Engine (Sun Microsystems, Santa Clara, Calif). The control and label images are corrected for motion and then subtracted to generate the relative perfusion signal intensity maps. The perfusion maps are automatically segmented into CSF, gray matter (GM), and white matter with SPM5 (statistical parametric mapping)28 on the basis of the high-resolution anatomic T1-weighted image and then scaled by the mean signal intensity (M0) of blood.29 The segmentation and scaling step allows for voxel-wise computation of absolute CBF maps. The perfusion maps are colorized with use of a standard scale, and a JPEG of the resulting image series is generated. The segmentation map is applied to the CBF data to generate mean gray matter CBF values for the volume of acquisition.
Statistical Analysis
Patients were separated into hypercapnic (pCO2 > 45 mm Hg), normocapnic (pCO2 < 45 mm Hg and > 35 mm Hg), and hypocapnic (pCO2 < 35 mm Hg) groups. Each demographic variable (patient age, latency between ABG and MR imaging, and hematocrit [HCT]) was analyzed via 1-way analysis of variance (ANOVA), with use of group (hypercapnia, normocapnia, hypocapnia) as the independent variable. A χ2 analysis was conducted to assess between-group differences in sex. One-way multivariate analysis of variance (MANOVA) was conducted with use of group (hypercapnia, normocapnia, hypocapnia) as the independent variable and ABG data (pCO2, pH, O2, HCO3) and mean GM cerebral perfusion as dependent variables. Bonferroni adjusted post hoc analyses were subsequently conducted to evaluate between-group differences revealed by MANOVA. The hypercapnic subjects were then parceled into acute hypercapnia (pH < 7.35; n = 10) and chronic hypercapnia (pH > 7.35; n = 6) groups, and an independent-samples t test was conducted to compare between-group rates of CBF. Finally, regression analysis was conducted with use of GM cerebral perfusion as the dependent variable and pCO2 as the independent variable to calculate the linear relationship between GM cerebral perfusion and pCO2. All statistical analyses were performed with the Statistical Package for the Social Sciences 16.0 (SPSS, Chicago, Ill).
Results
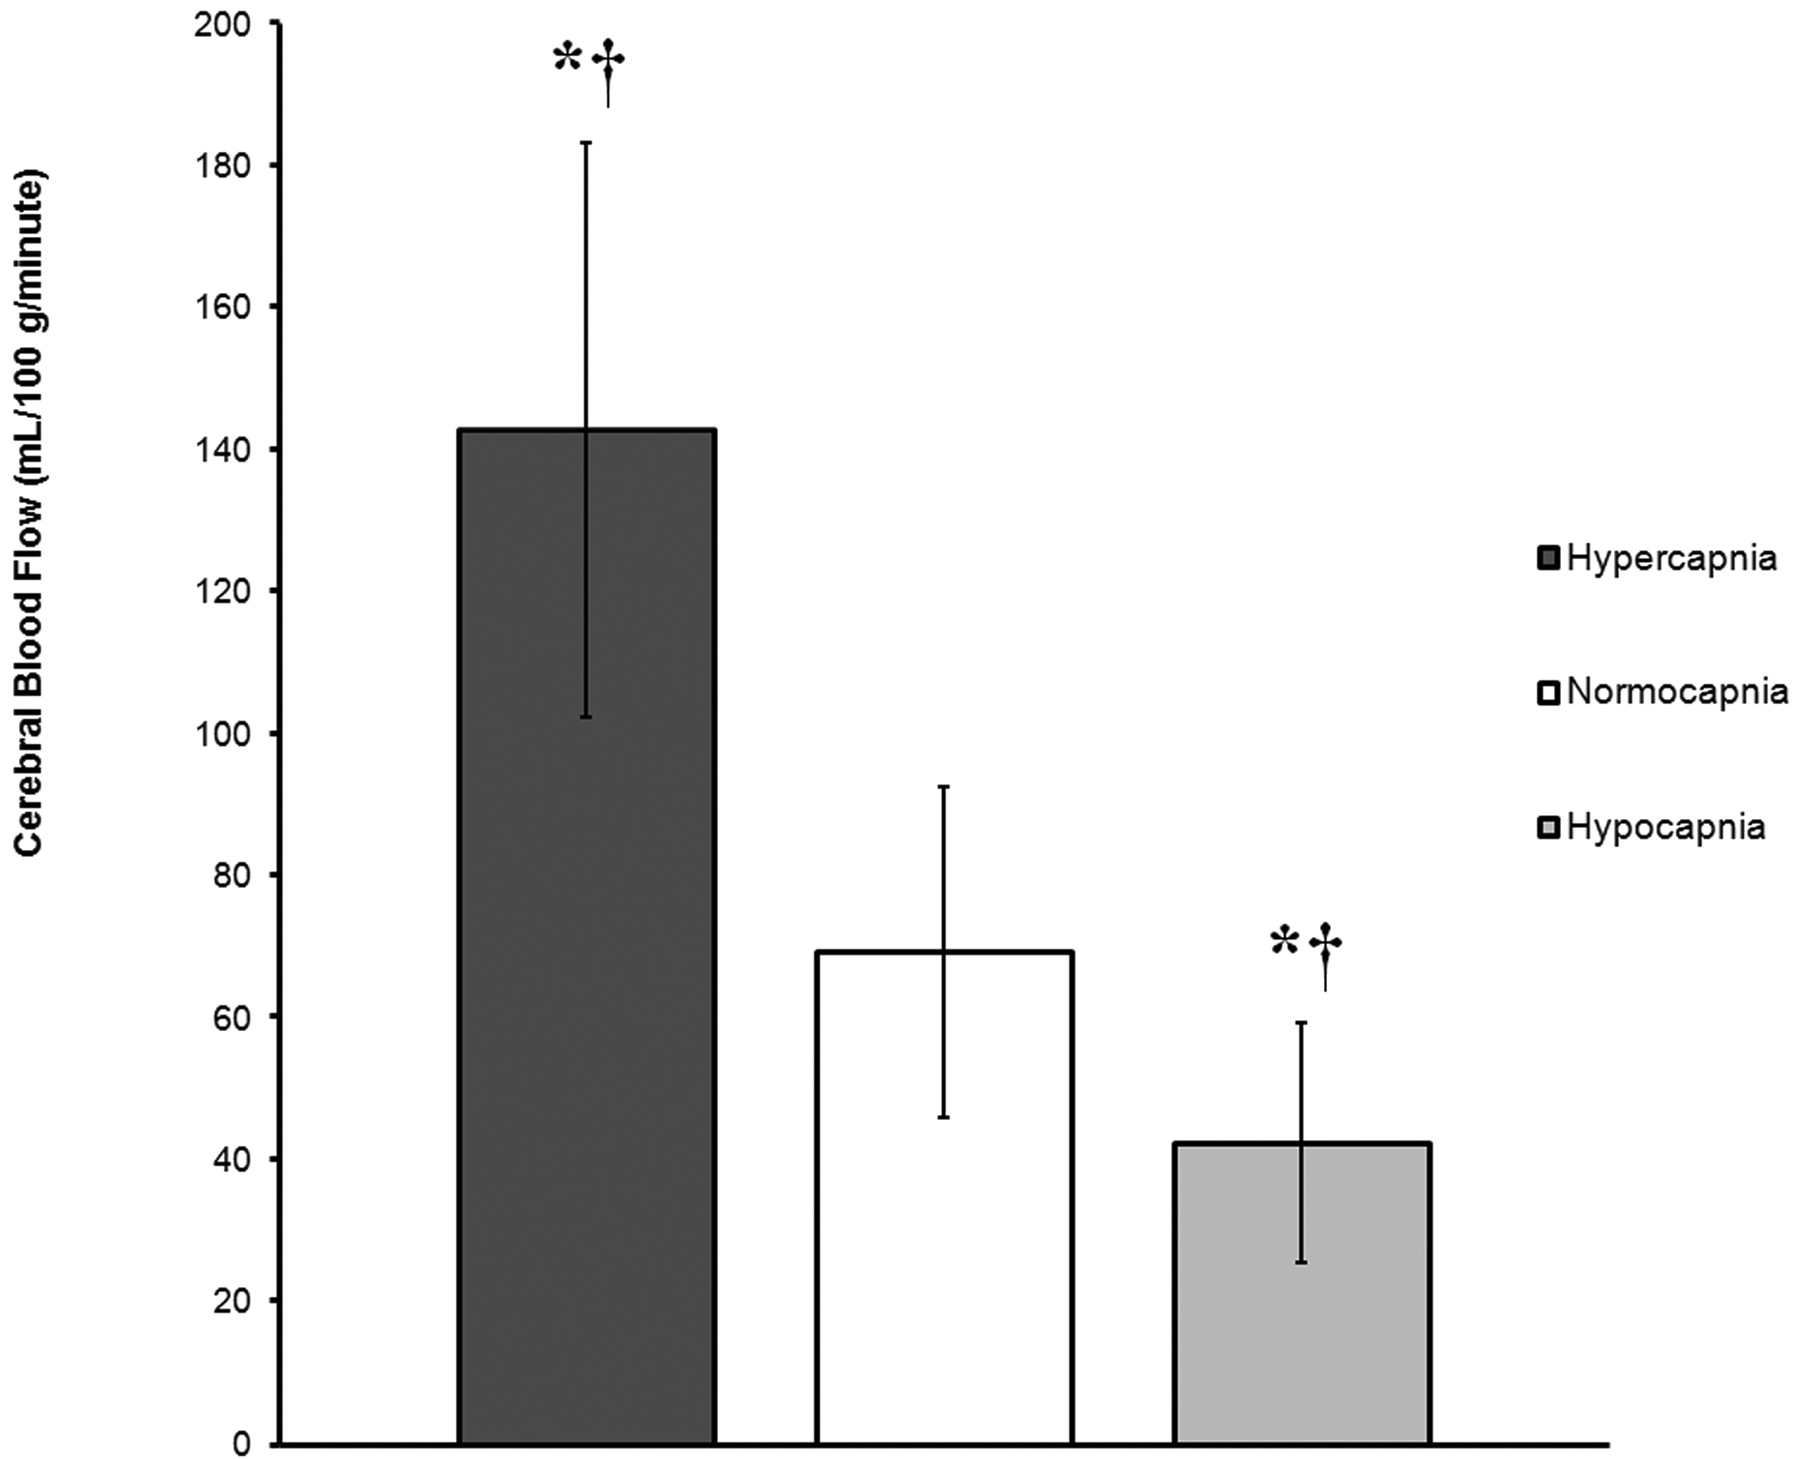
A total of 45 patients (mean age, 55.7 years; range, 1.5–85 years) were identified with a history of altered mental status, stroke, and headache who had ABG measurements within 40 hours of MR imaging examination. Three patients were also excluded because of severe motion artifacts or technical failures. The average time between the ABG and perfusion imaging was 11.3 hours. Hypercapnic, normocapnic, and hypocapnic pCO2 measurements obtained by ABG near the time of imaging averaged 54.4, 39.8, and 31.6 mm Hg, respectively. Average GM CBF for the 14 normocapnic patients was 69.3 ± 23.3 ranging from 27.9 to 107.3 (mL/100 g tissue/min) (Fig 1). Conventional imaging showed no abnormality for 39 of the 45 patients. Four patients had single punctate infarcts, 1 patient had a single 5-mm metastatic focus, and 1 patient had mild multiple sclerosis. Average gray matter CBF for the 15 hypocapnic patients was 42.5 ± 16.9 ranging from 23.1 to 76.1 (mL/100 g tissue/min) (Fig 2). Average gray matter CBF for the 16 hypercapnic patients was 142.8 ± 40.4 ranging from 83.3 to 220 (mL/100 g tissue/min) (Fig 3). Chest radiography showed atelectasis, pulmonary edema, and emphysema most commonly in the hypercapnia group.

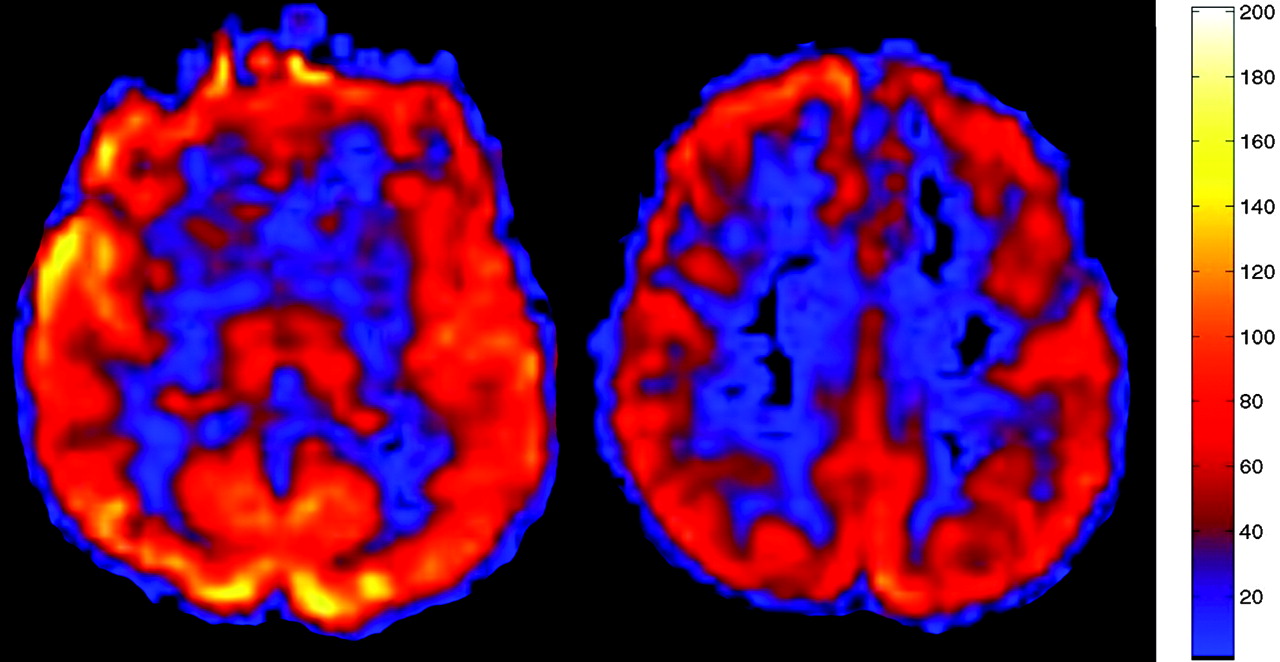
Typical clinical ASL map for a normocapnic 57-year-old patient with mild age-related degenerative changes. Normal CBF is depicted throughout GM with a GM CBF mean of 62.9 mL/100 g/min. The pCO2 measured 38.8 mm Hg.
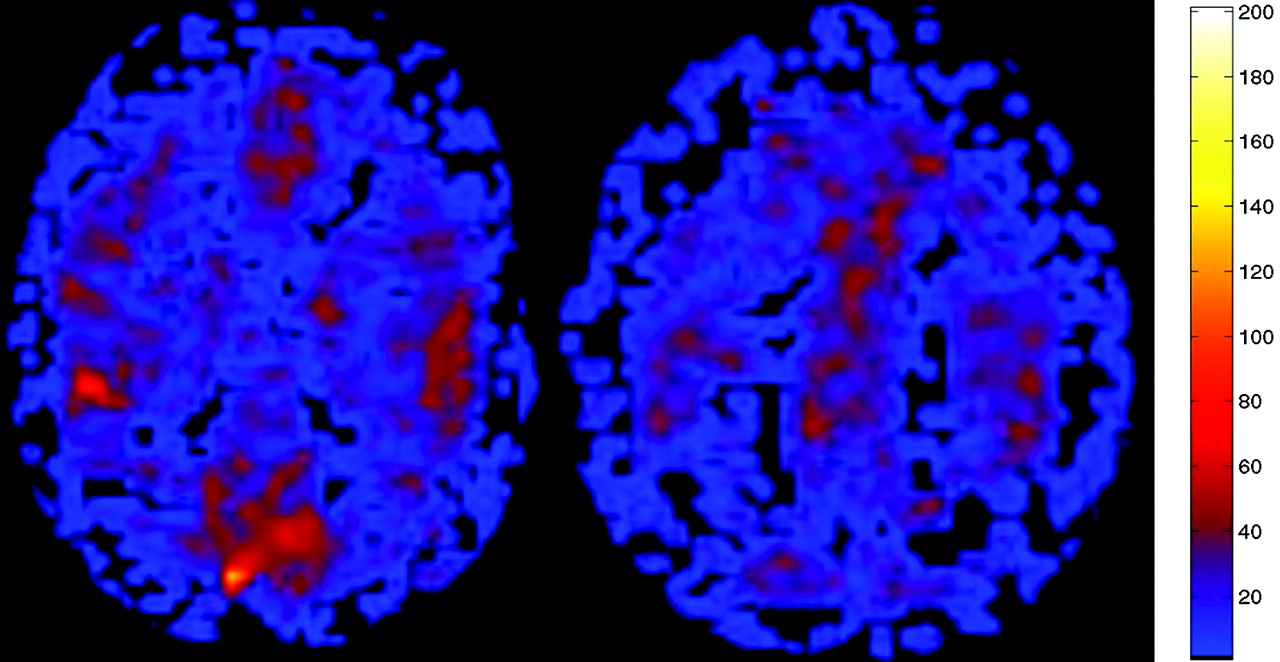
ASL CBF perfusion map in a hypocapnic 58-year-old patient suspected of having an acute infarct. No abnormality was detected on conventional imaging, but the patient had marked global hypoperfusion (mean GM CBF, 25.5 mL/100 g/min). ABG showed pCO2 of 34.4 mm Hg.
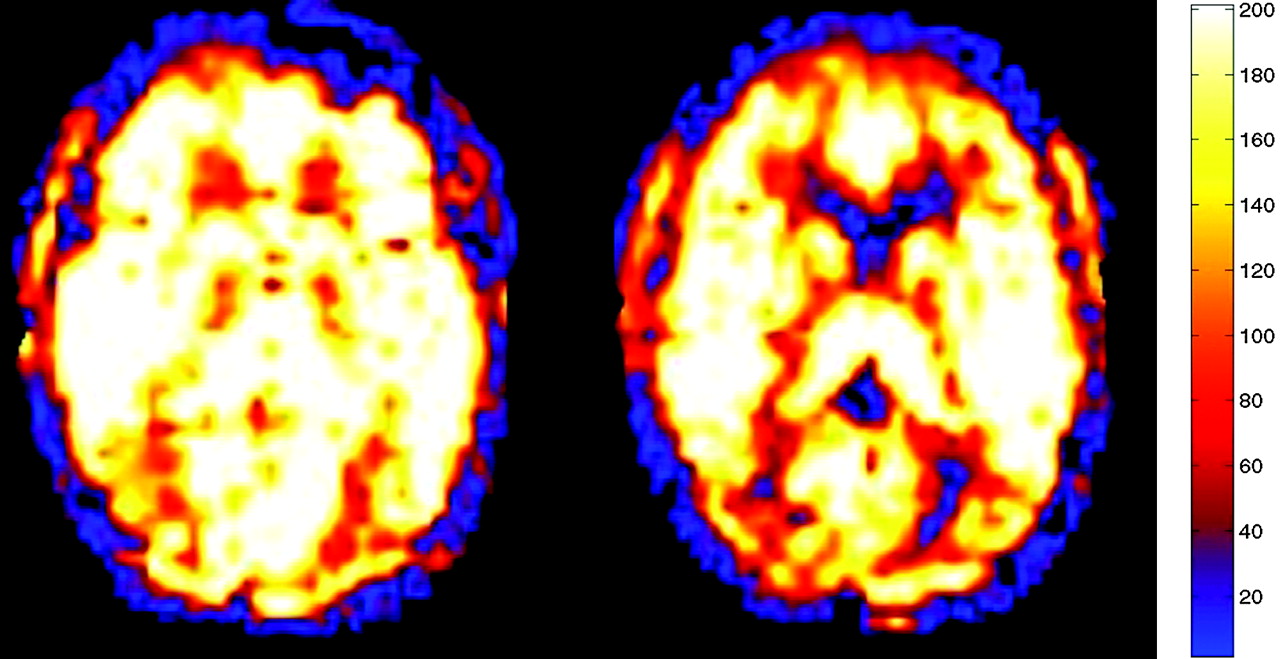
ASL CBF map performed as part of the MR imaging examination demonstrated markedly increased blood flow in all GM and white matter structures consistent with global hyperperfusion (mean GM CBF, 175.2 mL/100 g tissue/min). Chest radiograph from the same date was significant for emphysema, and ABG analysis revealed a pCO2 of 56.3 mm Hg (normal range, 35–45 mm Hg).
Demographic characteristics are presented in Table 1. There was no statistically significant difference in sex distribution between the hypercapnia, normocapnia, or hypocapnia groups [χ2 (1) = 1.98; P = .372]. ANOVA revealed no main effect of group for patient age [F (2,42) = 1.10; P = .344] or latency between MR imaging and ABG [F (2,42) = 0.832; P = .442]. However, there was a main effect of group for HCT [F (2,42) = 4.21; P = .021]. Post hoc comparisons with the Tukey HSD test revealed a statistically significant decrease in HCT level in the hypercapnia group compared with the normocapnia group (P = .018). There was no statistically significant difference in HCT level between the hypocapnia and normocapnia groups (P = .570) or hypocapnia and hypercapnia groups (P = .167).
Summary of demographic characteristics
Patient clinical and perfusion data
MANOVA demonstrated a main effect of group, indicating a statistically significant difference between the hypercapnic, normocapnic, and hypocapnic groups on the combined dependent variables (pCO2, pH, O2, HCO3, GM cerebral perfusion) [F(10,76) = 17.0; P < .0005; Wilks Lambda = 0.10; partial eta squared = 0.69]. When the dependent variables were considered separately with a Bonferroni adjusted alpha level of 0.001, statistically significant group differences were identified for pCO2, pH, HCO3, and GM cerebral perfusion, as follows: pCO2 [F(2,41) = 67.55, P < .0005; partial eta squared = 0.76], pH [F(2,41) = 28.07, P < .0005; partial eta squared = 0.57], HCO3 [F (2,41) = 11.08, P < .0005; partial eta squared = 0.35], and GM cerebral perfusion [F (2,41) = 49.52, P < .0005; partial eta squared = 0.70]. There was, however, no statistically significant group difference in measures of ABG percent O2 saturation [F (2,41) = 0.15, P = .858; partial eta squared = 0.007]. Bonferroni adjusted post hoc analyses were subsequently conducted to determine which groups differed from one another with regard to the dependent measures (Table 1) (Fig 4).

Graph demonstrates global rates of CBF (mL/100 g/min) in GM, expressed as mean ± SD, for 3 groups (hypercapnia, normocapnia, and hypocapnia) on the basis of ABG measures of pCO2. The asterisk (*) indicates a statistically significant difference from the normocapnia group. The cross (†) indicates a statistically significant difference between the hypercapnia and hypocapnia groups. Global rates of CBF are 106.1% higher in the hypercapnia group and 38.6% lower in the hypocapnia group compared with normocapnic control subjects.
Statistically significant increases in pCO2 (P < .0005), HCO3 (P = .003), and GM cerebral perfusion (P < .0005) were identified for the hypercapnic group compared with the normocapnic group. A statistically significant decrease in pH (P = .011) was identified for the hypercapnic group compared with the normocapnic group. Statistically significant decreases in pCO2 (P = .001) and GM cerebral perfusion (P = .049) were identified for the hypocapnic group compared with the normocapnic group. A statistically significant increase in pH (P = .0005) was identified for the hypocapnic group compared with the normocapnic group. No statistically significant difference was identified in HCO3 (P = 1.00) for the hypocapnic group compared with the normocapnic group. Finally, a statistically significant difference was identified between the hypercapnic and hypocapnic groups for pCO2 (P < .0005), HCO3 (P = .0005), pH (P < .0005), and GM cerebral perfusion (P < .0005).
An independent-samples t test was conducted to compare rates of CBF between a group of 6 patients with chronic acidosis and a group of 10 patients with acute respiratory acidosis. There was no statistically significant difference in rates of CBF between the acute (mean ± SD; 145.8 ± 47.5) and chronic (mean ± SD; 138.8 ± 32.3) respiratory acidosis groups [t(14) = 0.676; P = .51]. Furthermore, the magnitude of the differences between the means was relatively small (eta squared = 0.030).
Regression analysis was conducted to calculate the linear relationship between pCO2 and GM cerebral perfusion with use of GM perfusion as the dependent measure and pCO2 as the independent variable. Regression analysis revealed a significant positive linear relationship between cerebral perfusion and pCO2 [β = 4.02, t = 11.03; P < .0005], such that rates of cerebral perfusion changed by 4.0 mL/100 g/min for each 1-mm Hg change in pCO2 (Fig 5). A statistically significant proportion of the variance (73%) associated with cerebral perfusion was explained by pCO2 [R2 = 0.73, F(1, 43) = 121.60; P < .0005].

Graph of percent change versus pCO2 for all groups shows a strong linear relationship between global GM CBF and pCO2 with slight differences between male (red) and female (blue) patients.
Discussion
Hypercapnia, or an elevated pCO2, can cause vasodilation when cerebral perfusion autoregulation pathways are intact.1–6 The precise vasodilatory mechanism of CO2 in humans is still being refined.5,6,30,31 Animal studies have shown hypercapnia activates KATP channels in vascular smooth muscle, causing vasodilation.32 Animal models have also suggested that nitric oxide plays a role in hypercapnic vasodilation.2,30 However, human studies have shown that hypercapnia acts independently of nitric oxide to produce elevated CBF.33 Animal and human studies have both demonstrated significant CBF increases in response to hypercapnia.5–7,12,13,16–18,33–39 This reaction has been exploited with tests such as the hypercapnia challenge to evaluate cerebrovascular reserve.2,7,8 Previous human studies demonstrated up to a 200% increase in CBF as pCO2 was raised experimentally.3,4,8–13,35 However, a blunted hypercapnic response in elderly subjects has been shown during experimentally induced hypercapnia.11,36,40–44 The impaired vasodilatory response with aging may be related to sclerotic changes in the arterial wall or baseline oxyhemoglobin concentrations.11,17,36,40–43,45 Almost our entire hypercapnic population was older than 55 years; thus, no direct comparisons between younger patients can be made. Our patients had a 6.7% increase in CBF (assuming mean CBF value of 60 mL/100 g/min) per 1-mm Hg rise in pCO2. This is comparable to previously published values (in a younger experimental population), which had a 5.8% CBF increase per 1-mm Hg rise in pCO2 with use of similar ASL techniques12,13 and a 6.0% CBF increase per 1-mm Hg rise in pCO2 with PET.18 In addition, men and women have been reported to have different responses to hypercapnia.5,31,36,40,46 It has been proposed that this dissimilarity may be related to different prostaglandin levels in men and women.31,46 When men and women were analyzed separately, a trend was noted suggesting that women are more resistant to changes in pCO2. The men in our study had a 7.4% increase in CBF for each 1-mm Hg increase in pCO2. Women showed a 6.3% increase in CBF for each 1-mm Hg increase in pCO2 (Fig 5). This difference between men and women is consistent with previous reports but should be evaluated further with a larger study.
Transcranial Doppler, nuclear medicine PET or single-photon emission CT, angiography, and ASL perfusion MR imaging have been used to evaluate the experimental change in cerebral perfusion with hypercapnia.4,7,11–22 Most experimental studies of hypercapnia increase pCO2 through rebreathing techniques or 5% CO2 air mixtures. These methods result in a mild increase in pCO2 of approximately 5 to 8 mm Hg. In contrast, our clinical hypercapnic population reached values up to 30 mm Hg above normal.
Acute respiratory acidosis results from increased pCO2 in cases of acute respiratory failure. Common causes include pulmonary edema, asthma, chronic obstructive pulmonary disease, and drug overdose.47 Most of the hypercapnic patients in our series demonstrated acute respiratory acidosis (pH < 7.35) on ABG (n = 10). Human experiments with brief exposures (up to 1 hour) to mild amounts of hypercapnia (5% CO2) revealed no adaptive mechanisms to suppress reactive CBF elevation.15,35,37,39 However, previous animal and human data have shown that the cerebral circulation adapts to chronic sustained hypercapnia for more than 6 hours because of normalization of the CSF pH secondary to increased CSF bicarbonate levels.34,39,47–51 Our data showed no statistically significant difference in CBF between the acute and chronic respiratory acidosis groups. This result may indicate a physiologic CSF pH compensation limit.
When present, hypoxia (partial pressure of oxygen < 80 mm Hg) can confuse and compound the hypercapnic CBF relationship because hypoxia also increases CBF.5,12,15,30 ASL techniques have shown a 7% CBF increase per 10% decrease in arterial oxygenation (partial pressure of oxygen).12 One of 2 patients with a partial pressure of oxygen of less than 50 mm Hg had a lower-than-expected CBF value given the degree of hypoxia and hypercapnia. The 8-hour interval from ABG to MR imaging perfusion may account for the unexpected findings in this case. Although hypoxia can increase CBF, experimental hyperoxia showed a small trend toward CBF decrease.52,53 There was no statistically significant group difference in measures of ABG percent oxygen saturation in this study.
Anemia can increase the T1 of blood and could theoretically increase the ASL perfusion signal intensity.54,55 The T1 values of blood are assumed for pulsed arterial spin-labeling (PASL) quantification; thus, entities that can alter the T1 of blood such as anemia or gadolinium may cause perfusion quantification errors.29,56 In our study, HCT values obtained within 24 hours of the MR imaging scan showed a weak correlation (R2 = 0.097), with a trend toward higher CBF measurements for patients with more anemia. Despite the statistically significant difference between HCT in the hypercapnic and normocapnic groups, the actual clinical difference was minimal (29.3 vs 34.2). Although likely not clinically significant, the anemia effect would need a larger study to adequately characterize the significance of the quantification errors attributable to HCT. Calculations predict an approximately 10% to 15% increase in CBF quantification because of changes in blood T1 values if HCT decreases from 41 to 21.
One limitation of this study is that the ABG was not obtained during the MR imaging examination. Animal models have shown a rapid CBF increase in response to acute hypercapnia with a time to peak of 4.5 to 6 s.15,21 In a similar fashion, when hypercapnia resolves, there is a rapid restoration of normal CBF.15,21,35 The sensitivity of CBF to hypercapnia and the delay from ABG to perfusion imaging may account for some of the variability in the data.
One potential limitation would include the sedation used for ventilator-dependent patients. However, the opioid influence on the hypercapnic response was evaluated by Pattinson et al,19 who found that opioids did not modulate the vascular reactivity with regard to blood oxygen level–dependent functional MR imaging signal intensity changes.
ASL is susceptible to arrival time issues with regard to quantification. In cases of very slow flow, signal intensity may be lost because of T1 decay or gradient suppression if the tag is still in the vasculature.29 Our technique mitigates the effects of arrival time by delaying the inversion time to 2 s. Also, use of global GM perfusion values rather than regions of interest avoids regional-perfusion influences of the watershed territories.
There are physiologic limits to the hypercapnic CBF reflex. Animal models have shown pCO2 levels of 80 mm Hg to be the upper limit of maximal hypercapnic vasodilation. Increasing pCO2 beyond this level did not further increase CBF values.57–59 In a similar fashion, just as hypercapnia can increase CBF, hypocapnia secondary to hyperventilation can reduce CBF significantly.6,24,39,53,58 Hypocapnia can worsen oxidative metabolism and cause physiologic stress to the traumatized brain.60 The hypocapnic response has a CBF threshold of approximately 20 mL/100 g tissue/min beyond which CBF cannot be reduced further.39 The patients in our series did not have pCO2 values greater than 76.6 or less than 25.1 mm Hg to evaluate the physiologic limits in humans. Our data show that the relationship of pCO2 to CBF in the range of 25 to 76 mm Hg maintains a significant positive linear relationship between cerebral perfusion and pCO2. A significant proportion of the variance (73%) associated with cerebral perfusion was explained by pCO2.
Those patients with hypocapnia showed significant decreases in CBF, maintaining the linear relationship of CBF versus pCO2. Hypocapnic hypoperfusion has been shown recently with PET techniques61 and in animal models.62 Hyperventilation likely explains a subset of the clinical population with global poor perfusion values despite optimal technique and normal conventional imaging sequences. The relationship between pCO2 and perfusion in our study shows that decreasing the pCO2 by 10 mm Hg would result in a 67% decrease in perfusion signal intensity. ASL has inherently low signal-to-noise ratios such that low inherent perfusion exacerbated by hypocapnia gives inadequate signal perfusion for interpretation.
From a clinical standpoint, patients with acute hypercapnia may present with increased intracranial pressures, altered mental status, slurred speech, confusion, headache, hallucination, stupor, or coma.47,63,64 We believe hypercapnia is an underrecognized clinical entity that is easily confused with other clinical causes of altered mental status. Hypercapnia can be easily diagnosed with ABG, but the diagnosis can be suggested on the basis of a pattern of global cerebral hyperperfusion and concomitant absence of conventional imaging abnormalities. The ability to quantify the PASL perfusion makes it a reliable method to detect global increases in cerebral perfusion associated with hypercapnia.
Conclusions
With the inception of ASL as a routine perfusion imaging technique, global hyperperfusion secondary to hypercapnia may be recognized more frequently and may provide an alternative cause of unexplained neuropsychiatric symptoms in hospitalized patients. Hypocapnia also accounts for a subset of patients with globally poor perfusion signal intensity with otherwise normal conventional imaging. Radiologists interpreting ASL perfusion imaging should be aware of the effects produced by even small changes in pCO2, as they may be the first to suggest the diagnosis.
Acknowledgments
We thank Kathy Pearson for help with computer programming. We also thank Becky J. Mussat-Whitlow for reviewing the statistical data.
Footnotes
This study was supported by the Human Brain Project and the National Institute of Biomedical Imaging and BioEngineering through grants EB004673 and EB004673-02S2. This study was also partially supported by the Center for Biomolecular Imaging of Wake Forest University School of Medicine.
REFERENCES
- Received June 4, 2008.
- Accepted after revision August 12, 2008.
- Copyright © American Society of Neuroradiology
In this issue


Jump to section
Related Articles
Cited By...
- Hypercapnia-induced cerebral oedema in a patient with COPD exacerbation: a rare and under-recognised entity
- Is hypercapnia associated with poor prognosis in chronic obstructive pulmonary disease? A long-term follow-up cohort study
- Whole-Brain N-Acetylaspartate Concentration Is Preserved during Mild Hypercapnia Challenge
- Republished: Society for Neuroscience in Anesthesiology and Critical Care Expert Consensus Statement: Anesthetic Management of Endovascular Treatment for Acute Ischemic Stroke
- Novel MRI Approaches for Assessing Cerebral Hemodynamics in Ischemic Cerebrovascular Disease