
Abstract
BACKGROUND AND PURPOSE: Because sinonasal inverted papilloma can harbor squamous cell carcinoma, differentiating these tumors is relevant. The objectives of this study were to determine whether MR imaging–based texture analysis can accurately classify cases of noncoexistent squamous cell carcinoma and inverted papilloma and to compare this classification performance with neuroradiologists' review.
MATERIALS AND METHODS: Adult patients who had inverted papilloma or squamous cell carcinoma resected were eligible (coexistent inverted papilloma and squamous cell carcinoma were excluded). Inclusion required tumor size of >1.5 cm and preoperative MR imaging with axial T1, axial T2, and axial T1 postcontrast sequences. Five well-established texture analysis algorithms were applied to an ROI from the largest tumor cross-section. For a training dataset, machine-learning algorithms were used to identify the most accurate model, and performance was also evaluated in a validation dataset. On the basis of 3 separate blinded reviews of the ROI, isolated tumor, and entire images, 2 neuroradiologists predicted tumor type in consensus.
RESULTS: The inverted papilloma (n = 24) and squamous cell carcinoma (n = 22) cohorts were matched for age and sex, while squamous cell carcinoma tumor volume was larger (P = .001). The best classification model achieved similar accuracies for training (17 squamous cell carcinomas, 16 inverted papillomas) and validation (7 squamous cell carcinomas, 6 inverted papillomas) datasets of 90.9% and 84.6%, respectively (P = .537). For the combined training and validation cohorts, the machine-learning accuracy (89.1%) was better than that of the neuroradiologists' ROI review (56.5%, P = .0004) but not significantly different from the neuroradiologists' review of the tumors (73.9%, P = .060) or entire images (87.0%, P = .748).
CONCLUSIONS: MR imaging–based texture analysis has the potential to differentiate squamous cell carcinoma from inverted papilloma and may, in the future, provide incremental information to the neuroradiologist.
ABBREVIATIONS:
- DOST
- Discrete Orthonormal Stockwell Transform
- GFB
- Gabor Filter Banks
- GLCM
- Gray-Level Co-occurrence Matrix
- IP
- inverted papilloma
- LBP
- local binary patterns
- LoGHist
- Laplacian of Gaussian histogram
- PC
- principal component
- SCC
- squamous cell carcinoma
- T1
- axial T1-weighted MRI pulse sequence
- T2
- axial T2-weighted MRI pulse sequence with frequency-selective fat suppression
- T1C
- axial T1-weighted postcontrast MRI pulse sequence with frequency-selective fat suppression
Inverted papilloma (IP) is an uncommon sinonasal tumor of ectodermal origin that most commonly arises from the lateral nasal wall.1,2 In addition to its pattern of locally aggressive behavior and a propensity for postoperative recurrence, there is an association with malignancy, mostly squamous cell carcinoma (SCC). Reports vary widely in frequency, but the rate of carcinoma is on the order of 10%–15%, and approximately 60%–70% of these are synchronous.3,4 Although office-based endoscopic incisional biopsy is safe, the sensitivity for the diagnosis of malignancy has been called into question due to sampling errors.5
It can be useful to preoperatively identify SCC when coexistent with IP to guide biopsy, expedite surgery, and plan an oncologically sound resection. Although bone thinning and remodeling without large areas of erosion on CT are more characteristic of IP than SCC, this finding is imperfect because IP may also aggressively destroy bone, particularly when contacting the walls of the sphenoid sinuses and floor of the anterior cranial fossa.6,7 Not surprising, FDG-PET has shown a higher mean standard uptake value for SCC compared with IP, but overlap limits the clinical utility of PET.8 To date, MR imaging has the most promise in differentiating SCC from IP. Although early work initially found no signature appearance on MR imaging for IP, alternating hypointense and hyperintense bands on T2-weighted and contrast-enhanced T1-weighted sequences have become recognized as a distinctive feature of IP and have been described as a convoluted cerebriform pattern.6,9⇓–11 As with any subjective finding, interpretive errors can occur, especially when tumors are small or incompletely express the convoluted cerebriform pattern. Hence, a more objective form of image analysis is desirable.
Texture analysis is a form of image processing that seeks to characterize complex visual patterns by quantitatively identifying simpler but characteristic subpatterns. Within the field of head and neck radiology, texture analysis has shown applicability in predicting the p53 status of SCC, classifying SCC as human papilloma virus–related, predicting treatment response in head and neck cancer, differentiating benign from malignant thyroid nodules, and characterizing parotid tumors and structural changes after radiation therapy.12⇓⇓⇓⇓⇓⇓–19 Because a large volume of data is generated when multiple texture analysis algorithms are applied to MR imaging sequences, the statistical comparison of individual texture features is of limited practical value; instead, a multifactorial data-driven analysis is necessary (ie, “radiomics”). Therefore, the objective of this study was to determine whether MR imaging–based texture analysis can differentiate sinonasal SCC from IP by using a multiparametric machine-learning model. Model performance was additionally compared against qualitative neuroradiologists' interpretation to determine its potential for added clinical value.
Materials and Methods
Subject Enrollment
The Mayo Clinic Institutional Review Board approved this retrospective study, and the need for informed consent was waived. The pathology data base was queried to identify adult patients (18 years of age or older) who underwent resection of sinonasal IP or SCC. Subjects enrolled from January 1, 2009, to December 31, 2014, were included in the training dataset for model development, while those enrolled between January 1, 2015, and July 1, 2016, composed the validation dataset. To ensure that only a single histologic tumor type would be used for texture analysis, we excluded cases of coexistent IP and SCC. Potential subjects were screened to determine which of them had preoperative face MR imaging available for review. The MRIs, which were performed on numerous scanners within the authors' institution and at external facilities, had to be of diagnostic image quality. At a minimum, the imaging had to include an axial T1-weighted MRI pulse sequence (T1), an axial T2-weighted pulse sequence with frequency-selective fat-suppression (T2), and an axial T1-weighted postcontrast MRI pulse sequence with frequency-selective fat suppression (T1C) for texture analysis, with a section thickness of ≤5 mm, an FOV of ≤ 22 cm, and a matrix size of at least 256 × 192. No restrictions on additional MR imaging technical parameters or type of gadolinium-based intravenous contrast were imposed, and studies were included whether they were performed at 1.5T or 3T field strength. The electronic medical record was reviewed for each potential case, and subjects were excluded if they had an intervention for the sinonasal tumor, including biopsy, surgery, chemotherapy, or radiation therapy before imaging. Subjects were further eliminated if the tumor did not have orthogonal transaxial dimensions greater than 1.5 × 1.5 cm on at least 1 axial image.
Image Preparation and Texture Analysis
DICOM files containing the T1, T2, and T1C pulse sequences (also referred to as “contrasts” for the purpose of texture analysis) were anonymized and encoded so that all subsequent image analysis was blinded. To ensure uniformity for texture analysis, we performed resampling and/or zero-padding to generate images with an 18-cm FOV and a 256 × 256 pixel array and normalized image intensities to a dynamic range of 0–255. The studies were then reviewed by a board-certified neuroradiologist with OsiriX (Version 6.5; http://www.osirix-viewer.com). The borders of the tumor were manually traced on all T1C images on which tumor was visible to generate an ROI-based cross-sectional area for each image and an estimated tumor size by using the ROI Volume function in OsiriX. On the axial image with the greatest tumor cross-sectional area, the neuroradiologist inserted the largest possible rectangular ROI that would fit within the tumor for all 3 sequences (Fig 1). To prevent the 2D texture analysis from being biased by tumor size, a computer script determined the maximal square ROI that could fit within all manually drawn rectangular ROIs across all subjects and automatically positioned this smallest common square ROI at the isocenter of each of the rectangular ROIs. The contents of this square ROI, with 16 × 16 pixels, served as the input for texture analysis.
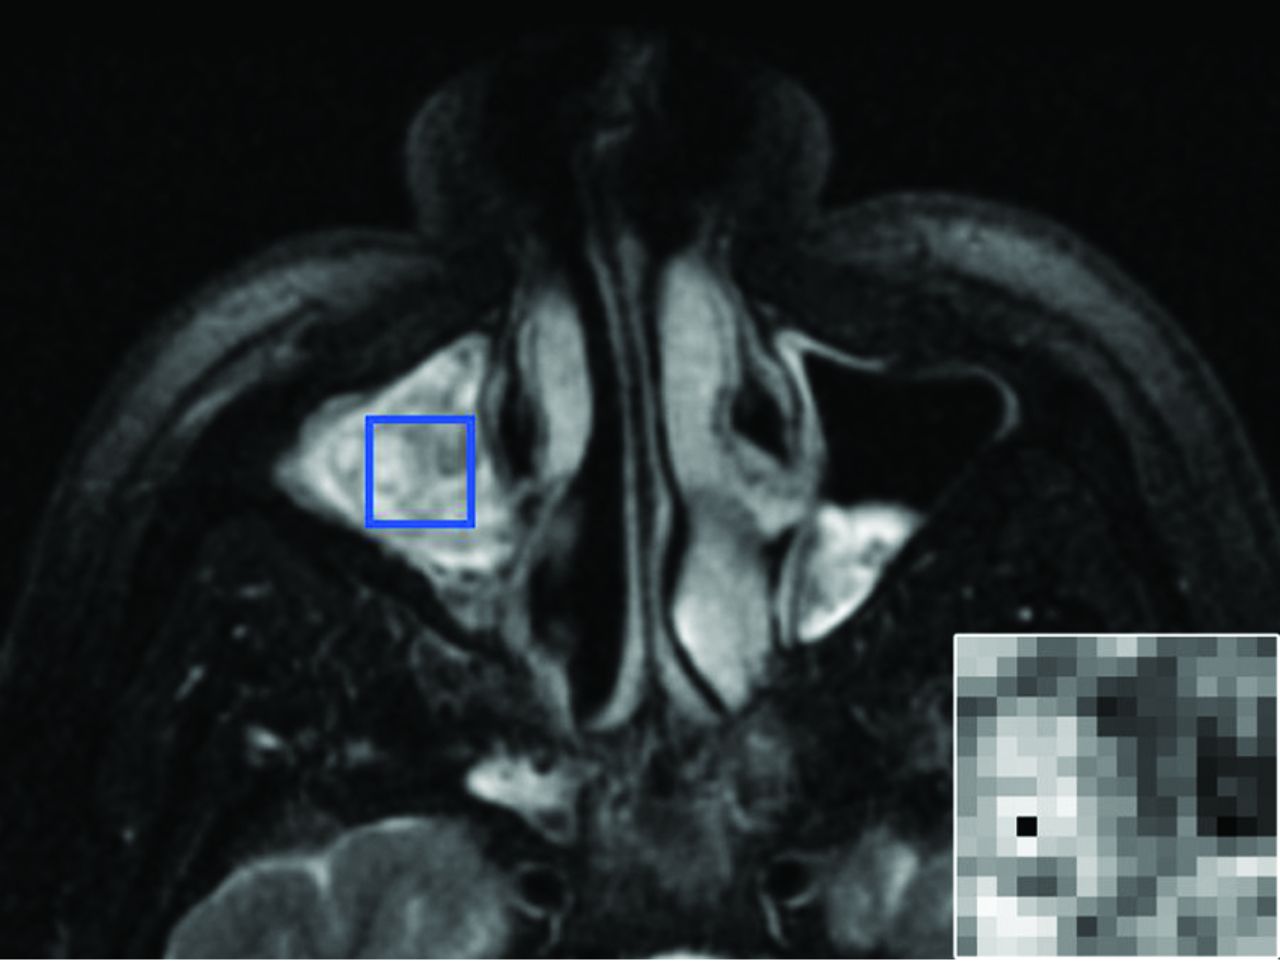
ROI placement. A 51-year-old man with an IP involving the right maxillary sinus. Axial T2-weighted fat-suppressed MR imaging pulse sequence demonstrates the manual placement of the largest rectangular ROI that would fit within the tumor margins on the axial image with the greatest tumor cross-sectional area. The inset image in the lower right corner is representative of the final 16 × 16 matrix that was derived from the ROI isocenter and served as the input for texture analysis.
Texture analysis of each ROI consisted of 3 first-order intensity-based features (mean, SD, and range of gray-level intensities) and features computed by using 5 widely available texture algorithms (all implemented in Python 2.7 programming language [https://www.python.org/downloads/], by using either custom-written code based on publications or open-source libraries as noted):
Gray-Level Co-occurrence Matrix (GLCM) is a widely applied method that uses second-order statistics to assess the arrangement of similar gray-scale intensities within an ROI.20 GLCM evaluates how frequently a pair of intensity levels is identified in an orientation based on a specified angle and radius. In the current study, the co-occurrence matrix was determined for a distance of 1 pixel over 4 angular directions (0°, 45°, 90°, and 135°). The mean and range for 13 rotationally invariant features (including measures of homogeneity, entropy, angular second moment, correlation, and dissimilarity) were computed at each ROI for each MR imaging contrast.20
Local binary patterns (LBP) evaluates the set of points within a fixed radius of a specified voxel to determine in a binary fashion whether they are higher or lower in intensity than neighboring voxels.21 Depending on the number of bitwise transitions across this interrogated region, the LBP can be classified as uniform or nonuniform, and histograms of these data provide a measure of ROI uniformity. A 3-voxel radius was selected to complement the smaller scale patterns already assessed by GLCM. A 12-bin histogram was used, resulting in 12 LBP texture features being calculated at each ROI for each MR imaging contrast.
Discrete Orthonormal Stockwell Transform (DOST) provides a rotationally invariant multiresolution spatial-frequency representation of an image based on dyadic sampling of the Fourier representation of the image.22 Ten DOST features were calculated at each ROI for each MR imaging contrast.
Laplacian of Gaussian Histogram (LoGHist) is a convolution-based method to capture the spectral composition of an image in intermediate scales not achievable with first- and second-order statistics. Through the use of varying sizes of bandpass filters, different scales of texture ranging from fine to coarse are highlighted.23 Gaussians with 3 different values of σ (2.0, 4.0, and 6.0) were used to cover the range of fine-to-medium-scale textures, and 18 LoGHist features were generated at each ROI for each MR imaging contrast.
The Gabor Filter Banks (GFB) technique uses localized and linear filters to capture details in various frequency resolutions.24 Four different Gabor filters were rendered by using 2 σ levels (1.0 and 3.0) and 2 frequency levels (0.6 and 1.0). By calculating the mean and SD of the filtered ROI, we computed 8 GFB features at each ROI for each MR imaging contrast.
Neuroradiologists' Review
Using OsiriX, 2 neuroradiologists with 25 and 28 years of experience, respectively, performed a blinded review to reach a consensus diagnosis of IP or SCC for each case. This was performed during 3 separate rounds of image review, each of which was randomized and completed in the following order:
ROI: For the T1, T2, and T1C series, the neuroradiologists exclusively reviewed the 16 × 16 square ROIs that had been used for texture analysis.
Tumor: On all images in the T1, T2, and T1C series, the data outside the tumor margins were zero-filled so that the neuroradiologists could only base their assessment on the intrinsic appearance of the tumor without information regarding tumor location and invasive behavior.
Image: The neuroradiologists were able to review the unaltered T1, T2, and T1C imaging datasets in their entirety.
Machine Learning and Statistical Analysis
Open-source R statistical and computing software (http://www.r-project.org) was used to perform the analyses and classification. Hypothesis tests were 2-sided, and statistical significance was defined as P < .05. The comparison of subject demographics and tumor size between IP and SCC was performed by using a 2-sample t test for subject age and tumor volume and a Fisher exact test for sex. The 2-sample t test was used for a univariate comparison of texture features between IP and SCC before the application of machine-learning methodology, and P values were corrected for multiple comparisons by using the false discovery rate.25
A total of 231 texture features were calculated for each case (77 texture features per MR imaging contrast × 3 contrasts). To reduce the dimensionality of the texture features and increase the generalizability of the predictive model for the training dataset, we used principal component (PC) analysis.26⇓–28 PCs, which are linear combinations of features, were identified separately for each texture algorithm and MR imaging contrast. Those PCs that sufficiently accounted for 90% of the texture feature variability were selected for further processing. Three commonly described classification algorithms, Diagonal Linear Discriminate Analysis, Support Vector Machines, and Diagonal Quadratic Discriminate Analysis, were conducted on the basis of the selected PCs in an attempt to differentiate SCC from IP.29⇓–31 Sequential forward-feature selection identified the image-based PCs that yielded the greatest accuracy.26,27 In developing the classification model, we initially selected the PC with the largest discriminatory power and incorporated additional PCs that improved model accuracy in an iterative fashion until incremental gains in accuracy were <1%.
Classification accuracy was determined by using leave-one-out cross-validation, in which all samples except for 1 were used, while the left-out sample served as the test case with which to assess classification accuracy.32 This process was repeated until all samples in the training dataset had served as the test case, and the overall cross-validation accuracy was the averaged accuracy. The most accurate classification model was applied in a blinded fashion to the validation dataset, and the diagnostic performance of the model was assessed. Model performance accuracies between the training and validation datasets and between the best classification model and neuroradiologists' review were compared by using a 2-tailed test of population proportion.
Results
Thirty-three subjects were included in the training set, 16 IPs and 17 SCCs, while the validation set consisted of 6 IPs and 7 SCCs (Table 1). The patients were similarly matched for age and male-predominant sex. Mean tumor volume was larger for SCC than IP (P = .001).
Patient demographic characteristics and tumor featuresa
Individual features derived from the 5 different texture analyses across all 3 MR imaging contrasts (T1, T2, T1C) were initially evaluated in a univariate fashion to look for significant differences between the IP and SCC groups (Fig 2). The greatest number of texture features showing statistically significant differences were derived from the DOST and GFB texture analyses.
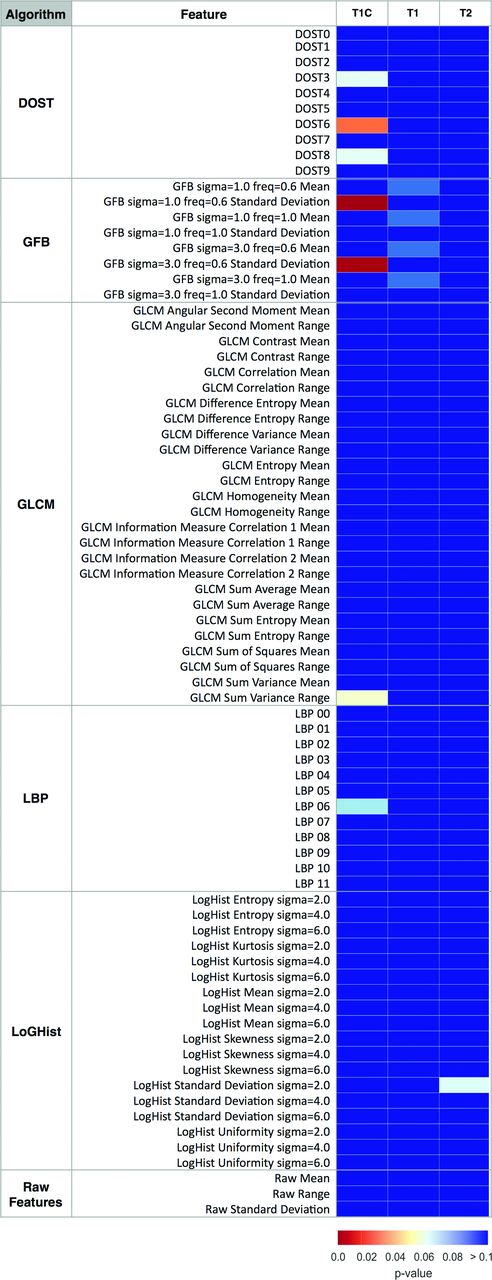
Heat map showing MR imaging texture feature significance in distinguishing tumor type. Univariate analysis compared the pathology status (SCC versus IP) with MR imaging–texture features. Color maps show the false discovery rate–adjusted P values of a 2-sample t test. MR imaging contrasts (pulse sequences) are listed above the columns, and MR imaging–based texture features are listed in rows. DOST features 0–9 correspond with low-to-high frequency patterns. LBP 0–11 are the normalized bin counts in the LBP histogram. The reader is referred to the “Materials and Methods” section for additional details about the features.
Model performance for the training and validation datasets is presented in Table 2. Following PC analysis and machine-learning classification, the predictive classifier with the best classification result was Support Vector Machines, yielding 90.9% accuracy for the training dataset. The 84.6% accuracy of the validation dataset did not significantly differ from that achieved in the training dataset (P = .537). When we combined the training and validation cohorts (n = 46), the accuracy achieved by texture analysis (89.1%) was significantly better than that of the ROI-based neuroradiologists' review (Table 3, 56.5%, P = .0004) and showed a trend toward improved accuracy over neuroradiologists' review of the entire tumor (73.9%, P = .060). Texture-analysis accuracy was not significantly different from that of the neuroradiologists reviewing the entire unaltered images (87.0%, P = .748).
Diagnostic performance of machine-learning classification in training and validation datasets
Diagnostic performance of texture analysis with machine learning compared with neuroradiologists' review for the differentiation of SCC from IPa
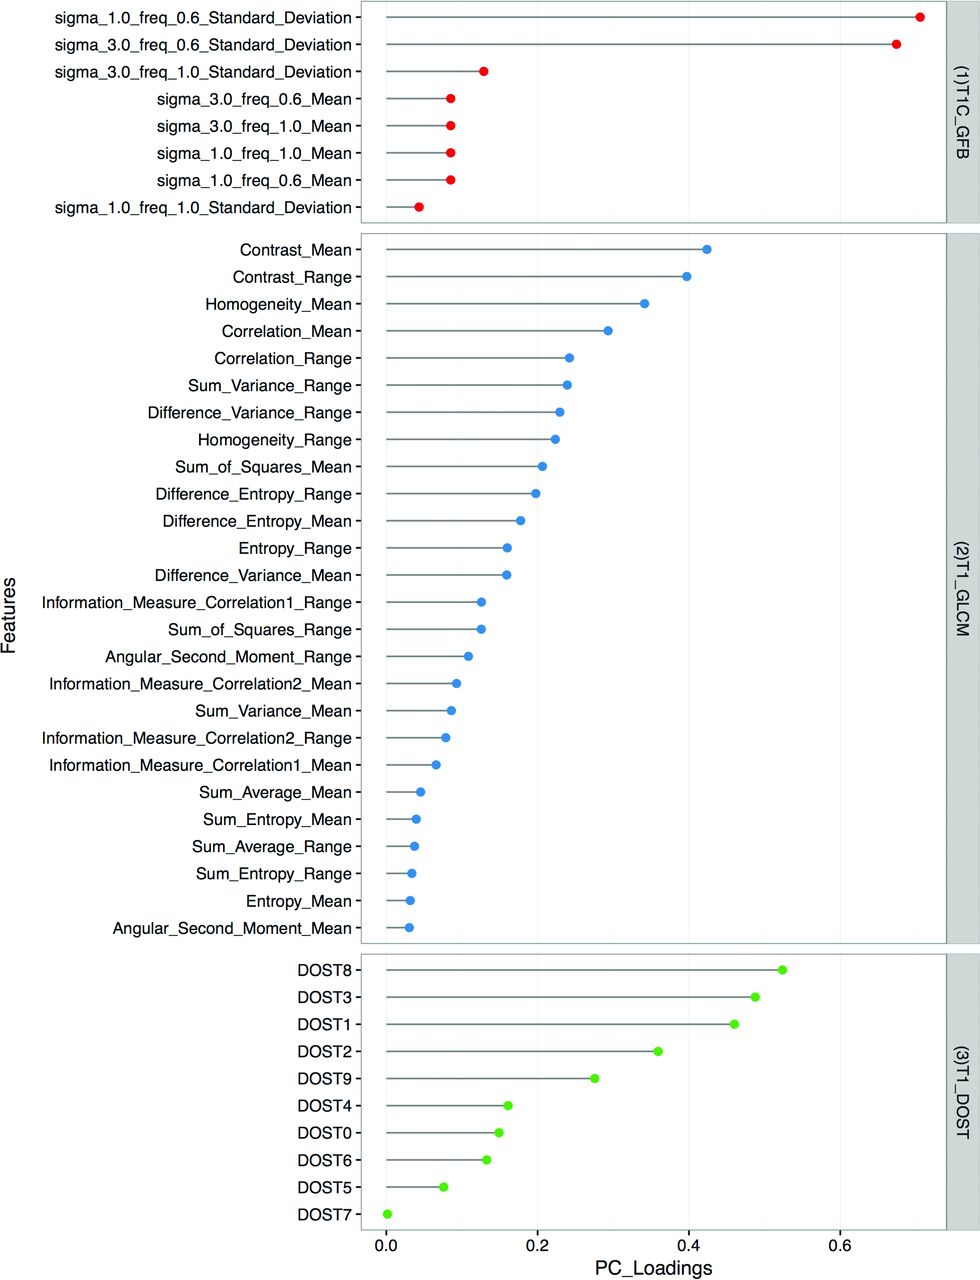
Relative contributions to model accuracy from each texture analysis algorithm and MR imaging contrast are presented (Fig 3). The most significant texture features were derived from T1C-GFB, T1-GLCM, and T1-DOST (Fig 4).

Relative contributions to model accuracy. Of the 90.9% overall model accuracy for the training dataset, the bar graph demonstrates the accuracy attributable to PCs derived from T1C-GFB, T1-DOST, and T1-GLCM (upper panel). Across all texture algorithms, the contribution to total model accuracy was derived predominantly from T1C, with minor contributions from T1 and no input from T2 (lower panel).

PC loading. The model with the greatest accuracy for discriminating SCC from IP was derived from T1C-GFB, T1-GLCM, and T1-DOST texture features (right). For the individually specified texture features (left), PC loadings are graphically represented, and larger values in the PC loading indicate greater significance in the final model.
Discussion
MR imaging has long been recognized as the most useful technique with which to distinguish sinonasal SCC from IP. Most of the prior work focused on a qualitative imaging appearance known as the “convoluted cerebriform pattern.”6,9⇓–11,33,34 Although this pattern has a high level of sensitivity for IP, it is not entirely specific. As an example, Jeon et al9 evaluated the performance of the convoluted cerebriform pattern in 30 patients with IP relative to 128 patients with sinonasal malignancies and reported a sensitivity of 100%, specificity of 87%, positive predictive value of 64%, negative predictive value of 100%, and accuracy of 89%.
Texture analysis integrated into a machine-learning model was able to classify SCC and IP with an accuracy on par with the previously published results based on the convoluted cerebriform pattern.9 It is also similar to the best consensus neuroradiologists' interpretation in the current study. However, this technology is meant to supplement a neuroradiologist's interpretive skills rather than compete with them. In clinical practice, a diagnosis is rendered by synthesizing all available data that include not only intrinsic tumor appearance but also other imaging features such as site of origin, tumor size, extrasinonasal extension, and tumor margins. Indeed, the current results support a neuroradiologist's accuracy improving for differentiating sinonasal IP and SCC as more imaging information is made available. On the basis of a 16 × 16 ROI, the texture-based machine-learning model outperformed the accuracy of the neuroradiologists (P = .0004). In terms of assessing the intrinsic tumor appearance, texture analysis stands to provide incremental benefit when human pattern recognition becomes most limited, and this can occur with a small tumor. For example, Maroldi et al6 found it more challenging to recognize the convoluted cerebriform pattern on T2-weighted images for tumors of <2 cm. While tumors smaller than 1.5 × 1.5 cm were excluded from enrollment in the current study, the final processed ROIs were only 1.125 × 1.125 cm.
Because small noninvasive sinonasal tumors are not universally imaged with MR imaging, the greatest potential benefit for texture analysis might be in detecting a small focus of SCC within a larger IP to expedite patient management. Accurately assessing small regions would be a prerequisite for the detection of such tumor heterogeneity. The potential for interpretive error is greatest when a small focus of SCC exists within a much larger IP and goes unrecognized because a convoluted cerebriform pattern is still present. Indeed, this pattern of a “partial” convoluted cerebriform pattern has been described.6,9,35 Likewise, necrosis, recognized as nonenhancing tissue on contrast-enhanced MR imaging, is associated with SCC but may not be apparent when a small focus of SCC coexists with an IP.9,10,35 A future goal for texture analysis of a mixed tumor containing both IP and SCC is to assist with interpretation by highlighting areas that are most suspicious for SCC.
Texture analysis can also extract useful features from images that have been traditionally neglected by the human eye. The convoluted cerebriform pattern has been historically described on T1-weighted postcontrast and T2-weighted sequences.6,9⇓–11,33⇓–35 However, noncontrast T1-weighted MR imaging has received no attention to date, to our knowledge. The texture analysis in the current study found more significant features for T1 than T2 on a univariate basis (Fig 2). Although T1-DOST and T1-GLCM made a minority contribution to the final model, no T2 features contributed to final model accuracy (Fig 3).
For MR imaging, it has been suggested that texture analysis models may not effectively translate across different imaging protocols and scanner platforms.36,37 Certainly, this possibility would make such results clinically meaningless because a new model would have to be created for each scanner running a unique protocol. Fruehwald-Pallamar et al38 concluded that texture analysis is not practical for differentiating malignant and benign tumors of the head and neck when using different protocols on different MR imaging scanners. However, their cohort was very heterogeneous, containing numerous types of benign and malignant lesions. The subjects for the current study were accrued during a long period and were not imaged with a common scanner and protocol. Nevertheless, an accurate texture-based model was achieved that performed similarly in the training and validation datasets. At least for the context of sinonasal IP and SCC, this outcome holds promise for reproducibility across scanner platforms.
The current study is limited, given its retrospective nature and small sample size. Hence, the high accuracy for the differentiation of SCC from IP with texture analysis is not meant to represent the performance of an established diagnostic imaging test. Instead, these results merely confirm the feasibility of this technique for distinguishing these 2 tumor types. In showing proof of concept, a 2D ROI-based analysis was used to confirm discriminatory ability with a limited data sample. Moreover, because SCC tends to be a larger tumor than IP on average, this approach eliminated the potential for falsely finding texture differences on the basis of relative oversampling of a larger tumor. Future directions will include the refinement of the texture analysis pipeline into a volumetric tool with the objective of highlighting foci of SCC when it is coexistent with IP. This will need to be studied prospectively to ensure that the histopathologic analysis can be accurately coregistered to MR imaging.
Conclusions
With MR imaging–based texture analysis, a machine-learning model for the differentiation of sinonasal SCC and IP achieved accuracy comparable with both neuroradiologists' interpretation and previously published reports on the convoluted cerebriform pattern. Because the classification model was significantly more accurate than the neuroradiologists' interpretation for a small ROI, texture analysis has the potential to provide incremental benefit to the neuroradiologists' interpretation, particularly in cases of small or heterogeneous tumors.
Footnotes
S. Ramkumar and S. Ranjbar are co-first authors.
Disclosures: Shreya Ramkumar—RELATED: Grant: Arizona State University/Mayo Clinic Seed Grant, Comments: A $40,000 intramural research grant funding was awarded to foster collaborative research between Arizona State University and Mayo Clinic.* Sara Ranjbar—RELATED: Grant: Arizona State University/Mayo Clinic Seed Grant, Comments: A $40,000 intramural research grant funding was awarded to foster collaborative research between Arizona State University and Mayo Clinic.* Devyani Lal—UNRELATED: Board Membership: American Rhinologic Society, Comments: not for profit; Employment: Mayo Clinic; Grants/Grants Pending: Flinn Foundation, Sanofi. Joseph Ross Mitchell—UNRELATED: Employment: Mayo Clinic; Grants/Grants/Grants Pending: National Institutes of Health*; Patents (Planned, Pending, or Issued): Mayo Clinic, Comments: Provisional patents were filed relating to texture analysis of medical imaging data.* Joseph Hoxworth—RELATED: Grant: Arizona State University/Mayo Clinic Seed Grant, Comments: A $40,000 intramural research grant funding was awarded to foster collaborative research between Arizona State University and Mayo Clinic.* *Money paid to the institution.
This work was supported by the Arizona State University/Mayo Clinic Seed Grant Program.
Paper previously presented at: Annual Meeting of the North American Skull Base Society, February 12–14, 2016; Scottsdale, Arizona.
REFERENCES
- Received October 12, 2016.
- Accepted after revision December 13, 2016.
- © 2017 by American Journal of Neuroradiology


Jump to section
Related Articles
Cited By...
- No citing articles found.