
Abstract
BACKGROUND AND PURPOSE: The majority of brain growth and development occur in the first 2 years of life. This study investigated these changes by analysis of the brain radiodensity histogram of head CT scans from the clinical population, 0–2 years of age.
MATERIALS AND METHODS: One hundred twenty consecutive head CTs with normal findings meeting the inclusion criteria from children from birth to 2 years were retrospectively identified from 3 different CT scan platforms. Histogram analysis was performed on brain-extracted images, and histogram mean, mode, full width at half maximum, skewness, kurtosis, and SD were correlated with subject age. The effects of scan platform were investigated. Normative curves were fitted by polynomial regression analysis.
RESULTS: Average total brain volume was 360 cm3 at birth, 948 cm3 at 1 year, and 1072 cm3 at 2 years. Total brain tissue density showed an 11% increase in mean density at 1 year and 19% at 2 years. Brain radiodensity histogram skewness was positive at birth, declining logarithmically in the first 200 days of life. The histogram kurtosis also decreased in the first 200 days to approach a normal distribution. Direct segmentation of CT images showed that changes in brain radiodensity histogram skewness correlated with, and can be explained by, a relative increase in gray matter volume and an increase in gray and white matter tissue density that occurs during this period of brain maturation.
CONCLUSIONS: Normative metrics of the brain radiodensity histogram derived from routine clinical head CT images can be used to develop a model of normal brain development.
ABBREVIATIONS:
- FWHM
- full width at half maximum
- ID
- identification
- LOOCV
- leave-one-out cross-validation
- RMSE
- root-mean-square error
- R2
- coefficient of determination
The availability and speed of CT imaging, together with radiation dose reduction strategies, serve to maintain the role of CT in pediatric clinical care. CT is particularly amenable to quantitative measures because the Hounsfield unit, reported by the scanner, is directly related to a physical property of tissue—tissue radiodensity. The differences in tissue radiodensity between gray and white matter enable segmentation of these tissues and characterization of the products of segmentation. Segmentation permits quantitative analysis of volumes and densities of tissue types, with the potential to further the diagnostic power of the CT scan. The risks of radiation exposure preclude prospective scanning of healthy children, however, and little research has been directed at quantitative measures of brain development using CT.
Retrospective analysis of imaging data from the clinical archive provides a data base from which to develop a model of normal brain development using CT. We used a total brain radiodensity histogram method to investigate brain tissue changes as a function of subject age. This total brain histogram approach has the advantage of being objective and reproducible, is amenable to automation, and enables the development of a model of early brain maturation. Such a model could serve as a normative baseline for quantitative assessment of normal and abnormal brain development.
Materials and Methods
Study Cohort
All children 2 years of age and younger presenting for evaluation by a CT imaging system at Geisinger Health System from May 2010 to May 2016 were retrospectively reviewed after approval by the institutional review board. The study cohort included patients from neonate to 2 years of age with no known neurologic, neurocognitive, or developmental deficits, who had normal-appearing head CT findings. All head CT studies with normal findings were additionally reviewed and confirmed by a neuroradiologist with a Certificate of Added Qualification with 6 years of attending pediatric neuroradiology experience (K.A.C.). Patients who had any focal abnormal findings on the head CT study or any subsequent brain MR imaging with any abnormal focal intensity on FLAIR or other sequences, cysts, or other nonspecific structural appearances were excluded. Patients with metal artifacts or motion-degraded or non-diagnostic-quality imaging were also excluded.
A thorough chart review was performed (K.A.C.) to identify any disease history. Most cases were of minor trauma without traumatic findings, isolated seizure, apnea, and tremor. Other cases included scalp nevus and isolated facial and neck lesions without associated syndromes or intracranial extension. Patients with any systemic or noncentral nervous system diseases (eg, diseases of the renal, gastrointestinal, cardiac systems), cancers, history of prematurity, phakomatoses, genetic or syndromic conditions, epilepsy, fracture, hemorrhage, vascular lesions (aneurysm, AVM, fistula, or steno-occlusive disease of the CNS or elsewhere), acute or recent infection and fever of unknown origin, chronic medical therapy, or endocrine symptoms/laboratory abnormal results were excluded.
One hundred twenty healthy subjects from birth to 2 years (60 males and 60 females) met the inclusion criteria and were included in the study. Cases were drawn from 3 different scan platforms and were analyzed separately. The resulting cohort consisted of 45 cases (21 female) scanned on scanner 1 (described below), 51 cases (29 female) scanned on scanner 2, and 24 cases (12 female) scanned on scanner 3.
Imaging Methods
To assess the variation in image histogram metrics due scan platform, we collected images from 3 different scan platforms within our health care system.
Scanner 1 serves a community medical center, is a Brilliance 64 (Philips Healthcare, Best, the Netherlands) with helical acquisition and pediatric head CT protocol with 120 kV(peak) and fixed 192 mA (rotation time = .781 seconds, pitch = 0.64, effective milliampere-second = 234.3).
Scanner 2 primarily serves the emergency department of a level 1 trauma center, is a LightSpeed VCT (GE Healthcare, Milwaukee, Wisconsin) with an axial acquisition and pediatric head CT protocol with 120 kVp and modulated milliampere, minimum 20 and maximum 75mA (rotation time = 0.5 seconds).
Scanner 3 serves a second community medical center, is a Discovery 690 (GE Healthcare) with axial acquisition and pediatric head CT protocol with 120 kVp and fixed 240 mA (rotation time = 0.5 seconds).
Each scanner undergoes a daily quality assurance procedure, which assesses the radiodensity of water. This value must be within allowable limits, generally 0 ± 5 HU. Drift or trending is rarely observed. In addition, scanners undergo an annual inspection by a medical physicist using the American College of Radiology phantom. Acceptable ranges of Hounsfield units for clinical scanners are broad (−7–7 for water, 110–135 for acrylic).1 This testing is extended to all kilovolt(peak)s used by the scanner. Additionally, service engineers routinely test the calibration at preventive maintenance.
Image Processing and Analysis
Images were thresholded, brain-extracted, and segmented in FSL (www.fmrib.ox.ac.uk/fsl),2⇓–4 as described in Cauley et al.5 In brief, CSF was eliminated by setting a threshold minimum at 10 HU. The upper threshold value was set at 50 HU based on the pre-brain-extracted histogram and served to eliminate skull. The FSL Brain Extraction Tool (http://fsl.fmrib.ox.ac.uk/fsl/fslwiki/BET) standard brain extraction was used with a fractional intensity threshold of 0.01. All cases were carefully reviewed for integrity of brain extraction. No cases were eliminated on the basis of technical failure of the brain extraction protocol, and no manual masking was necessary. Brain volumes were computed in FSL from brain-extracted images.
Histograms and histogram analysis were performed in Matlab (Release 2009b; MathWorks, Natick, Massachusetts). The histogram of a normal brain follows the general appearance of the normal distribution. Matlab functions skewness and kurtosis were used to assess how far from this distribution each imaging dataset lay. In Matlab, the skewness of a distribution is defined as s = E(x − μ)3 / σ3, where μ is the mean of x, σ is the SD of x, and E(t) represents the expected value of the quantity t. Kurtosis is defined as k = E(x − μ)4 / σ4, where μ is the mean of x, σ is the SD of x, and E(t) represents the expected value of the quantity t. The kurtosis of the normal distribution is 3. Other histogram features, including histogram mean, mode, full width at half maximum (FWHM), and SD, were recorded.
For segmentation, a 2-tissue compartment segmentation strategy was used, with FAST at default settings and partial volume segmentation. Segmentations were confirmed by histogram (Fig 1) as previously described.5

Brain-extracted head CT images with products of direct segmentation. Ten-day and 1-year-old brains were segmented. White matter segmentation is shown in the center panels, and gray matter segmentation is shown on the right. Histogram analysis of the products of segmentation shows a relative increase in the size of the gray matter peak and movement of the peak mode to a slightly higher density.
Statistical Analysis
For the brain volume growth curve, we first fitted the basic polynomial regression model, in which a third-degree polynomial of age was used to model the scaled brain volume growth curve.6 Sex and scanner identification (ID) covariables were then added, and the model was refitted. For characteristics of the CT density histogram, a polynomial regression of the second-degree of age (basic model) was fitted first, and the additional covariates such as sex and scanner ID were considered. Dependent variables were scaled by SD. Models were selected on the basis of the adjusted coefficient of determination (R2). Models were evaluated using leave-one-out cross-validation (LOOCV), and root-mean-square error (RMSE) was computed for predictive accuracy. Curve fitting and statistical analysis were performed using GraphPad Prism software, Version 7.0c for Mac OS X (GraphPad Software, San Diego, California). The statistical significance of sex and scanner platform contribution were calculated in R statistical and computing software (http://www.r-project.org/).7
Results
Brain Volume Curve Modeling
Brain volume as a function of age is shown in Fig 2, with trendlines and 95% predictive bands. From Table 1, adjusted R2 indicated that a third-degree polynomial of age with sex as a covariate performed the best in Equation 1, while adding the additional scanner did not improve the adjusted R2.
 At birth, the brain volume is between 300 and 400 cm3, greater than double in the first year of life (average volume at 1 year is 948 cm3), and growing an additional 19% in volume in the second year, to 1072 cm3. With a polynomial model with baseline volume at 0–30 days, brain volume increase is 150% in the first year (95% CI, 144%–150%) and 172% at year 2 (95% CI, 148%–197%) (Fig 2, Table 1, and Equation 1). Regression results for Equation 1 indicated a 5200 mm3 significantly higher average brain volume for boys over girls (P < .01), not adjusted for body weight.

Nonlinear regression analysis of exponential growth of the brain in the first 2 years. Curves (left) show boys (m, and solid trend line) and girls (f, and dotted trend line) with a small but statistically significant difference in absolute brain size (data not normalized to body weight). Curves (right) show 95% prediction bands. Prediction bands may be used to aid in the identification of clinical pathology.
Model fitting and cross-validation results for scaled brain volume
Although adding both sex and scanner as covariates resulted in a smaller RMSE than adding sex only, the cross-validation (LOOCV) RMSE indicated that adding both covariates resulted in overfitting the data (5.4% versus 3.8% increase in RMSE, Table 1).
Brain Density Histogram Analysis
The radiodensity of the brain changes as a function of age (Fig 3), and the changes can be quantified through analysis of the radiodensity histogram metrics (Fig 4, trendlines and 95% predictive bands are shown). Model-fitting results indicated that a second-degree polynomial of age with an additional scanner ID performed the best for mean, mode, and kurtosis; first-degree of age with scanner ID performed best for FWHM; and σ, first-degree of log (age) with scanner ID performed best for skewness (Equation 2). Cross-validation (LOOCV) results on scaled dependent variables indicated that our models had good predictive power in CT histogram data because the RMSE from LOOCV demonstrated small differences (3%–7%) from the RMSE from the polynomial model (Table 2).
 Histogram mean and modal Hounsfield density curves parallel the brain volume changes that occur in the first 500 days of life (Fig 4). Mean brain tissue density increases from 25.6 HU to 30.6 HU during this period (Tables 2). The skewness of the brain tissue density histogram decreases logarithmically from the time of birth to a zero value at approximately 200 days. The total brain Hounsfield unit histogram kurtosis also decreases during this period to approach a value of 3, representing a normal distribution. With concern that differences in scanner acquisition and calibration may impact the characteristics of the radiodensity histogram, data from the different scan platforms were analyzed separately. Histogram analysis showed similar trends from all 3 scan platforms (On-line Figs 1 and 2). A composite model inclusive of all 3 scan platforms was also derived (On-line Appendix and On-line Table).

Histogram analysis of brain-extracted head CT images, at 10 days and 1 year. The histogram becomes more symmetric with age, and the leading edge at 1 year (arrow) reflects higher density voxels. y indicates year; d, day.
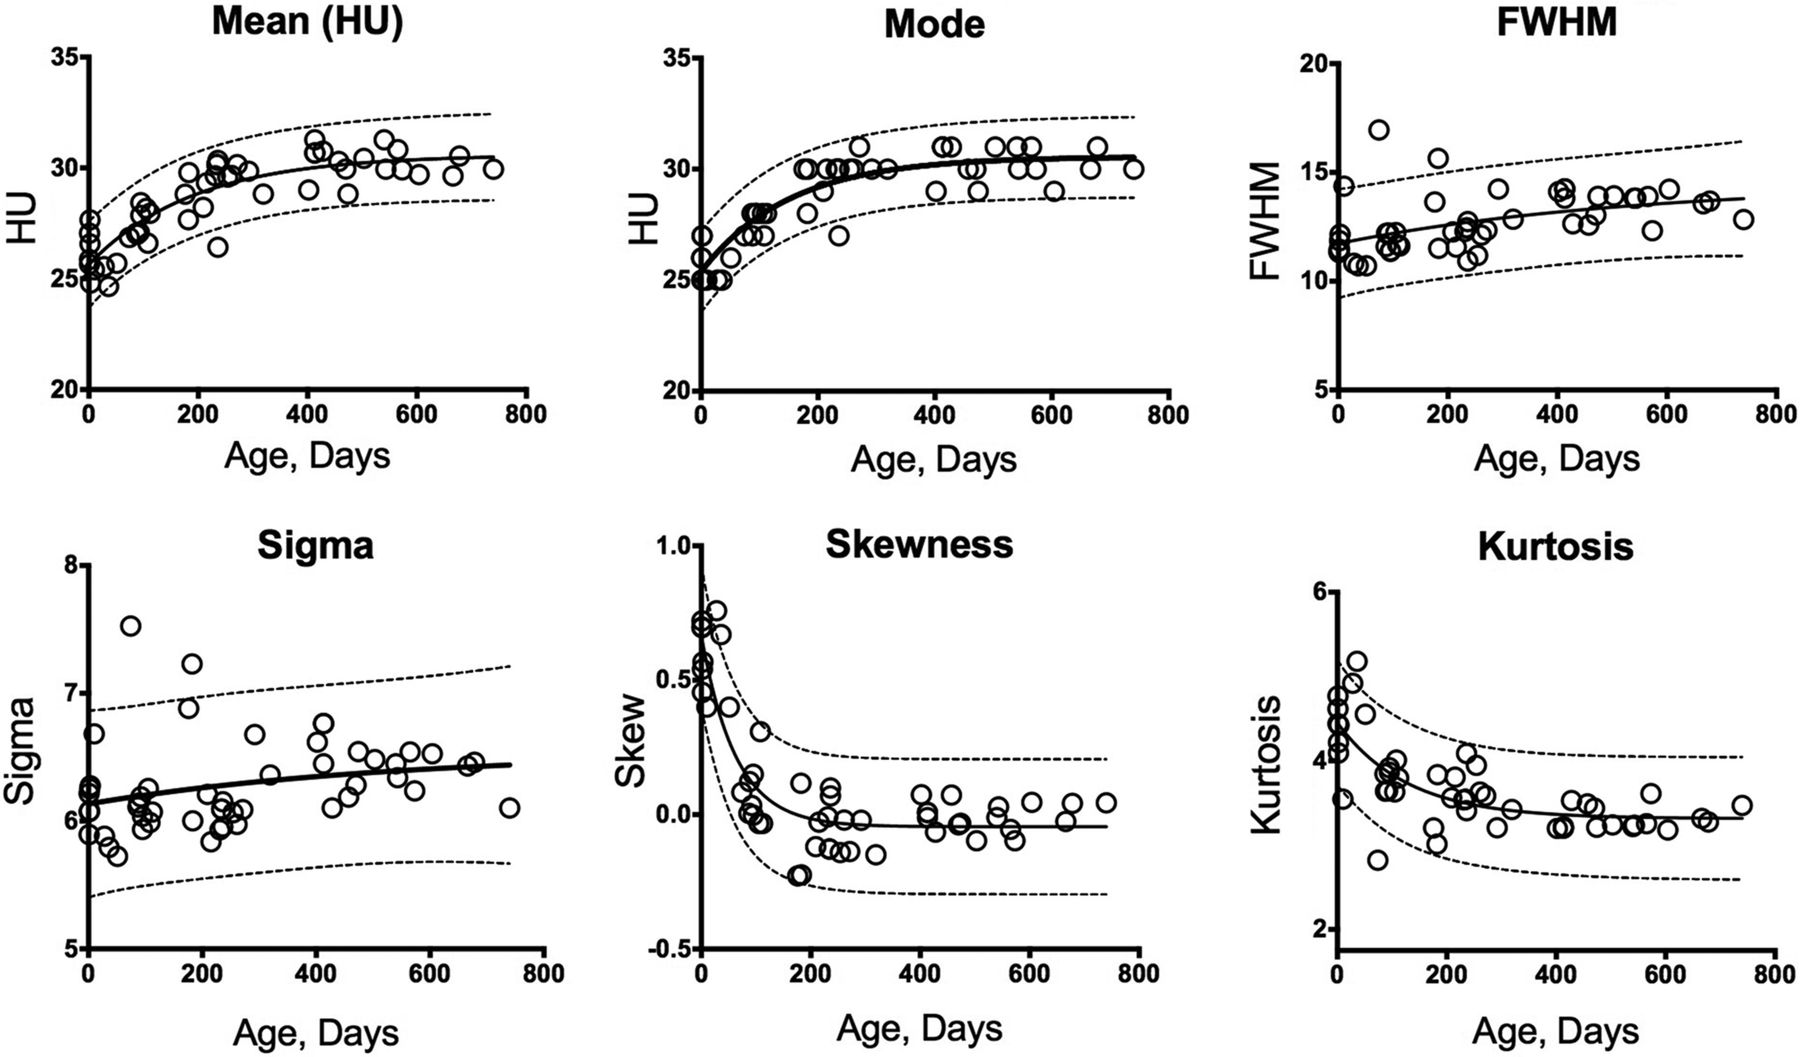
Total brain histogram analysis from 1 scan platform (scanner 2) shows total brain Hounsfield unit mean and Hounsfield unit histogram mode as well as FWHM, histogram SD (σ), histogram skewness, and kurtosis as a function of subject age. Trendline and 95% predictive bands are shown.
Model fitting and cross-validation results for scaled CT radiodensity histogram (scanner 2)
Gray and White Matter Segmentation
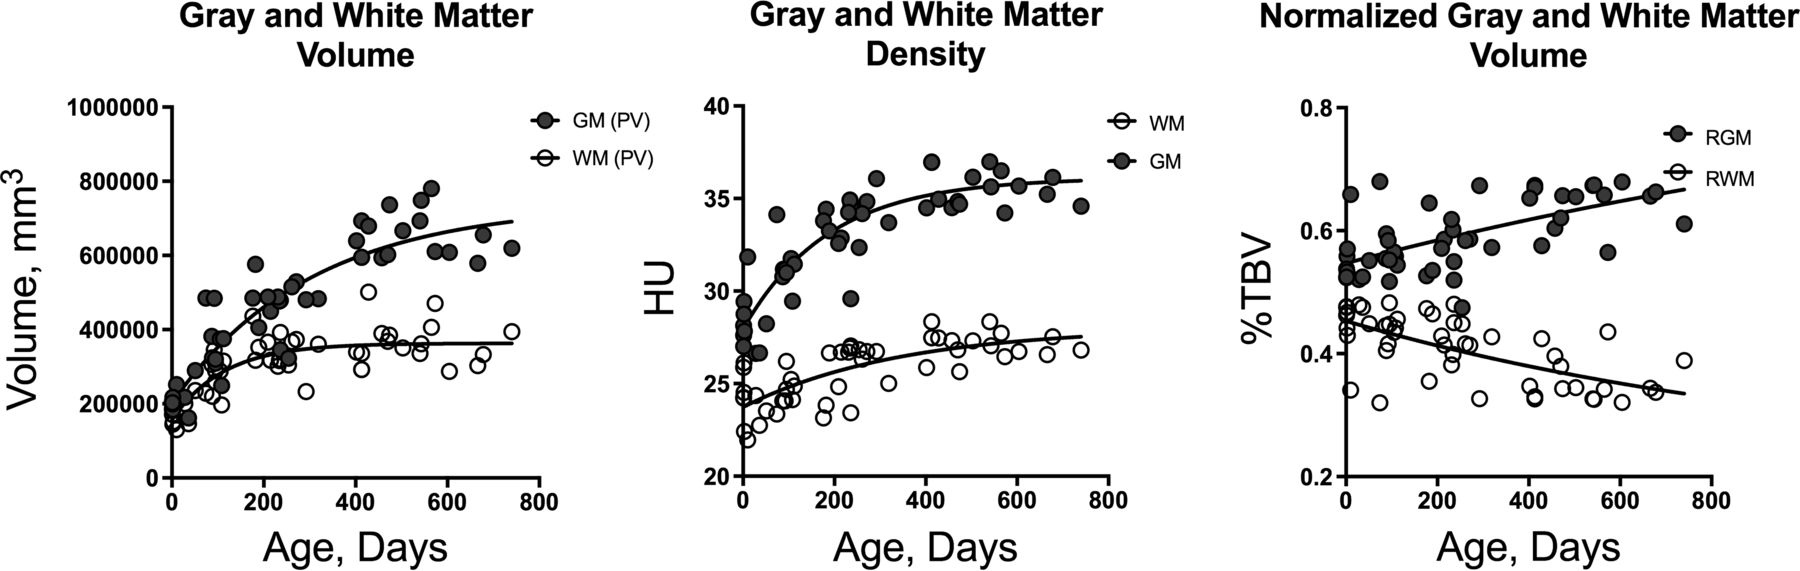
Direct segmentation of images from a single scan platform (scanner 2) permits an analysis of gray and white matter changes as a function of brain development (Figs 1 and 5). Both gray and white matter volumes increase in the perinatal period, with the greatest changes occurring in the first 200 days of life (Fig 5). Gray and white matter volumes appear nearly convergent at birth, at approximately 200 cm3. Gray matter volume increases dramatically in the first year, to approximately 500 cm3, a 150% increase, whereas white matter increases to approximately 350 cm3, a 75% increase. Segmented tissue volumes normalized to total brain volumes show a relative increase in gray matter volume from 55% of brain volume to 65% at 1 year, while the relative white matter volume decreases proportionally in the same period. Concurrent with these changes, both gray and white matter densities increase, with gray matter from 28 HU at birth to 36 HU at 1 year and WM from 23.7 HU at birth to 26 HU at 1 year.

Direct segmentation into gray and white matter with nonlinear regression as a function of age. Tissue volumes (left), tissue densities (center), and tissue volumes normalized to total brain volume (right) are shown. PV indicates partial volume; RGM, relative gray matter volume; RWM, relative white matter volume.
Discussion
Although several studies of quantitative imaging of brain growth and development have focused on the immediate perinatal period,8⇓–10 few studies have focused on the first years of life.11⇓–13 This time window is important in brain development because the largest changes in brain maturation occur in the first 2 years.14,15 Subtle abnormalities of brain size and abnormal gray and white matter volumes and growth trajectories have been associated with diseases such as attention deficit/hyperactivity disorder,6,16 autism,17,18 and schizophrenia.19 Reference data in this time window are also needed because neonates and toddlers can pose a challenge for diagnostic medicine in the clinical setting, where history and physical examination may be limited. Most in vivo studies are based on MR imaging data, with the few studies based on CT imaging having been performed before the wide use of MR imaging.10,13,20 To our knowledge, this is the first study to investigate the changes in brain development by digital analysis of head CT data. The logistics of MR imaging of toddlers can limit investigation into brain development in this period of childhood, and additional data derived from head CT images serve to support and augment data obtained from MR imaging studies.
Our CT-derived brain volumes are overall consistent with reported MR imaging findings, though no true curve fitting has yet been reported for brain growth in this period of brain development, to our knowledge. In an early MR imaging study with emphasis on brain development of premature and mature neonates, Hüppi et al9 found a near-linear growth curve in the immediate perinatal period and a birth volume at maturity of approximately 400,000 mm3 at full-term. Also using MR imaging, Holland et al8 investigated brain growth trajectories and rates of change in the first 3 months of infant brain development, finding a near-linear growth curve in the first 90 days of life and a birth volume of 347,388 mm3, similar to our finding of 361,494 mm3. Choe et al11 studied infant brain development from 3 to 13 months, recruiting 27 full-term and developing neonates, some scanned more than once, with scans at 3, 6, and 12 months. Although the emphasis of that study was on relative growth of segmented brain structures, the study recorded total brain volumes at approximately 650 cm3 at 16 weeks, 800 cm3 at 30 weeks, and 950 cm3 at 52 weeks, similar to our findings, and with individual variation (data scatter) similar to the variation that we report.11
Studies by Knickmeyer et al12, and Shi et al21 are of similar design and offer the most complete MR imaging data regarding brain growth during the first 2 years of life, with cohorts scanned in the neonatal period (at 2–4 weeks) and at 1 and 2 years. This study design with clustering of the data at discrete time points does not permit generation of a detailed growth curve but does show comparable brain volumes with approximately 400 cm3 at 2–4 weeks and 800–900 cm3 at 12 months, with a plateau at approximately 1000 cm3 at 24 months seen in both studies, with a qualitative growth curve and intersubject variation (data scatter) similar to those in the current study.
Previous studies have investigated sex differences in perinatal brain volume with mixed conclusions, likely due to differences in the ages of the children being evaluated and small sample sizes.8,12 Similar to the prospective MR imaging findings of Shi et al,21 we found a small but statistically significant difference in brain growth curves between boys and girls, with boys being consistently larger, approximately 5.5% larger at 1 year and 5% larger at 2 years. These numbers were not normalized to body size. Statistical analysis also revealed that the use of different scan platforms does not contribute significantly to the volume estimate or the fitted growth curve.
Our study investigated the correlation between the parametric measures of the brain density histogram and subject age. Although whole-brain histogram analysis has been explored in a number of different MR imaging techniques, histogram analysis of head CT images has not been widely investigated, to our knowledge. Histogram analysis offers objective, quantitative evaluation of parameters beyond those seen at routine diagnostic image interpretation and lends itself to automated analysis of head CT imaging. The clear age-dependent trends of the data motivated the concept of a statistical model. Our retrospective study design resulted in a continuous age distribution, which enabled curve fitting, which is not possible with prospective studies with discrete age cohorts.11,16
Total brain density histogram analysis as a function of age yields several findings. The overall brain tissue density (mean density) increases in the neonatal period, consistent with early reports using single-slice brain CT ROI methods.13 The shape of the density histogram also changes, with rapidly decreasing histogram skewness in the first 200 days of life, reflecting a shift of the histogram toward higher density and an increasing percentage of higher density voxels during this period (Fig 3). Major changes in brain tissue known to occur in this time include an overall decrease in the percentage of water in the tissue,22 and a relative increase in gray matter volume.9,12,23 Both factors would be expected to contribute to the increase in density and the changes in the attenuation histogram.
Direct segmentation of brain CT yields gray and white matter maps, which can be characterized for density and volume, showing a relative increase in gray matter in the first 2 years, with steeper changes in the first 200 days, as well as an increase in both gray and white matter density during early brain development. Previous studies based on MR imaging have shown that rapid changes in brain volume occurring in the immediate postnatal period relate to an increase in gray matter volume,9,12,23,24 which, in turn, is thought to reflect synapse formation and the development of the neuropil.12 Decreases in water diffusion seen in brain tissue during this time may reflect, in part, myelination and a decreasing tissue-water fraction.15,22
Although clinical CT machines are subject to routine calibration, with an accepted margin of error,25 the effect of variations between machines becomes important in quantitative studies. Our curve fitting represents a feasibility study rather than a true predictive, universal, or optimal model, however, because various alternative statistical models were not evaluated and the contributions of small differences in scan platform and data acquisition were not fully explored. Rather our goal was to illustrate the feasibility of such model development based on digital analysis of head CT images. Appreciation of the possibility of such modeling serves to emphasize the value of quantitative imaging and underscore the value of higher standards in image acquisition and hardware calibration.
Conclusions
Changes in brain radiodensity are highly correlated with developmental age, and normative metrics of the brain radiodensity histogram derived from routine clinical head CT images can be used to develop a model of normal brain development. Histogram analysis is amenable to automation, and digital analysis together with normative metrics derived from head CT images may be used to improve the sensitivity of head CT in the detection of subtle brain injury and neurodevelopmental disorders.
Footnotes
Previously presented as a scientific paper at: Annual Meeting of The Eastern Neuroradiological Society, August 24–27, 2017; Toronto, Ontario, Canada.
References
- Received October 2, 2017.
- Accepted after revision December 11, 2017.
- © 2018 by American Journal of Neuroradiology


