
Abstract
BACKGROUND AND PURPOSE: Conventional MR imaging scoring is a valuable tool for risk stratification and prognostication of outcomes, but manual scoring is time-consuming, operator-dependent, and requires high-level expertise. This study aimed to automate the regional measurements of an established brain MR imaging scoring system for preterm neonates scanned between 29 and 47 weeks' postmenstrual age.
MATERIALS AND METHODS: This study used T2WI from the longitudinal Prediction of PREterm Motor Outcomes cohort study and the developing Human Connectome Project. Measures of biparietal width, interhemispheric distance, callosal thickness, transcerebellar diameter, lateral ventricular diameter, and deep gray matter area were extracted manually (Prediction of PREterm Motor Outcomes study only) and automatically. Scans with poor quality, failure of automated analysis, or severe pathology were excluded. Agreement, reliability, and associations between manual and automated measures were assessed and compared against statistics for manual measures. Associations between measures with postmenstrual age, gestational age at birth, and birth weight were examined (Pearson correlation) in both cohorts.
RESULTS: A total of 652 MRIs (86%) were suitable for analysis. Automated measures showed good-to-excellent agreement and good reliability with manual measures, except for interhemispheric distance at early MR imaging (scanned between 29 and 35 weeks, postmenstrual age; in line with poor manual reliability) and callosal thickness measures. All measures were positively associated with postmenstrual age (r = 0.11–0.94; R2 = 0.01–0.89). Negative and positive associations were found with gestational age at birth (r = –0.26–0.71; R2 = 0.05–0.52) and birth weight (r = –0.25–0.75; R2 = 0.06–0.56). Automated measures were successfully extracted for 80%–99% of suitable scans.
CONCLUSIONS: Measures of brain injury and impaired brain growth can be automatically extracted from neonatal MR imaging, which could assist with clinical reporting.
ABBREVIATIONS:
- DGMA
- deep gray matter area
- dHCP
- developing Human Connectome Project
- GA
- gestational age at birth
- ICC
- intraclass correlation coefficient
- LoA
- 95% limits of agreement
- LVD
- lateral ventricular diameter
- PMA
- postmenstrual age
- PPREMO
- Prediction of PREterm Motor Outcomes study
- SEM
- standard error of measurement
- TEA
- term-equivalent age
Conventional brain MR imaging scoring of preterm infants classifies injury and impaired growth and contributes to risk stratification and neurodevelopment outcome prognosis.1 Preterm infants are at risk of adverse motor,2,3 cognitive,2,4 and behavioral outcomes.2,5,6 Although survival rates for premature birth have improved7,8 and cerebral palsy rates are declining,9,10 long-term developmental impairments remain concerning.7,8,11 Neuroimaging is becoming more common in preterm infants before discharge from the neonatal intensive care unit and offers an opportunity for early prognosis. Near term age, the brain undergoes rapid growth.12,13 Abnormalities identified during this period have potential as predictors of neurodevelopment in children born preterm14 and can help identify infants at risk of subsequent motor and cognitive delay. Early detection of these infants allows the efficacy of potential early treatments to be assessed.
A recent standardized conventional scoring system for MR imaging of preterm infants evaluates the severity of cerebral WM, cortical GM, deep GM, and cerebellar and global abnormalities.15,16 These composite scores of abnormalities and their submeasures, derived from early (29–35 weeks' postmenstrual age [PMA]) or term-equivalent age (TEA) MR imaging, are associated with motor and cognitive outcomes.1,17⇓⇓-20 George et al1 (n = 83 early; n = 77 TEA) found that global brain, WM, and deep GM abnormalities at early and TEA MR imaging and cerebellar abnormalities at TEA MR imaging were associated with neurologic, sensory, motor, and cognitive outcomes at 1-year follow-up. Several studies have also shown associations between abnormalities on TEA MR imaging and cognitive and/or motor outcomes at 2-year follow-up, for WM,17⇓-19 GM,17 and global abnormalities20 and submeasures (ie, ventricular dilation20 and smaller cerebellar diameter18,20). Others found no association with outcomes.21 Furthermore, abnormalities at TEA MR imaging have been related to longer-term developmental outcomes.22⇓⇓-25 WM abnormalities were associated with poorer motor outcomes at 5-year follow-up,22 delayed language development,23 poorer executive functioning,23 and lower general intelligence at 4- and 6-year follow-up,23 as well as poorer cognitive outcomes at 4-,23 6-,23 7-,24 and 9-year follow-up. Anderson et al24 also reported that global brain and deep GM abnormalities at TEA MR imaging were associated with poorer cognitive outcomes at 7-year follow-up,24 including general intelligence, spelling, math, and motor function. Possible reasons for these discrepancies between studies include differences in the sampled population and MR imaging acquisition, rater variability, sample size, and heterogeneity, including brain injury severity.
Manual scoring is time-consuming and requires expertise in neonatal neuroimaging and is, therefore, impractical for larger data sets and clinical practice. This study aimed to automate the 6 regional measurements of a conventional MR imaging scoring system that are based on distance and area (accounting for approximately half the measures in the scoring system) to improve reproducibility and clinical utility. We automated the extraction of biparietal width, interhemispheric distance, thickness of the corpus callosum (at the genu, midbody, and splenium), transcerebellar diameter, left and right lateral ventricular diameter (LVD), and deep gray matter area (DGMA) for MRIs acquired between 29 and 47 weeks' PMA. Agreement, reliability, and associations between automated and manual measures were examined, as well as for manual test-retest data for comparison. We hypothesized at least a moderate association between automated and manual measures. Finally, we examined the association between each measure with PMA and gestational age at birth (GA), hypothesizing that automated measures would show associations similar to those of the manual measures.
MATERIALS AND METHODS
Study Design and Participants
Data were included from the Prediction of PREterm Motor Outcomes (PPREMO) study26 (longitudinal study of very preterm infants) and the developing Human Connectome Project (dHCP)27 (cross-sectional study including preterm and term-born infants). PPREMO recruited preterm infants born <32 weeks' GA with no congenital or chromosomal abnormalities and a reference sample of term-born infants (38–42 weeks' GA, birthweight >10th percentile) with an uncomplicated pregnancy, delivery, and postpartum period. Study design and protocol are available.26 Ethical approval was obtained from the Royal Brisbane and Women's Hospital Human Research Ethics Committee (HREC/12/QRBW/245), The University of Queensland (2012001060), and the trial was registered with the Australian New Zealand Clinical Trials Registry (ACTRN12613000280707). The dHCP study (second release) includes the largest multimodal neonatal open-access data set (http://www.developingconnectome.org/project/). Details of the structural preprocessed data are available.13 Ethics approval was obtained from the National Research Ethics Committee (REC:14/LO/1169). For both data sets, informed written parental consent was obtained for each infant, and local ethics approval for using the data for the current study was obtained from the CSIRO Health and Medical Human Research Ethics Committee (2020_051_LR).
MR Image Acquisition
PPREMO infants were scanned during natural sleep (no sedation or anesthesia) at the Royal Brisbane and Women's Hospital on a 3T MR imaging scanner (Tim Trio; Siemens) in an MR imaging–compatible incubator with a dedicated neonatal head coil (LMT Lammers Medical Technology). MR imaging noise was attenuated using MiniMuffs (Natus Medical). Infants were monitored with pulse oximetry. T2WI TSE volumes were acquired in the axial plane with the following parameters:26 TR/TE = 10,580/189 ms, flip angle = 150°, FOV = 144 × 180 mm, matrix = 204 × 256, voxel size = 0.7 × 0.7 × 2 mm3. Infants were scanned at 29–35 weeks' PMA (early MR imaging) and again at TEA.
Images for dHCP were acquired on a 3T MR imaging scanner (Achieva; Philips Healthcare) with a dedicated neonatal head coil.27 We used the provided motion-corrected and super-resolution reconstructed images,28 with a resolution of 0.5 × 0.5 × 0.5 mm3.13
Conventional MR Imaging Scoring (Manual)
As described in George et al,16 PPREMO images were manually rated using the standardized MR imaging scoring system.15 A neurologist with training in radiology and experience with neonatal MR imaging scoring (S.F.) scored images masked to clinical history (except PMA at scanning). Scoring methodology was confirmed by a senior neuroradiologist (A.C.). We manually obtained 6 raw measures of distance and area: biparietal width, interhemispheric distance, thickness of the corpus callosum at 3 locations, transcerebellar diameter, left and right LVD, and DGMA (Table 1).15 In addition, test-retest ratings were available for 20 infants (both time points): Scans were manually rated again by the same rater (S.F.) 1 month apart and by an independent blinded rater (J.B.), a pediatric radiologist. No manual ratings were available for dHCP.
Six manual measures of distance and area
Image Processing
For PPREMO, T2WIs were preprocessed with slice interpolation (up-sampling to a 0.7 × 0.7 × 1 mm3 resolution) and N4 bias field correction. T2WIs were segmented using the MILXView neuroimaging platform with the UNC neonate atlas29 and the 20 ALBERT atlas29,30 used to provide priors and 87 anatomic regions (Milx31). PPREMO scans were also segmented with the state-of-the-art dHCP parcellation pipeline. We did not use the dHCP parcellations for extraction of the measures for the PPREMO cohort, however, because several scans with a successful Milx segmentation had no successful dHCP segmentation available due to registration errors in the dHCP pipeline. For dHCP, preprocessed T2WIs and segmentation labels were downloaded.13 None of the segmentations were manually edited.
T2WIs were rigidly aligned to either an early or TEA PPREMO population template, depending on the age at scanning, using the FMRIB Linear Image Registration Tool (FLIRT; http://www.fmrib.ox.ac.uk/fsl/fslwiki/FLIRT).32 Segmentations were transformed to this space using the obtained transformation, ensuring that all scans had the same orientation for subsequent analysis steps, while preserving brain size and shape. Because the corpus callosum is a relatively thin region, segmentation errors may influence the results more significantly than other measures using larger segmentations. To evaluate this problem, we extracted callosal thickness measures twice for the PPREMO cohort using segmentations from both pipelines, allowing comparison of quantification between pipelines (Milx versus dHCP).
Extraction of Automated Measures
The automated pipeline (Table 2 and Fig 1) to extract raw measures uses the segmentation labels and Matlab software (MathWorks). A subsample of the PPREMO cohort (n = 85) was used to develop the Matlab pipeline. For callosal thickness, we increased the resolution (PPREMO: factor 5; dHCP: factor 4, considering T2WI resolution). The 97th percentile was chosen to identify the distance of the thickest location separately for each division of the corpus callosum, reflecting a location similar to that of the manual measures (in particular the genu and splenium), while ensuring that measurements were not driven by outliers. For each scan, automatically extracted measures were visually inspected and rated as “poor,” “usable” (some errors), or “good” (little-to-no error).

Automated MR imaging measures of biparietal width (BPW), interhemispheric distance (IHD), thickness of the corpus callosum (CC), transcerebellar diameter (TCD), left and right LVD, and DGMA. IHD, Blue to orange represents the distance (closest and farthest, respectively) for each voxel to the segmentation in the opposite hemisphere. CC, Upper image, T2WI with the CC segmentation border (red); lower panel, segmentation border (blue), skeleton (red), and distance between the upper and lower borders of the segmentation for each voxel on the skeleton (green). R indicates right; L, left; A, anterior; P, posterior.
Automated measures of distance and area
Statistical Analysis
Agreement between manual and automated measures is reported using standard error of measurement (SEM), and bias (ie, the mean difference of the measurements), with 95% limits of agreement (LoA). Bland-Altman plots were inspected for bias (separately for early and TEA MR imaging and for the combined sample). Reliability and associations between automated and manual measures were examined by calculating intraclass correlation coefficients (ICCs, type [3, 1]) and Pearson correlation coefficients (r), respectively. For comparison, reproducibility measures for manual test-retest data were calculated for PPREMO only, because manual measurements were not available for dHCP.
Next, automated measures were also validated by examining their association with PMA, GA, and birth weight (Pearson r) in both cohorts using R Statistics (Version 4.0.2; http://www.r-project.org). When one examines these associations, replicating results in an independent cohort is important. The smaller sample size of the PPREMO cohort may result in less power to detect an effect than in the dHCP cohort; conversely, a smaller sample size may also result in overestimating the effect size of associations or false-positives.
For all analyses, only automated measurements with a visual quality rating of “usable” or “good” were included. For reproducibility (ie, agreement and reliability) analyses, preterm-born infants scanned at TEA in the PPREMO cohort were merged with term-born infants. When we examined the association of measures with PMA, GA, or birth weight, outliers in automated and manual measures were removed using the Tukey lowerInner and upperInner fence, which was performed separately for each measure, as well as separately for scan age <37 weeks and above, and separately within the preterm and term-born group (at TEA MR imaging).
RESULTS
The final sample for PPREMO included 94 infants who underwent MR imaging between 29 and 36 weeks' PMA (78%; Online Supplemental Data), of which 81 infants were scanned again at 38–47 weeks' PMA (77%), and 22 term-born infants (81%). For dHCP, scans of 455 subjects were included (90%; Online Supplemental Data). Demographic details are presented in Table 3.
The 6 automated measures were successfully extracted for 80%–99% of the final scans with a usable segmentation, equivalent to 56%–85% of total scans (Online Supplemental Data) because 14%–30% of the total scans were excluded due to poor quality, realignment errors, poor segmentation, and severe pathology (Online Supplemental Data). Our pipeline was successful for >93% of the suitable PPREMO scans, except for interhemispheric distance (74%) and LVD (left: 78%; right, 61%), and >92% of the suitable dHCP scans, except for callosal thickness measures (75%–88%). Automated biparietal width, transcerebellar diameter, LVD, and DGMA measures showed good agreement, good reliability, and a strong association with manual measures (Online Supplemental Data; SEM = 0.40–2.61, bias = 0.14–5.70, LoA = –4.81–12.92, ICC = 0.77–0.97, r = 0.77–0.98, P < .001). Findings (ie, agreement, reliability, and associations between automated and manual measures) were similar for both time points (Online Supplemental Data) and in line with the good-to-excellent interrater agreement and reliability for the respective manual measures (except for poorer agreement and reliability for the manual DGMA: SEM = 0.56–0.59, bias = –0.09, LoA = –1.73–1.55, ICC = 0.36–0.67, r = 0.36–0.69; Online Supplemental Data). The automated interhemispheric distance showed a moderate agreement, reliability, and association with the manual measure (SEM = 0.73, bias = –0.58, LoA = –2.59–1.44, ICC = 0.59, r = 0.59, P < .001), but poor reliability and a weak association was found at early MR imaging (SEM = 0.66, bias = –0.44, LoA = –2.27–1.39, ICC = 0.26, r = 0.26, P < .05), in line with poor interrater reliability and the weak association for manual test-retest data at early MR imaging (SEM = 0.56, bias = –0.04, LoA = –1.57–1.50, ICC = 0.23, r = 0.23; Online Supplemental Data).
Automated callosal thickness measures showed poor-to-no agreement, poor reliability, and a weak-to-no association with the manual measures (SEM = 0.77–1.87, bias = 2.76–5.85, LoA = –0.05–10.32, ICC = 0.01–0.24, r = 0.03–0.35; Online Supplemental Data), whereas a moderate agreement, reliability, and association were found for manual test-retest data (SEM = 0.23–0.46, bias = –0.34–0.12, LoA = –1.61–1.29, ICC = 0.41–0.70, r = 0.41–0.70; Online Supplemental Data). Different measurement techniques likely contributed to the lack of agreement between automated and manual callosal thickness measures. For the automated measures, thickness is derived from multiple measurements and calculated as the distance between the upper and lower segmentation border (measuring perpendicular to the corpus callosum skeleton), whereas the distance for the manual measures is based on a single measurement and measured exactly anterior-posterior (genu and splenium) or inferior-superior (midbody). Care needs to be taken when using manual and automated measures interchangeably because a bias was observed for the callosal thickness measures in the Bland-Altman plots (Online Supplemental Data), with larger automated than manual values for smaller thickness values and smaller automated than manual values for larger thickness values. Examining the distribution of manual and automated measures, however, showed more clustering of time points for automated versus manual measures (Online Supplemental Data). The parcellation software used to extract the corpus callosum segmentation (Milx versus dHCP) influenced the derived measures for the PPREMO cohort slightly, shown by overlapping 95% confidence intervals for reproducibility statistics observed between manual and automated callosal thickness measures (Online Supplemental Data). The reliability of the callosal thickness measures derived from the 2 segmentations was fair to good (genu ICC = 0.74 [0.66–0.81]; midbody ICC = 0.73 [0.65–0.80]; splenium ICC = 0.54 [0.42–0.65]; P < .001).
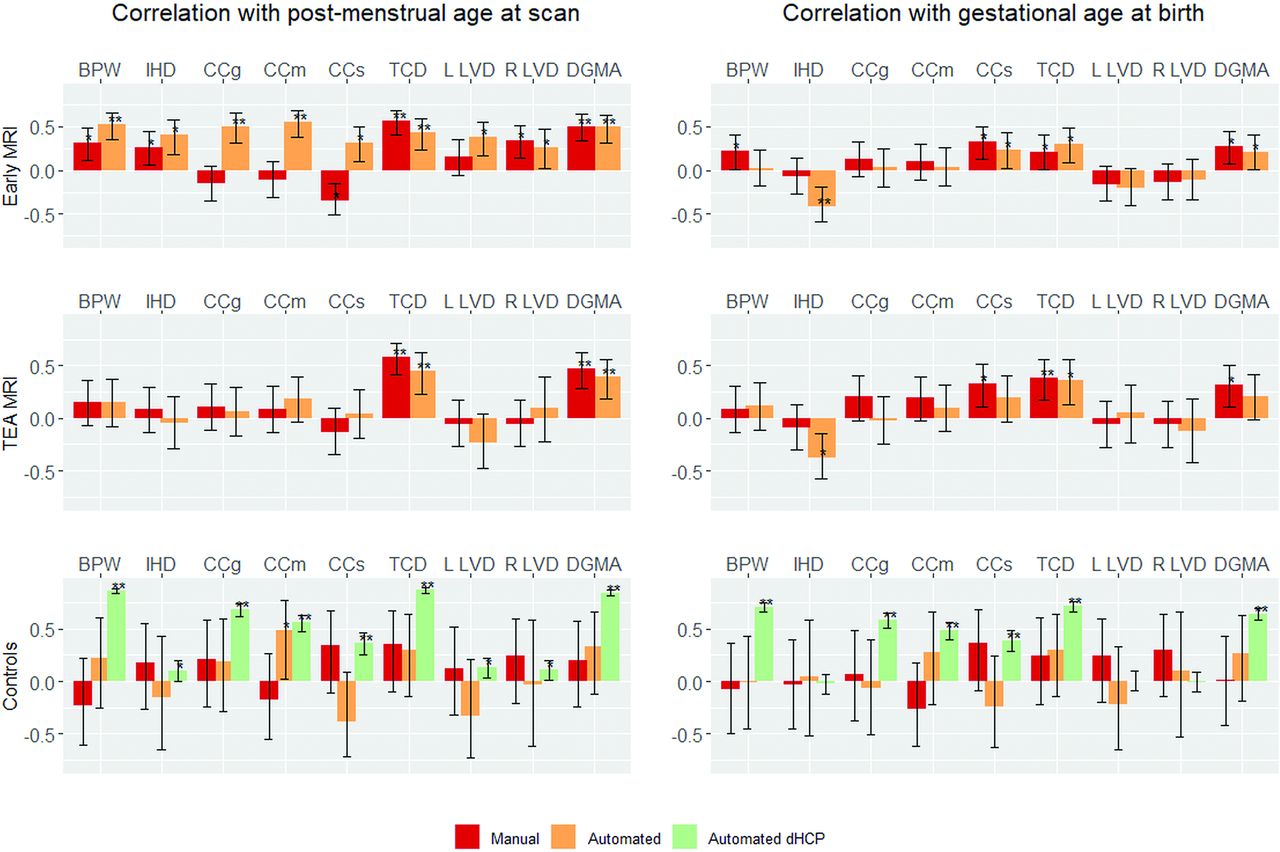
All automated measures (except right LVD in dHCP) showed a positive association with PMA for both the PPREMO (combining both time points; Online Supplemental Data) and dHCP cohorts (r = 0.11–0.94; Online Supplemental Data and Fig 2 left). These associations were similar to those found between the manual measures and PMA for all measures except callosal thickness (Online Supplemental Data). Automated callosal thickness measures showed stronger (and positive) associations with PMA than the manual measures (Online Supplemental Data), whereas some manual callosal thickness measures showed a counterintuitive negative association with PMA (at early MR imaging only) (Fig 2, left).

Associations between the 6 raw conventional MR imaging measures with postmenstrual age (left) and gestational age at birth (right) in the Pearson r, displayed separately for preterm-born infants at early MR imaging (n = 94) and TEA MR imaging (n = 81), as well as term-born controls at TEA MR imaging (PPREMO, n = 22; dHCP, n = 455). Manual measures were available for PPREMO only. Double asterisks indicate P ≤ .001; asterisk, P ≤ .05. BPW indicates biparietal width; CC, callosal thickness (at the genu (CCg), midbody (CCm), and splenium (CCs)); IHD, interhemispheric distance; TCD, transcerebellar diameter; R, right; L, left.
The associations with PMA were not always consistent across early and TEA MR imaging for the PPREMO cohort (Fig 2, left). All automated measures were positively associated with PMA at early MR imaging, while only transcerebellar diameter and DGMA showed a positive association at TEA MR imaging (a similar trend was observed for the manual measures) (Fig 2, left). In comparison, only callosal thickness at the midbody showed a positive association with PMA in the PPREMO term-born sample, but these results should be seen in light of the much smaller sample size. In the dHCP, which includes both preterm and term-born infants, all automated measures were positively associated with PMA (Fig 2, left); these associations remained after removing all early MR imaging scans (scans with PMA <37 weeks) and also, when examining the associations between measures with PMA within the term-born group only.
Several automated measures (biparietal width, callosal thickness at the genu and splenium, transcerebellar diameter, and DGMA) also showed a positive association with GA across cohorts (r = 0.34–0.71; Online Supplemental Data and Fig 2, right), while the automated interhemispheric distance showed a negative association with GA for the PPREMO cohort only (r = –0.26; Online Supplemental Data). In addition, the automated left and right LVD were not associated with GA (Online Supplemental Data and Fig 2, right). Associations were in the same direction as the associations observed for the manual measures (Online Supplemental Data and Fig 2, right). Measures derived from early versus TEA MR imaging showed a similar association with GA (Fig 2, right), except that the associations with GA for the manual biparietal width and automated callosal thickness at the splenium were found at early MR imaging only. Associations between the measures with birth weight were similar to those found for gestational age (Online Supplemental Data).
DISCUSSION
In this study, we developed and validated a method to automatically derive 6 measures of brain growth and development based on raw measurements of distance and area (biparietal width, interhemispheric distance, callosal thickness, transcerebellar diameter, LVD, and DGMA). These measures account for approximately half the measures of the standardized conventional MR imaging scoring system.15 Conventional MR imaging scores have been linked to outcomes and may assist with early diagnosis and streamlining identified at-risk infants into early intervention. We automated these measures for early and TEA MR imaging to make scoring more time-efficient and objective, enabling its use in clinical and research settings. Automated measures (except for interhemispheric distance and callosal thickness) showed good agreement and reliability as well as a strong association with manual measures in the prospective PPREMO cohort (early MR imaging, n = 94; TEA MR imaging, n = 103). Furthermore, all automated measures showed similar or stronger associations with PMA compared with the manual measures, which were replicated in an independent cohort including mostly TEA MR imaging (dHCP n = 455, except for the right LVD). All measures (except the LVD) showed an association with GA, though not all associations were found across cohorts.
Our findings are in line with those in our previous study of the PPREMO cohort,16 which reported several positive associations between the manual measures with PMA, as part of validating the manual measures for preterm-born cohorts derived from early and TEA MR imaging. Other studies15,33 have shown positive associations with PMA for the manual biparietal width, transcerebellar diameter, and DGMA—the measures for which we found the strongest associations. In addition, most associations with PMA were similar for the automated versus manual measures, but the automated callosal thickness measures were more strongly associated with PMA. The automated callosal thickness measures may be more sensitive than the manual measures because these were derived from multiple measurement points.
Associations with PMA were somewhat different for early versus TEA MR imaging. All measures were associated with PMA at early MR imaging, but only the transcerebellar diameter and DGMA were associated with PMA at TEA MR imaging, in line with others showing no association with PMA for interhemispheric distance, callosal thickness, and LVD when deriving measures at TEA MR imaging15,33 or in the first year.34 Regional differences in growth trajectories may explain these inconsistencies between early and TEA MR imaging. Between 27 and 45 weeks' PMA, total brain growth peaks at 35 weeks,35 but regional differences exist, with WM and subcortical GM peaking earlier (at 33 and 31 weeks, respectively),35 whereas the cerebellum (at 37 weeks) as well as CSF and cortical GM (both at 38–39 weeks) peak later.35 Acquiring MR imaging measures at both early and TEA MR imaging may provide additional information on whether brain growth is progressing as expected, which could be valuable for prediction modeling of clinical outcomes.
All automated measures (except LVD) were associated with GA in at least 1 cohort, similar to findings in previous studies using the manual measures,33,36 except for 1 study33 finding a negative association between GA and LVD. These findings reflect impaired brain growth in preterm-born infants compared with term-born infants, in line with others15 who showed smaller biparietal width, callosal thickness, transcerebellar diameter, and DGMA but larger interhemispheric distance and LVD in preterm compared with term-born infants. Furthermore, a recent large volumetric study35 (n = 420) showed larger ventricular volumes and smaller total GM (cortical and subcortical) and WM volumes with lower GA. Another large study37 (n = 285) found smaller volumes for most brain regions with lower GA, but other regions (primary visual, motor, and somatosensory regions) were larger with lower GA, possibly reflecting increased development in response to the ex-utero environment.
There are some limitations to this study. First, the automated method to extract the regional conventional MR imaging measures depends on an accurate segmentation of the brain, resulting in only 70%–86% of the total scans being suitable for our Matlab pipeline (depending on the measure) because we visually inspected segmentations and excluded scans with segmentation errors, poor scan quality (eg, motion), and severe pathology. Different segmentation pipelines may influence the measures to some extent, but differences between measures from different segmentations are likely to be the result of segmentation errors rather than differences between segmentations per se, with the segmentation quality influenced by the age of the templates used and different data used to derive the algorithm. Our aim to automate the Kidokoro measures15 included the idea that our Matlab pipeline is not specific to 1 particular segmentation software, particularly because different pipelines may work better for a specific patient cohort than others.
Although we aimed to make the automated measures as similar to the manual measures as possible, some differences between measures likely exist due to differences in measurement techniques. For example, the automated interhemispheric distance is derived from the distance between the voxels of the superior frontal gyri, which may not always measure the distance at the crowns. We focused on 2D measures to enable comparison between manual and automated measures, allowing for manual scoring of scans without a successful brain parcellation, for example in cases with severe pathology. These 2D measures, however, are likely influenced by variation in slice selection (particularly interhemispheric distance and LVD), which could be improved using 3D measures. Furthermore, findings were inconsistent for the manual versus automated callosal thickness measures, with negative associations found for the manual measures with PMA at early MR imaging, but positive associations were found for the automated measures with PMA.
Bland-Altman plots showed a bias. Automated measures may overestimate thickness for smaller values, but manual measures may underestimate thickness. Agreement and reliability for manual callosal thickness measures were poor and poor-to-moderate, respectively (Online Supplemental Data), and other studies35,38 showed a positive growing trajectory for callosal thickness, suggesting that findings for the manual measures at early MR imaging may be the result of measurement error. Manual measurements of callosal thickness are subject to several challenges because the corpus callosum is very thin, particularly at early MR imaging. Thickness may be difficult to measure with a voxel size of 0.7 mm with the ruler not being sensitive to very small increments, and partial volume, technical artifacts (eg, motion), and the presence of the cavum septi pellucidi may impact the visualization.
Our study provides initial automating of conventional MR imaging scoring for preterm neonates, which enables clinicians to use the scoring system without manually measuring the 6 measures of distance and area, resulting in a more time-efficient and consistent routine neonatal MR imaging clinical scoring system. Our automated method enables extraction for large research data sets, facilitating the development of well-established cutoff scores and more reliable and clinically relevant prediction models to assist clinicians with early diagnosis and intervention. Future work is needed to establish a reference cohort to define the cutoffs for the automated measures and to examine the association between the measures and prospective clinical outcomes.
CONCLUSIONS
We validated an approach to automatically extract approximately half the measures of a conventional brain MR imaging scoring system for preterm-born infants using T2WI acquired between 29 to 47 weeks' PMA, which will enhance the use of this scoring system in both clinical and research settings.
Demographic and clinical characteristics
ACKNOWLEDGMENTS
We sincerely thank the families of preterm infants in the PPREMO study, the staff of the neonatal unit, radiology and medical imaging, Dr Melissa Lai, Donna Hovey, and Kellie McGrory, and families in the dHCP trial.
Footnotes
L.v.E now works for the Department of Psychology, College of Healthcare Sciences, Division of Tropical Health and Medicine, James Cook University, Townsville, Australia.
The Prediction of PREterm Motor Outcomes study was funded by the Cerebral Palsy Alliance Research Foundation (IRG1413), Financial Markets Foundation for Children (2014-074), and Queensland Government (Smart State; Health Practitioner Stimulus Grant). The developing Human Connectome Project (King's College London-Imperial-Oxford Consortium) was funded by the European Research Council under the European Union Seventh Framework Program (FP/2007-2013)/European Research Council Grant Agreement No. 319456, In addition, the authors were supported by the University of Queensland (University of Queensland Research Scholarship [J.M.G.], Centennial Scholarship [K.P.], International Postgraduate Research Scholarship [K.P.]), and National Health and Medical Research Council (Research Fellowship 103887 [R.N.B.]).
Disclosures: Liza van Eijk—RELATED: Grant: Various, Comments: Prediction of PREterm Motor Outcomes Study–Cerebral Palsy Alliance Research Foundation (IRG1413), Financial Markets Foundation for Children (2014-074), Queensland Government (Smart State; Health Practitioner Stimulus Grant), developing Human Connectome Project (KCL-Imperial-Oxford Consortium), European Research Council under the European Union Seventh Framework Program (FP/2007-2013)/European Research Council Grant Agreement no. [319456], The University of Queensland (University of Queensland Research Scholarship [JMG], Centennial Scholarship [KP], International Postgraduate Research Scholarship [KP]), and National Health and Medical Research Council (Research Fellowship 103887 [RNB]).* UNRELATED: Employment: The University of Queensland (12/2020). Kerstin Pannek—RELATED: Grant: various, Comments: grants from the Cerebral Palsy Alliance Research Foundation (IRG1413), the Financial Markets Foundation for Children (2014-074), and the Queensland Government (Smart State; Health Practitioner Stimulus Grant) supported this project*; UNRELATED: Grants/Grants Pending: National Health and Medical Research Council, Comments: APP1078877, APP1084032, APP1120031, APP1144846, APP1152800, APP1182938.* Joanne M. George—UNRELATED: Employment: The University of Queensland. Dana Bradford—RELATED: Grant: Prediction of PREterm Motor Outcomes study funded by the Cerebral Palsy Alliance Research Foundation (IRG1413), Financial Markets Foundation for Children (2014-074), Queensland Government (Smart State; Health Practitioner Stimulus Grant)*; Other: author scholarships: Centennial Scholarship (KP), International Postgraduate Research Scholarship (KP)*; UNRELATED: Employment: Commonwealth Scientific and Industrial Research Organisation, Comments: salary. Jurgen Fripp—RELATED: Grant: National Health and Medical Research Council, Comments: The National Health and Medical Research Council (https://www.nhmrc.gov.au/) funded the cohort study on which this article was based*; UNRELATED: Grants/Grants Pending: National Health and Medical Research Council, Comments: We are involved in a range of National Health and Medical Research Council–funded grants in collaboration with the University of Queensland in the field of Cerebral Palsy and Neurodevelopment.* *Money paid to the institution.
References
- Received December 24, 2020.
- Accepted after revision May 3, 2021.
- © 2021 by American Journal of Neuroradiology


Jump to section
Related Articles
Cited By...
- No citing articles found.