
Abstract
BACKGROUND AND PURPOSE: Achieving a specific diagnosis in leukodystrophies is often difficult due to clinical and genetic heterogeneity. Mitochondrial defects cause 5%–10% of leukodystrophies. Our objective was to define MR imaging features commonly shared by mitochondrial leukodystrophies and to distinguish MR imaging patterns related to specific genetic defects.
MATERIALS AND METHODS: One hundred thirty-two patients with a mitochondrial leukodystrophy with known genetic defects were identified in the data base of the Amsterdam Leukodystrophy Center. Numerous anatomic structures were systematically assessed on brain MR imaging. Additionally, lesion characteristics were scored. Statistical group analysis was performed for 57 MR imaging features by hierarchic testing on clustered genetic subgroups.
RESULTS: MR imaging features indicative of mitochondrial disease that were frequently found included white matter rarefaction (n = 50 patients), well-delineated cysts (n = 20 patients), T2 hyperintensity of the middle blade of the corpus callosum (n = 85 patients), and symmetric abnormalities in deep gray matter structures (n = 42 patients). Several disorders or clusters of disorders had characteristic features. The combination of T2 hyperintensity in the brain stem, middle cerebellar peduncles, and thalami was associated with complex 2 deficiency. Predominantly periventricular localization of T2 hyperintensities and cystic lesions with a distinct border was associated with defects in complexes 3 and 4. T2-hyperintense signal of the cerebellar cortex was specifically associated with variants in the gene NUBPL. T2 hyperintensities predominantly affecting the directly subcortical cerebral white matter, globus pallidus, and substantia nigra were associated with Kearns-Sayre syndrome.
CONCLUSIONS: In a large group of patients with a mitochondrial leukodystrophy, general MR imaging features suggestive of mitochondrial disease were found. Additionally, we identified several MR imaging patterns correlating with specific genotypes. Recognition of these patterns facilitates the diagnosis in future patients.
ABBREVIATIONS:
- KSS
- Kearns-Sayre syndrome
- SDH
- Succinate dehydrogenase
- MELAS
- mitochondrial encephalopathy, lactic acidosis, and stroke-like episodes syndrome
- MNGIE
- mitochondrial neurogastrointestinal encephalopathy
Leukodystrophies are genetic disorders predominantly involving the white matter of the CNS.1 Clinical and genetic heterogeneity complicate establishing a specific molecular diagnosis, which becomes more effective when clinical, radiologic, and genetic parameters are combined.1 Most leukodystrophies are characterized by a specific combination of affected structures on MR imaging, constituting a recognizable pattern. Recent diagnostic algorithms for leukodystrophies acknowledge the central role of MR imaging pattern recognition.1,2
A subset of leukodystrophies, involving 5%–10%, is caused by mitochondrial defects.3,4 Mitochondrial diseases comprise a group of disorders with genetic defects in mitochondrial oxidative energy metabolism. Mitochondria are cellular organelles that produce energy via oxidative phosphorylation (Online Supplemental Data). The oxidative phosphorylation system consists of 5 respiratory chain complexes in the mitochondrial membrane. Human cells possess 2 different genomes: the nuclear genome, containing approximately 20,000 genes, and the mitochondrial genome, containing 37 genes. Although mitochondria have functions in addition to energy metabolism, mitochondrial diseases are typically regarded as disorders of oxidative phosphorylation.5 They are caused by variants in either mitochondrial genes or, much more frequently, nuclear genes encoding proteins necessary for mitochondrial function.5 Concerning the high number of associated gene defects, it is not surprising that mitochondrial disorders have a striking clinical heterogeneity;5 the high energy demand of the CNS explains it being the most commonly affected organ.5
Some mitochondrial encephalopathies predominantly manifest with lesions of gray matter structures (eg, mitochondrial encephalopathy, lactic acidosis, and stroke-like episodes syndrome (MELAS); Alpers syndrome; and Leigh syndrome).6 Another category manifests as leukodystrophy.7 The leukoencephalopathy in Kearns-Sayre syndrome (KSS)8 and mitochondrial neurogastrointestinal encephalopathy syndrome (MNGIE)9 has been known for a long time, but more recently, next-generation genetic sequencing techniques have revealed that numerous unsolved cases of leukodystrophy have a mitochondrial cause, and MR imaging patterns of new mitochondrial leukodystrophies were added.10 Patient selection by specific MR imaging patterns was pivotal in the detection of the novel leukodystrophies caused by defects in the genes LYRM7, APOPT1, NUBPL, and CLPP.11⇓⇓-14 However, systematic studies on MR imaging patterns in larger groups of patients with different mitochondrial leukodystrophies are lacking, and information on the associated MR imaging patterns is lacking in recent leukodystrophy diagnostic algorithms.1,2
In the current study, we systematically analyzed MRIs of a large group of patients with mitochondrial leukodystrophy. In all patients, the causative gene defect was known. The study aims were to describe MR imaging features suggesting a mitochondrial leukodystrophy in general and to distinguish MR imaging patterns related to particular gene defects.
MATERIALS AND METHODS
Patients
In the MR imaging data base of the Amsterdam Leukodystrophy Center, comprising more than 4000 patients, 132 patients with a mitochondrial leukodystrophy and a known gene defect were identified. Patients with defects in genes encoding mitochondrial transfer RNA synthetases were excluded because the MR imaging patterns associated with the respective disorders have been well-described in separate studies and their high numbers in the data base would dominate the current study.15⇓⇓-18 The retrospective phenotype analysis study was approved by the Ethics Committee of the VU University Medical Center.
Of the 132 patients, 43 had a respiratory chain complex 1 defect: 22 with variants in the genes NDUFV1, 1 in NDUFV2, 10 in NDUFS1, 2 in NDUFS3, 2 in NDUFS4, 1 in NDUFS6, 1 in NDUFS7, 3 in NDUFS8, and 1 in NDUFAF5. Complex 2 deficiency was present in 22 patients: 4 with variants in SDHA, 5 in SDHB, and 10 in SDHAF1; in 3 patients with biochemical evidence of complex 2 deficiency, the gene defect was not determined, and in one of them the SDHA protein expression was reduced. Most of these patients were part of a previous study on complex 2 deficiency.19 Complex 3 deficiency was present in 10 patients, all with variants in LYRM7. Some were part of a previous study on LYRM7.14 Complex 4 deficiency was present in 9 patients: 7 with variants in APOPT1, 1 with variants in COX6B, and 1 with variants in COX10. Most patients with APOPT1 variants were part of a previous study on APOPT1.12 Iron-sulfur cluster assembly pathway variants were present in 33 patients: 9 with variants in NUBPL, 8 in IBA57, 7 in ISCA2, 5 in FDX1L, 3 in BOLA3, and 1 in CDK5RAP1. Descriptions of some of the patients with NUBPL,11 IBA57,20 and FDX1L21 variants were published before. A large mitochondrial DNA deletion was present in 6 patients, all presenting with the KSS phenotype. Additionally, 4 patients had TYMP variants, indicative of MNGIE, and 5 patients had CLPP variants; descriptions of some of the latter have been published before.13
MR Imaging Evaluation
At least 1 brain MR imaging was available for each patient. When multiple MRIs were available, the first was used for analysis. MR sequences and image quality were variable because the MRIs were acquired at multiple institutions. T2-weighted and nonenhanced T1-weighted sequences were available for every patient; FLAIR was available for 115 patients. These images were used to systematically score numerous white and gray matter structures as normal or abnormal, and specific features of the abnormalities were scored, as described in van der Knaap et al.22 More salient features of this scoring system were as follows: The white matter was divided into 3 zones—directly subcortical white matter (ie, arcuate fibers), deep white matter, and periventricular white matter. The corpus callosum was divided into inner, middle, and outer blades (or layers) and anterior, middle, and posterior parts. Cysts were strictly scored as lesions with a signal intensity identical to that of CSF on FLAIR images, whereas lesions having a signal intensity on FLAIR intermediate between normal white matter and CSF were defined as rarefaction. The caudate nucleus, putamen, globus pallidus, thalamus, dentate nucleus, substantia nigra, cerebral cortex, and cerebellar cortex were individually evaluated.
Statistical Analysis
Group analysis was performed with 57 MR imaging features. We first analyzed which abnormalities were most commonly observed among our 132 patients.
Considering the large number of different genetic subgroups, it was unlikely that specific patterns would survive multiple comparison analysis. We therefore clustered genetic subgroups. First, patients were clustered in 9 groups: complex 1; complex 2; complex 3; complex 4; iron-sulfur cluster defects excluding NUBPL; NUBPL; MNGIE; KSS; and CLPP. This clustering was partly on the basis of the type of mitochondrial defect and partly on the basis of prior knowledge from personal experience and reviewing the MRIs. To further reduce the number of subgroups, we visually inspected a heat map of the data, in which the patients were ordered by genetic subtype and the features were clustered using unsupervised hierarchical cluster analysis. No differences were observed between defects of complexes 3 and 4, and they were clustered. NUBPL and KSS were considered separately. Complex 1 defects were clustered together with the remaining genetic subgroups, so, patients were clustered in 5 groups: complex 2; complexes 3 and 4; NUBPL; KSS; and other.
To identify which MR imaging features correlated with the 5 subgroups, we performed hierarchical testing. First, the association of each feature with the overall group structure was tested. Then, for each significant feature, the association with each of the 5 subgroups was tested. Fisher exact tests were used with Holm-Bonferroni correction for multiple testing to control the maximum family-wise error rate at 0.05.
RESULTS
MR Imaging Findings
The age of patients at the time of their first available MR image ranged from the first month of life to 46 years of age.
T2 hyperintensity affecting the middle blade of the corpus callosum, while sparing thin inner and outer blades, was noted in 85 of our 132 patients (Fig 1). Brain stem lesions were found in 66 patients (Fig 1). These included selective involvement of certain tracts, such as part of the corticospinal tracts in 32 patients but also more diffuse or ill-defined brain stem lesions. Symmetric T2 hyperintensity in the middle cerebellar peduncles was found in 42 patients (Fig 1). Rarefaction of white matter lesions was found in 50 patients; cystic lesions were found in an additional 20 patients. These cysts were typically well-delineated (Fig 1). Symmetric abnormalities of deep gray matter structures were found in 42 patients (Fig 1), more specifically in the thalamus in 34, substantia nigra in 13, globus pallidus in 9, putamen in 8, and caudate nucleus in 5. Cerebellar atrophy was found in 23 patients. Multifocal enhancement was found in 31 of 66 patients with contrast-enhanced images, most frequently at the edges of lesions (Fig 1). Multifocal diffusion restriction was found in 68 of 84 patients with diffusion-weighted images, again, most frequently at the lesion edges (Fig 1). Elevated lactate levels were found in 31 of 49 patients with MR spectroscopy.
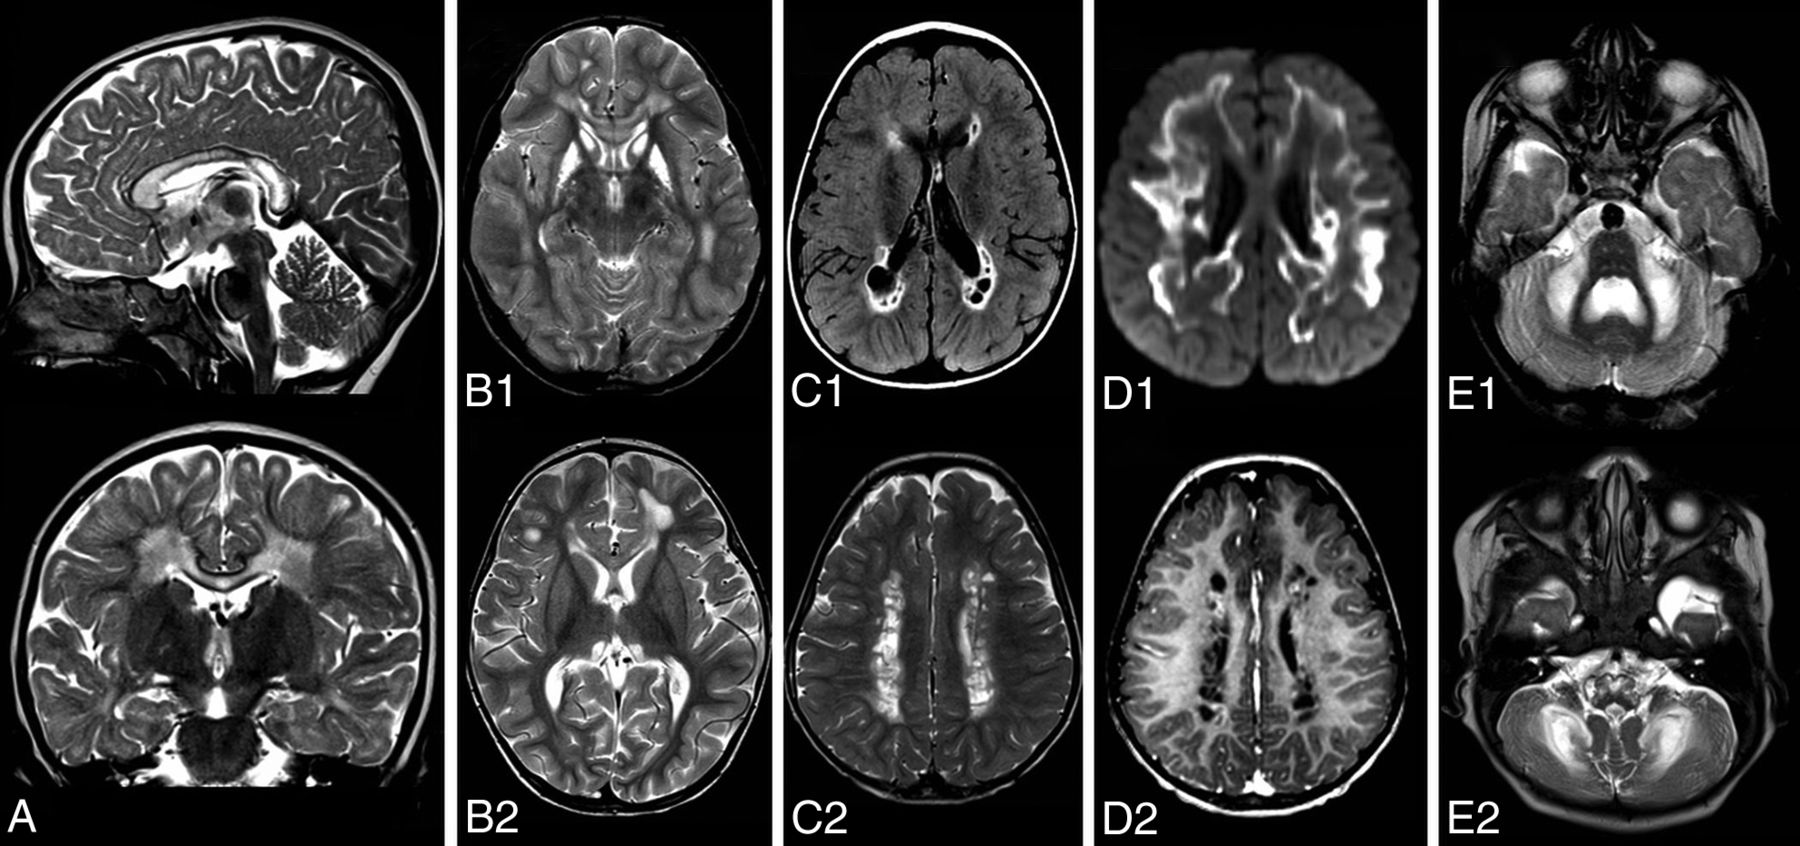
MR imaging features suggestive of mitochondrial leukodystrophy. A, Sagittal and coronal T2-weighted images of a patient with a complex 2 deficiency show longitudinal T2 hyperintensity affecting the middle blade of the corpus callosum while sparing the inner and outer blades. B, Axial T2-weigthed images of 2 patients. B1, Symmetric involvement of the striatum in a patient with NDUFV1 variants. B2, Symmetric hyperintensity in the thalami in a patient with NDUFAF5 variants. C1, FLAIR image of a patient with LYRM7 variants shows small cysts in the periventricular and deep cerebral white matter. C2, T2-weighted image shows the well-defined border of cysts in a different patient with LYRM7 variants. D1, Axial diffusion trace images show extensive diffusion restriction at the edge of the lesions in a patient with BOLA3 variants, D2, Postcontrast T1-weighted image shows subtle enhancement at the edge of cysts in the same patient as in C2. E1 and E2, Axial T2-weighted images. E1, Symmetric hyperintensity of the middle cerebellar peduncles and cerebellar white matter in a patient with ISCA2 variants. E2, Hyperintensity of the medulla oblongata, middle cerebellar peduncles, and cerebellar white matter in a patient with IBA57 variants.
Brain stem lesions were, in particular, common in succinate dehydrogenase (SDH) deficiency (19 of 22 patients) and KSS (all 6 patients). Symmetric T2 hyperintensity in the middle cerebellar peduncles was more commonly seen in SDH deficiency (14 of 22 patients) and KSS (5 of 6 patients), but also in patients with NDUFS1 variants (5 of 10 patients). Cystic lesions were most commonly observed in patients with APOPT1 variants (5 of 7 patients), patients with LYRM7 variants (6 of 10 patients), and also in patients with both COX6B and COX10 variants.
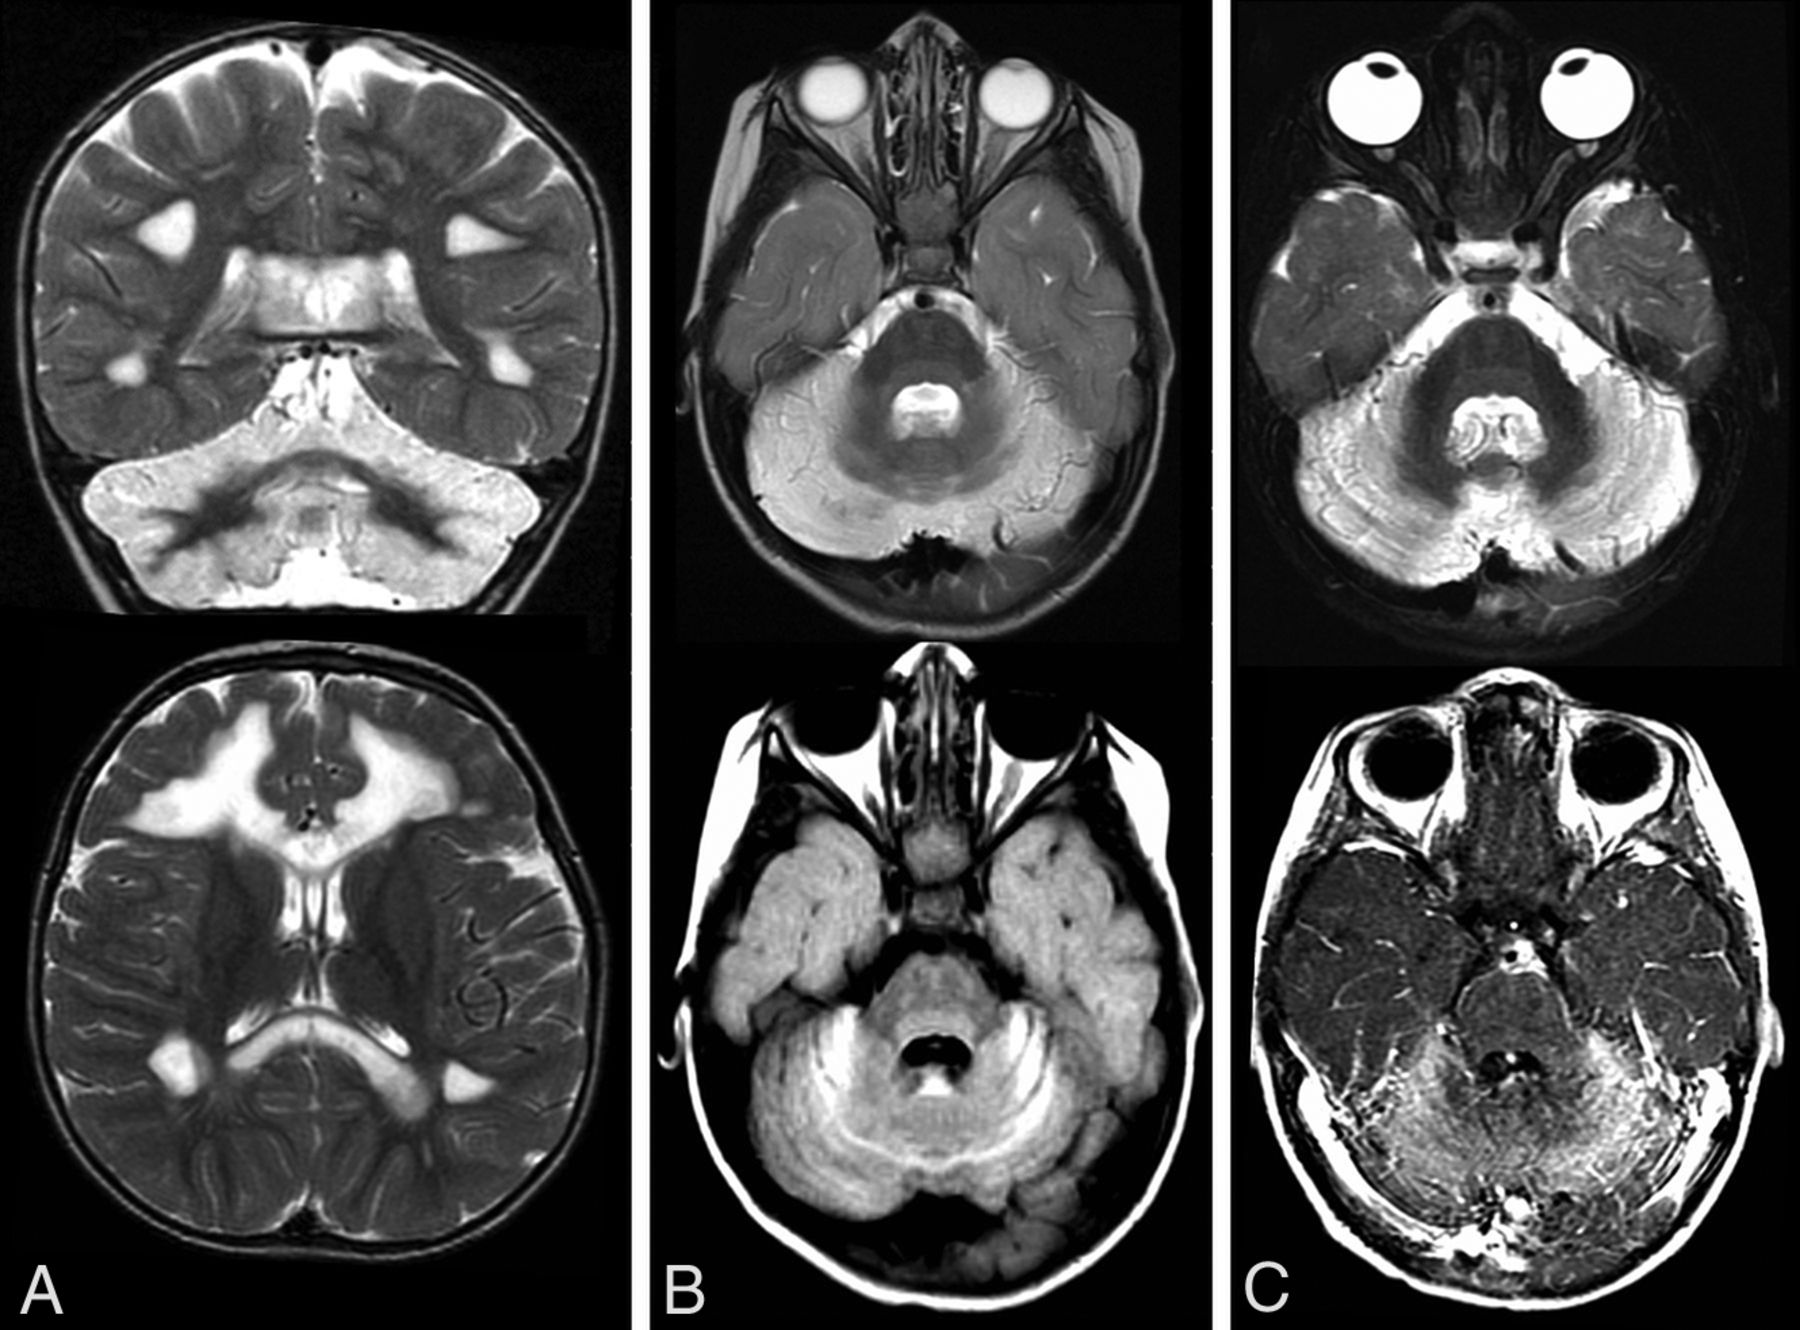
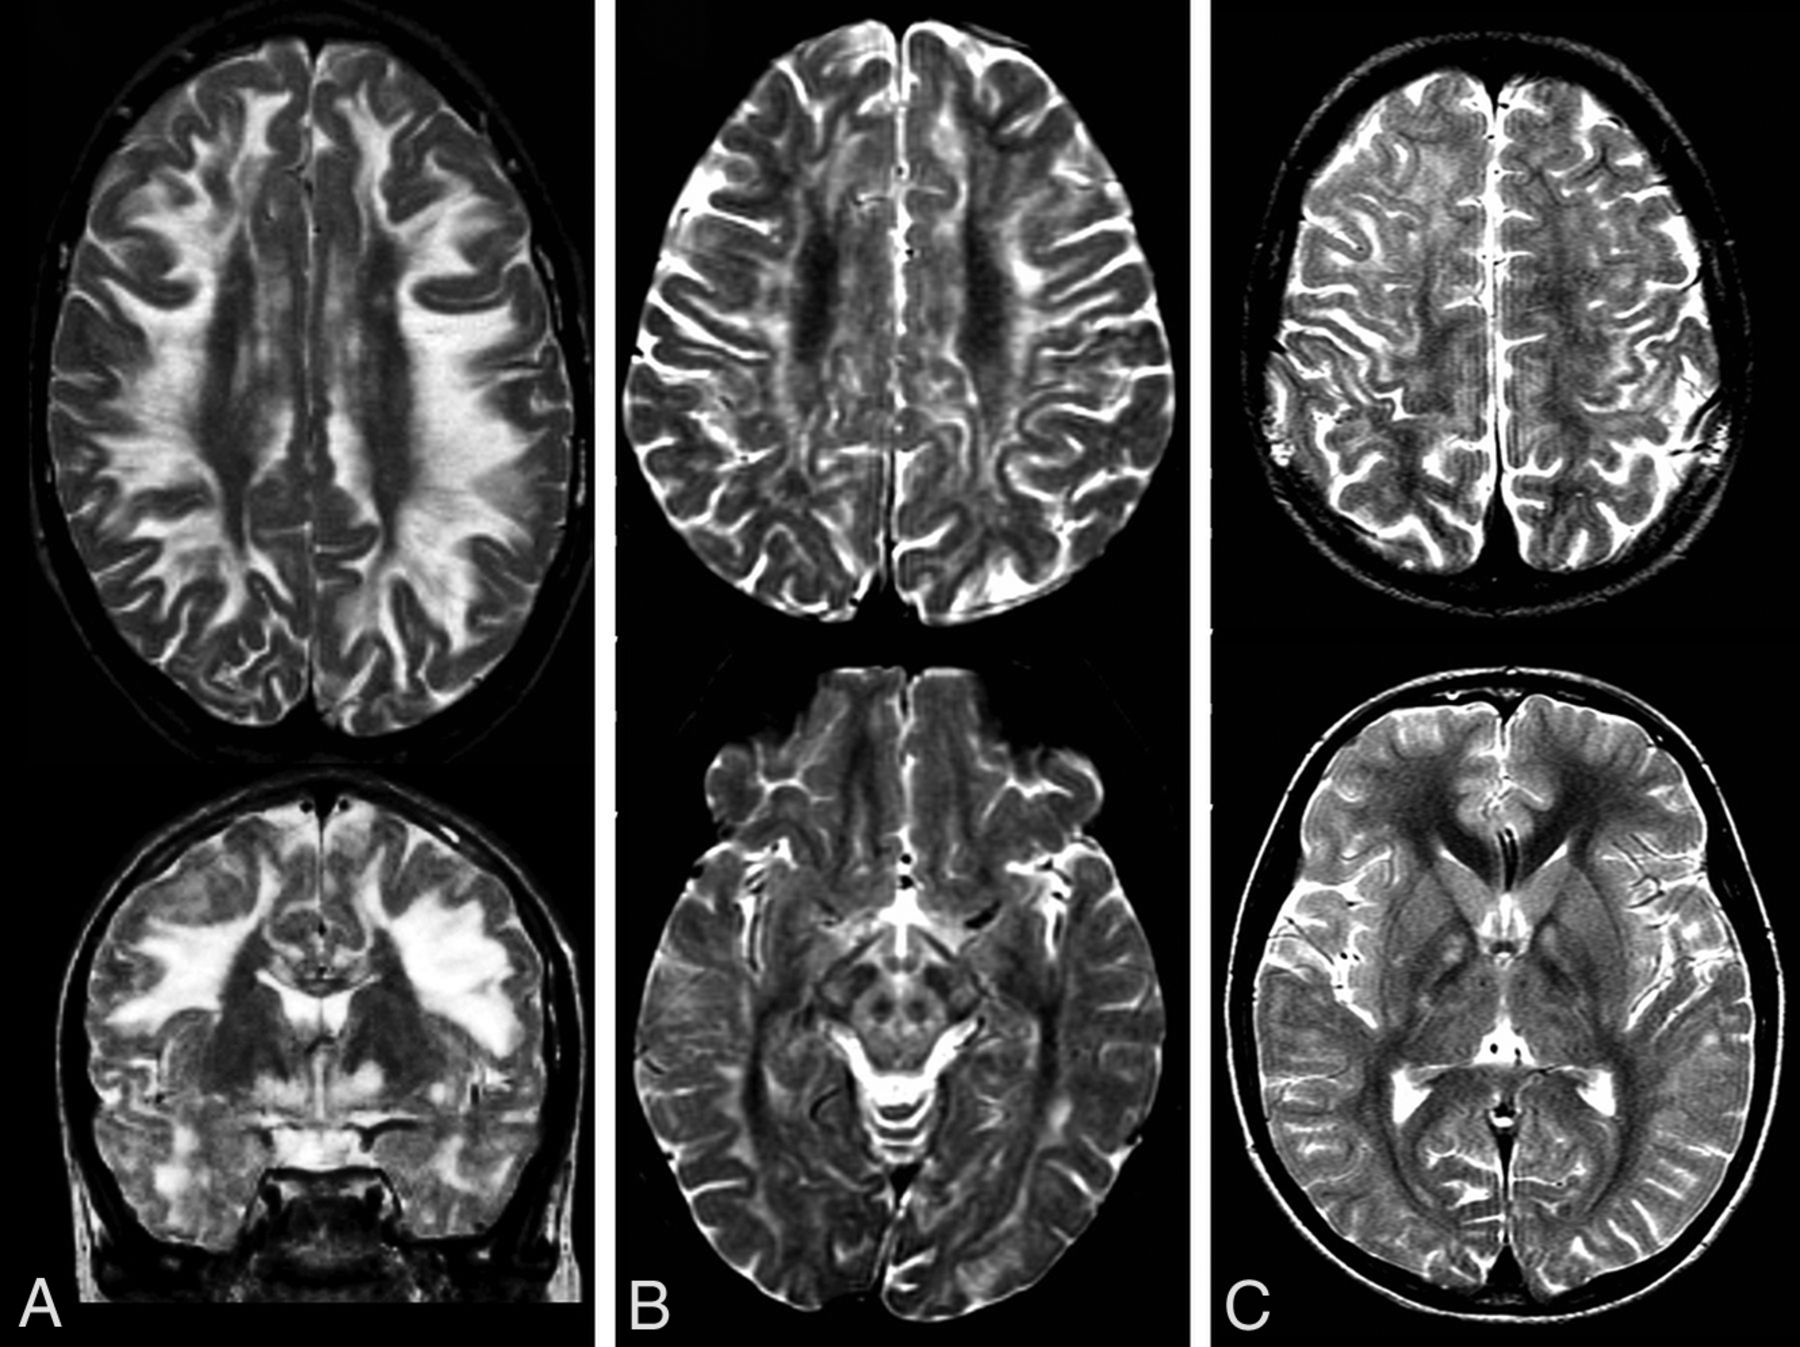
We investigated whether certain MR imaging abnormalities or combinations of abnormalities were specific for particular disorders or clusters of disorders. Complex 2 deficiency was characterized by T2 hyperintensity in the brain stem, more specifically in the transverse pontine fibers, and T2-hyperintense abnormality in the middle cerebellar peduncles and the thalami (Fig 2). Defects in complexes 3 and 4 were characterized by predominantly periventricular localization of T2 hyperintensities and well-defined cystic lesions with distinct borders (Fig 3). Patients with NUBPL variants had a unique combination of T2-hyperintense signal of the cerebellar cortex bilaterally and supratentorial white matter abnormalities (Fig 4). Patients with KSS had T2-hyperintense abnormalities predominantly affecting the directly subcortical cerebral white matter, in combination with T2-hyperintense abnormalities in the globus pallidus and substantia nigra (Fig 5).
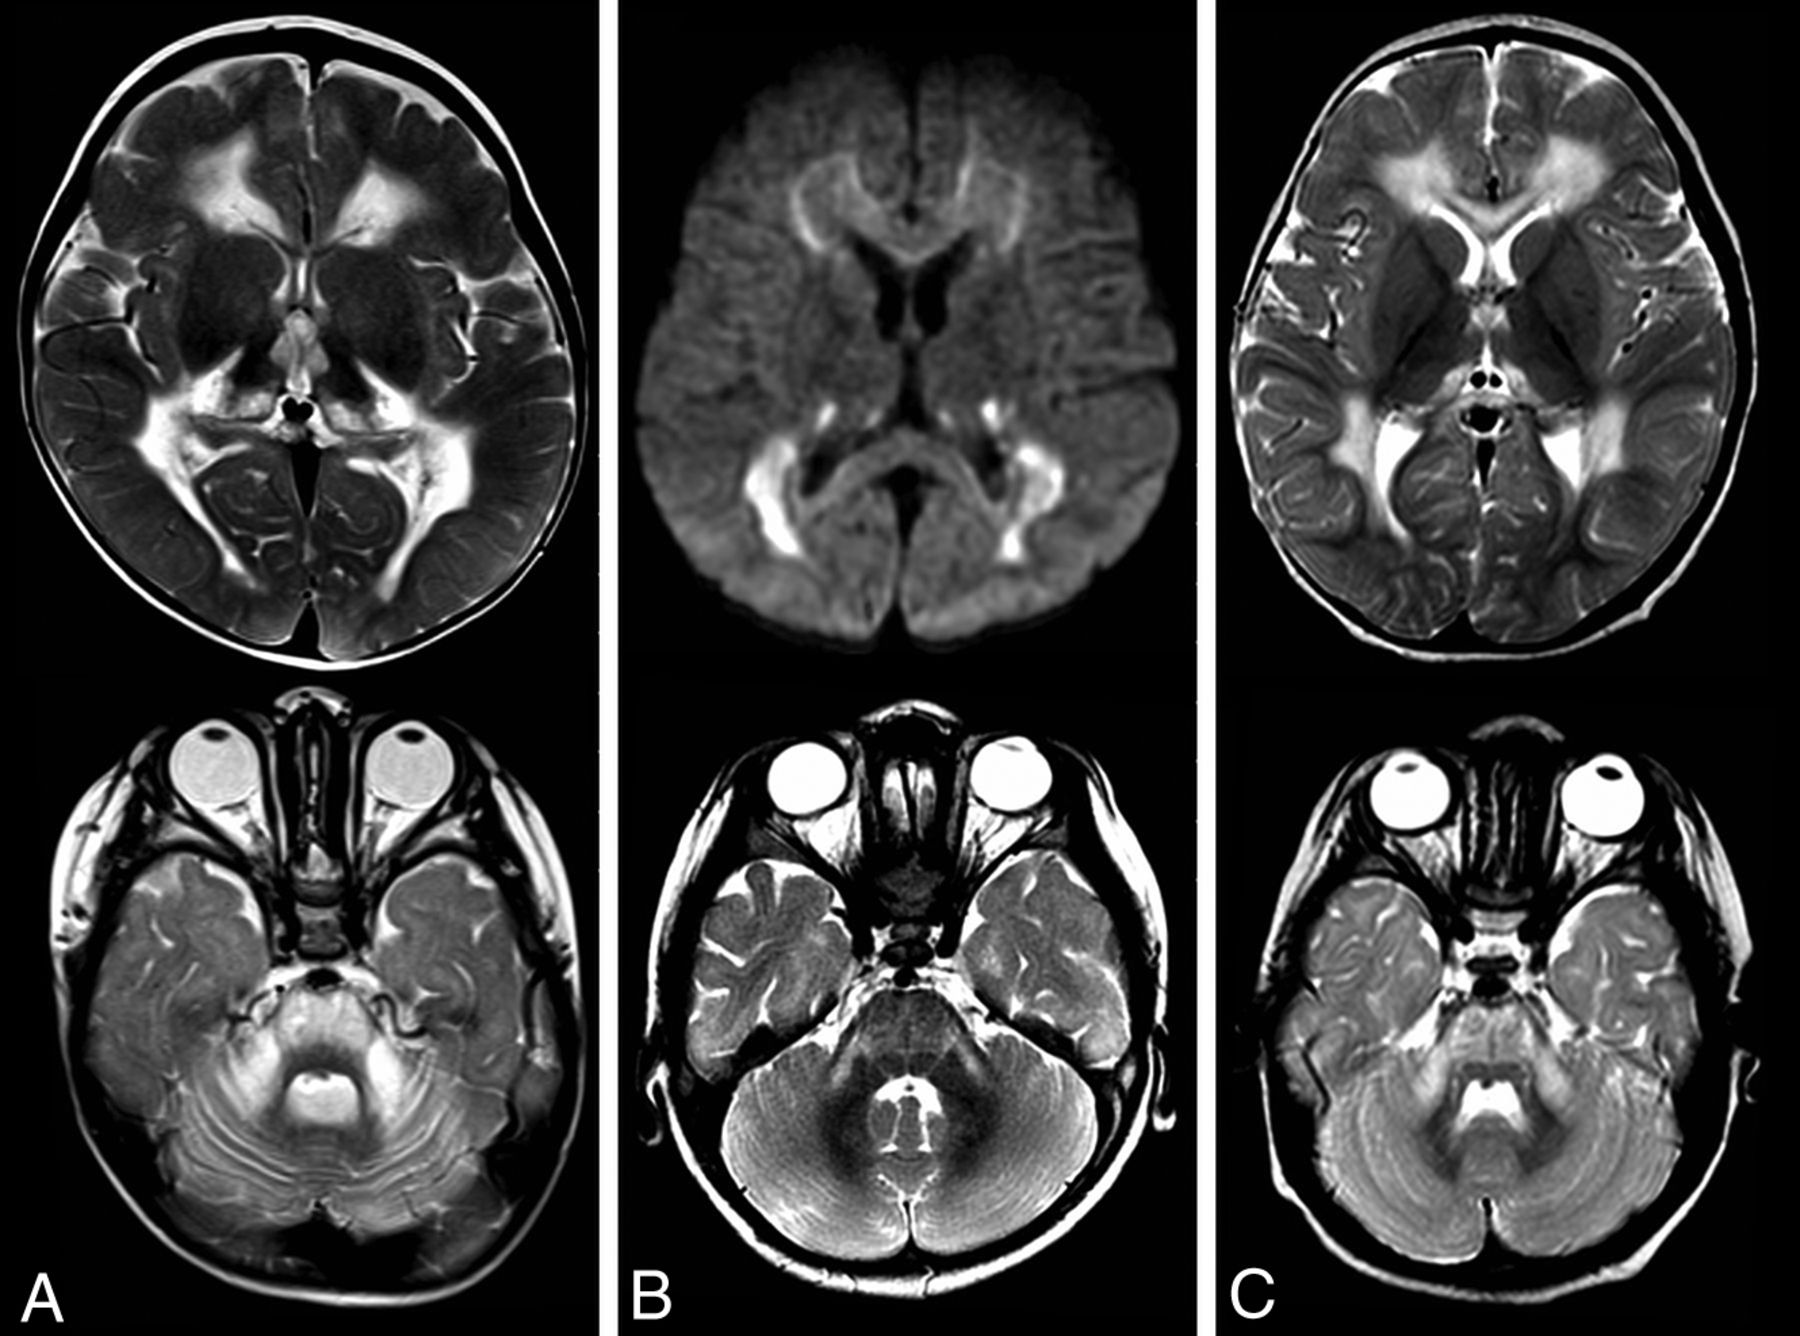
Features characteristic of SDH deficiency in 3 patients (A–C) showing symmetric thalamic involvement and pontine and middle cerebellar hyperintensities on T2-weighted images. B, Note the diffusion restriction.

Characteristic features of defects in complexes 3 (A) and 4 (B and C). Upper rows are T2-weighted images; lower rows show FLAIR images and a diffusion trace image. Predominantly periventricular T2 hyperintensities, well-defined cystic lesions with a distinct border. Diffusion restriction at the edge of the lesions.
Characteristic features of NUBPL variants shown in 3 patients (A–C). The T2-weighted images show hyperintensity of the cerebellum, which is also hyperintense on FLAIR (B) and enhances (C). Involvement of supratentorial white matter can be extensive (A).

T2-weighted images of 3 patients with KSS (A–C) showing hyperintensity affecting (predominantly the subcortical and also deep) white matter. A and C, In the lower panel, hyperintensities in the globus pallidus exist. B, Involvement of the substantia nigra and, in this case, larger areas of the midbrain are shown.
DISCUSSION
We investigated the MRIs of patients with leukodystrophies caused by a genetic defect affecting the mitochondrial respiratory chain function, except for mitochondrial transfer RNA synthetase defects. Several MR imaging features were relatively frequent among all patients and therefore suggestive of a possible mitochondrial cause when ob-served. Additionally, we found 4 MR imaging patterns specific for the following defects: 1) SDH deficiency, 2) LYRM7 or APOPT1 or COX10 or COX6B variants, 3) NUBPL variants, and 4) KSS.
MR Imaging Features Suggestive of a Mitochondrial Leukodystrophy
In the diagnostic work-up of patients with leukodystrophy, several MR imaging features suggest an underlying mitochondrial defect (Table 1 and illustrated in Fig 1).
MR imaging features suggestive of a mitochondrial leukodystrophy
We observed longitudinal T2 hyperintensity of the middle blade of the corpus callosum in most of our patients, with sparing of inner and outer blades. In metachromatic leukodystrophy, Krabbe disease, and adrenoleukodystrophy, all layers of the corpus callosum are typically affected,23 while in vanishing white matter, the inner blade is involved.24 Marchiafava-Bignami disease23 and Susac syndrome25 also selectively affect the middle blade of the corpus callosum, in Marchiafava-Bignami disease in a longitudinal fashion; but in Susac syndrome, the lesions are round and multifocal.25 Thus, longitudinal selective involvement of the middle layer should be regarded as a red flag for possible mitochondrial disease.
White matter rarefaction and cystic degeneration, most accurately visualized in FLAIR sequences, were common in our patients. The cysts were usually multifocal and well-delineated and mainly located in the periventricular and deep white matter and not in the subcortical regions. Diffusion restricton and contrast enhancement often specifically involved the rims of the cysts. By contrast, in Alexander disease, cysts are mainly located in the deep frontal white matter and may become quite large.23 In megalencephalic leukoencephalopathy with subcortical cysts, the cysts are located in the directly subcortical white matter.23 Seldom, patients with Canavan disease may exhibit multiple small cysts throughout the white matter.26 Bilateral anterior temporal lobe localization of the cysts, often seen in megalencephalic leukoencephalopathy with subcortical cysts, congenital cytomegalovirus infection, and Aicardi-Goutières syndrome,23 was not observed in our patient cohort, though this localization has been reported in a mitochondrial disorder caused by RMND1 variants.27 In vanishing white matter, the cerebral white matter rarefaction and cystic degeneration are diffuse and without well-defined rims.23,24 Therefore, the appearance and location of the white matter cysts are indicative of the type of leukodystrophy.
Symmetric deep gray matter involvement was common in our patients, the thalamus being most frequently involved. In Wilson disease, white matter abnormalities are uncommon but may be extensive in exceptional patients.28 In Alexander disease, signal changes and mild swelling, followed by atrophy, occur in the caudate nucleus and putamen.23 The globus pallidus and thalamus are commonly involved in Canavan disease with sparing of the putamen and caudate nucleus.23 Other defects in amino acid and organic acid metabolism may present with white and deep gray matter abnormalities,23 as well as in certain types of neurodegeneration with brain iron accumulation.29 Therefore, the combination of white matter abnormalities and changes in deep gray matter nuclei comes with a long differential diagnosis, of which mitochondrial defects should be part.
Brain stem abnormalities were seen in half of our patients, involving both brain stem tracts and the pontine nuclei. The brain stem abnormalities in leukoencephalopathy with brain stem and spinal cord involvement and high lactate are distinct, involving the pyramidal tracts, medial lemniscus, cerebellar connections, and intraparenchymal trigeminal nerves.15 In peroxisomal disorders, brain stem abnormalities commonly occur together with abnormal signal of the cerebellar and parieto-occipital or frontal white matter.23 In Wilson disease, abnormalities frequently diffusely affect the pontine tegmentum and midbrain tectum and tegmentum, creating the so-called “face of the giant panda.”30 Diffuse or multifocal en-hancing brain stem lesions occur in Alexander disease, particularly in the medulla and midbrain.23 In dentatorubral-pallidoluysian atrophy, T2 hyperintensity exists in the midbrain and pons and often also in the globus pallidus and thalamus.23 In adult patients, adult polyglucosan body disease and autosomal dominant leukodystrophy with autonomic disease may be considered.31,32
Symmetric T2 hyperintensity in the middle cerebellar peduncles was frequently seen in our patients, especially in SDH deficiency and KSS, and in those with NDUFS1 variants. It has also been described in Wilson disease and adrenoleukodystrophy.33 In adult patients with symmetric middle cerebellar peduncle involvement, autosomal dominant leukodystrophy with autonomic disease,32 fragile X-associated tremor/ataxia syndrome,23 and multiple system atrophy can be considered.33,34
Diagnostic MR Imaging Patterns
In some cases, the MR imaging pattern is specific for or strongly suggestive of a particular disorder or group of disorders and therefore quite helpful in the diagnosis (Table 2).
Diagnostic MR imaging patterns in mitochondrial leukodystrophies
We found that patients with SDH deficiency could be diagnosed by the following MR imaging features: T2 hyperintensity in the brain stem (more specifically the transverse pontine fibers), the middle cerebellar peduncles, and thalami, as reported previously.19 Obviously, a succinate peak in MR spectroscopy is specific for SDH deficiency,19 but spectroscopy is not always available.
The presence of numerous small cystic lesions with a well-defined border in the periventricular and deep cerebral white matter was associated with complex 3 or 4 defects. In line with this association, the MR imaging findings previously described in patients with LYRM7 variants14 are similar to those described in patients with APOPT1 variants.12 There are no previous descriptions of MR imaging abnormalities in patients with COX10 or COX6B variants.
The combination of FLAIR or T2 hyperintensity of the cerebellar cortex and cerebral white matter involvement is unique for NUBPL variants.11 Cerebellar cortical T2 hyperintensity has been infrequently reported in other mitochondrial diseases,35 but without cerebral white matter abnormalities. In several other diseases known for cerebellar cortical hyperintensity and volume loss,36 typically no leukoencephalopathy exists.
A pattern of T2-hyperintense abnormalities predominantly affecting the U-fibers, the globus pallidus, and the substantia nigra was associated with KSS. Calcifications in the globus pallidus and substantia nigra may be visible. Brain stem and symmetric middle cerebellar peduncle abnormalities were also frequently observed in patients with KSS. However, these 2 features did not survive our statistical analysis, probably due to the small number of patients with KSS and the presence of these abnormalities in patients with SDH deficiency.
Study Limitations
A limitation of our study is its retrospective nature. Most important, this limited the availability of important MR images, such as spectroscopy and contrast-enhanced images. Furthermore, a larger patient group would have increased the statistical power and may have led to the distinction of a higher number of specific MR imaging patterns. A strength of our study is that in all our patients, the causative gene defect was known. Still, it is difficult to estimate the generalizability of our results for new patients, though it is reassuring that similar, though limited, observations have been published before.11⇓⇓-14,19
CONCLUSIONS
In patients with leukodystrophy, MR imaging findings are very helpful in directing the diagnostic process. In some cases, the pattern of MR imaging abnormalities is diagnostic, facilitating rapid genetic confirmation. This finding is also true for some mitochondrial leukodystrophies. In many of our patients, the MR imaging pattern was not specific for a particular mitochondrial defect, also in these patients MR imaging abnormalities suggestive of mitochondrial disease were commonly present.
Acknowledgments
We thank the numerous colleagues who sent us MR imaging scans of their patients for review and provided us with the definitive diagnosis.
Footnotes
The following authors are members of the European Reference Network for Rare Neurological Disorders, project ID 739510: M.S. van der Knaap and N.I. Wolf.
Disclosures: Adeline Vanderver—UNRELATED: Board Membership: Biogen, Takeda Pharmaceutical Company, Homology Medicines, Orchard Therapeutics, European Leukodystrophy Association (ELA) Foundation, United Leukodystrophy Foundation (ULF), Yaya Foundation, Metachromatic Leukodystrophy (MLD) Foundation, Ionis Pharmaceuticals, Passage Bio*; Grants/Grants Pending: National Institutes of Health, Takeda Pharmaceutical Company, Homology Medicines, Eli Lilly, Biogen, Ionis Pharmaceuticals, Pelizaeus Merzbacher Disease (PMD) Foundation, Foundation to Fight to Hypomyelination with Atrophy of the Basal Ganglia (H-ABC)*; Patents (Planned, Pending or Issued): Aicardi-Goutieres Syndrome (AGS) scale, Hypomyelination with Atrophy of the Basal Ganglia (H-ABC) Therapeutics.* Nicole I. Wolf—UNRELATED: Consultancy: Shire/Takeda Pharmaceutical Company, Orchard Therapeutics, Ionis Pharmaceuticals, Passage Bio*; Grants/Grants Pending: ZonMW*; Travel/Accommodations/Meeting Expenses Unrelated to Activities Listed: European Society of Magnetic Resonance in Neuropediatrics. Marjo van der Knaap—UNRELATED: Grants/Grants Pending: ZonMw, European Leukodystrophy Association (ELA) Foundation, Hersenstichting, Vanishing White Matter Foundation, Chloe Saxby and Vanishing White Matter Disease Incorporated, and Vanishing White Matter Families Foundation Inc, Comments: ZonMw Top grant 91217006, European Leukodystrophy Foundation grant 2017-02712, European Leukodystrophy Foundation grant 2019-P001, Hersenstichting grant DR-2019-00285, Vanishing White Matter Foundation, Chloe Saxby and Vanishing White Matter Disease Incorporated, and Vanishing White Matter Families Foundation Inc; Patents (Planned, Pending or Issued): I have a patent, P112686CA00, on the therapeutic effects of Guanabenz treatment in vanishing white matter, pending to VU University Medical Center. *Money paid to the institution.
Indicates open access to non-subscribers at www.ajnr.org
References
- Received November 17, 2020.
- Accepted after revision January 14, 2021.
- © 2021 by American Journal of Neuroradiology


Jump to section
Related Articles
Cited By...
- Biallelic mutation of SUPV3L1 causes an inherited leukodystrophy-associated neurodevelopmental disorder due to aberrant mitochondrial double stranded RNA processing
- Teaching NeuroImage: IBA57 Mutation-Associated Infantile Cavitating Leukoencephalopathy
- Pattern Recognition in Mitochondrial Leukodystrophies is Hampered by the Peculiarities of Mitochondrial Genetics