Advertisement

Main menu

  • Home
  • Content
    • Current Issue
    • Accepted Manuscripts
    • Article Preview
    • Past Issue Archive
    • Video Articles
    • AJNR Case Collection
    • Case of the Week Archive
    • Case of the Month Archive
    • Classic Case Archive
  • Special Collections
    • AJNR Awards
    • ASNR Foundation Special Collection
    • Most Impactful AJNR Articles
    • Photon-Counting CT
    • Spinal CSF Leak Articles (Jan 2020-June 2024)
  • Multimedia
    • AJNR Podcasts
    • AJNR SCANtastic
    • Trainee Corner
    • MRI Safety Corner
    • Imaging Protocols
  • For Authors
    • Submit a Manuscript
    • Submit a Video Article
    • Submit an eLetter to the Editor/Response
    • Manuscript Submission Guidelines
    • Statistical Tips
    • Fast Publishing of Accepted Manuscripts
    • Graphical Abstract Preparation
    • Imaging Protocol Submission
    • Author Policies
  • About Us
    • About AJNR
    • Editorial Board
    • Editorial Board Alumni
  • More
    • Become a Reviewer/Academy of Reviewers
    • Subscribers
    • Permissions
    • Alerts
    • Feedback
    • Advertisers
    • ASNR Home

User menu

  • Alerts
  • Log in

Search

  • Advanced search
American Journal of Neuroradiology

American Journal of Neuroradiology

ASHNR American Society of Functional Neuroradiology ASHNR American Society of Pediatric Neuroradiology ASSR
  • Alerts
  • Log in

Advanced Search

  • Home
  • Content
    • Current Issue
    • Accepted Manuscripts
    • Article Preview
    • Past Issue Archive
    • Video Articles
    • AJNR Case Collection
    • Case of the Week Archive
    • Case of the Month Archive
    • Classic Case Archive
  • Special Collections
    • AJNR Awards
    • ASNR Foundation Special Collection
    • Most Impactful AJNR Articles
    • Photon-Counting CT
    • Spinal CSF Leak Articles (Jan 2020-June 2024)
  • Multimedia
    • AJNR Podcasts
    • AJNR SCANtastic
    • Trainee Corner
    • MRI Safety Corner
    • Imaging Protocols
  • For Authors
    • Submit a Manuscript
    • Submit a Video Article
    • Submit an eLetter to the Editor/Response
    • Manuscript Submission Guidelines
    • Statistical Tips
    • Fast Publishing of Accepted Manuscripts
    • Graphical Abstract Preparation
    • Imaging Protocol Submission
    • Author Policies
  • About Us
    • About AJNR
    • Editorial Board
    • Editorial Board Alumni
  • More
    • Become a Reviewer/Academy of Reviewers
    • Subscribers
    • Permissions
    • Alerts
    • Feedback
    • Advertisers
    • ASNR Home
  • Follow AJNR on Twitter
  • Visit AJNR on Facebook
  • Follow AJNR on Instagram
  • Join AJNR on LinkedIn
  • RSS Feeds

AJNR is seeking candidates for the AJNR Podcast Editor. Read the position description.

Research ArticlePEDIATRICS
Open Access

Differentiation of Speech Delay and Global Developmental Delay in Children Using DTI Tractography-Based Connectome

J.-W. Jeong, S. Sundaram, M.E. Behen and H.T. Chugani
American Journal of Neuroradiology June 2016, 37 (6) 1170-1177; DOI: https://doi.org/10.3174/ajnr.A4662
J.-W. Jeong
aFrom the Carman and Ann Adams Departments of Pediatrics (J.-W.J., S.S., M.E.B., H.T.C.)
bNeurology (J.-W.J., S.S., M.E.B., H.T.C.), Wayne State University School of Medicine, Detroit, Michigan
cTranslational Imaging Laboratory (J.-W.J., S.S., M.E.B., H.T.C.), Children's Hospital of Michigan, Detroit, Michigan.
  • Find this author on Google Scholar
  • Find this author on PubMed
  • Search for this author on this site
  • ORCID record for J.-W. Jeong
S. Sundaram
aFrom the Carman and Ann Adams Departments of Pediatrics (J.-W.J., S.S., M.E.B., H.T.C.)
bNeurology (J.-W.J., S.S., M.E.B., H.T.C.), Wayne State University School of Medicine, Detroit, Michigan
cTranslational Imaging Laboratory (J.-W.J., S.S., M.E.B., H.T.C.), Children's Hospital of Michigan, Detroit, Michigan.
  • Find this author on Google Scholar
  • Find this author on PubMed
  • Search for this author on this site
  • ORCID record for S. Sundaram
M.E. Behen
aFrom the Carman and Ann Adams Departments of Pediatrics (J.-W.J., S.S., M.E.B., H.T.C.)
bNeurology (J.-W.J., S.S., M.E.B., H.T.C.), Wayne State University School of Medicine, Detroit, Michigan
cTranslational Imaging Laboratory (J.-W.J., S.S., M.E.B., H.T.C.), Children's Hospital of Michigan, Detroit, Michigan.
  • Find this author on Google Scholar
  • Find this author on PubMed
  • Search for this author on this site
  • ORCID record for M.E. Behen
H.T. Chugani
aFrom the Carman and Ann Adams Departments of Pediatrics (J.-W.J., S.S., M.E.B., H.T.C.)
bNeurology (J.-W.J., S.S., M.E.B., H.T.C.), Wayne State University School of Medicine, Detroit, Michigan
cTranslational Imaging Laboratory (J.-W.J., S.S., M.E.B., H.T.C.), Children's Hospital of Michigan, Detroit, Michigan.
  • Find this author on Google Scholar
  • Find this author on PubMed
  • Search for this author on this site
  • ORCID record for H.T. Chugani
  • Article
  • Figures & Data
  • Info & Metrics
  • Responses
  • References
  • PDF
Loading

Article Figures & Data

Figures

  • Tables
  • Fig 1.
    • Download figure
    • Open in new tab
    • Download powerpoint
    Fig 1.

    ROIs showing significantly altered network metrics in the group comparison of TD > GD. In the 2D connectogram, the color of anatomic label scales the P value of group difference in the AAL template. Similarly, the color of each circle represents the P value of individual metrics. The 3D connectogram shows individual pair-wise pathways having significant group differences in nodal strength (ie, the greater radius of the sphere, the greater the group difference). In both 2D and 3D connectograms, block arrows indicate the hippocampal network whose nodal properties are significantly reduced in GD compared with TD.

  • Fig 2.
    • Download figure
    • Open in new tab
    • Download powerpoint
    Fig 2.

    ROIs showing significantly altered network metrics in the group comparison of TD > SD. In the 2D connectogram, the color of anatomic label scales the P value of group difference in the AAL template. Similarly, the color of each circle represents the P value of individual metrics. The 3D connectogram shows individual pair-wise pathways having significant group differences in nodal strength (ie, the greater the radius of the sphere, the greater the group difference). In both 2D and 3D connectograms, block arrows indicate the frontotemporal language network in which nodal properties are significantly reduced in SD compared with TD.
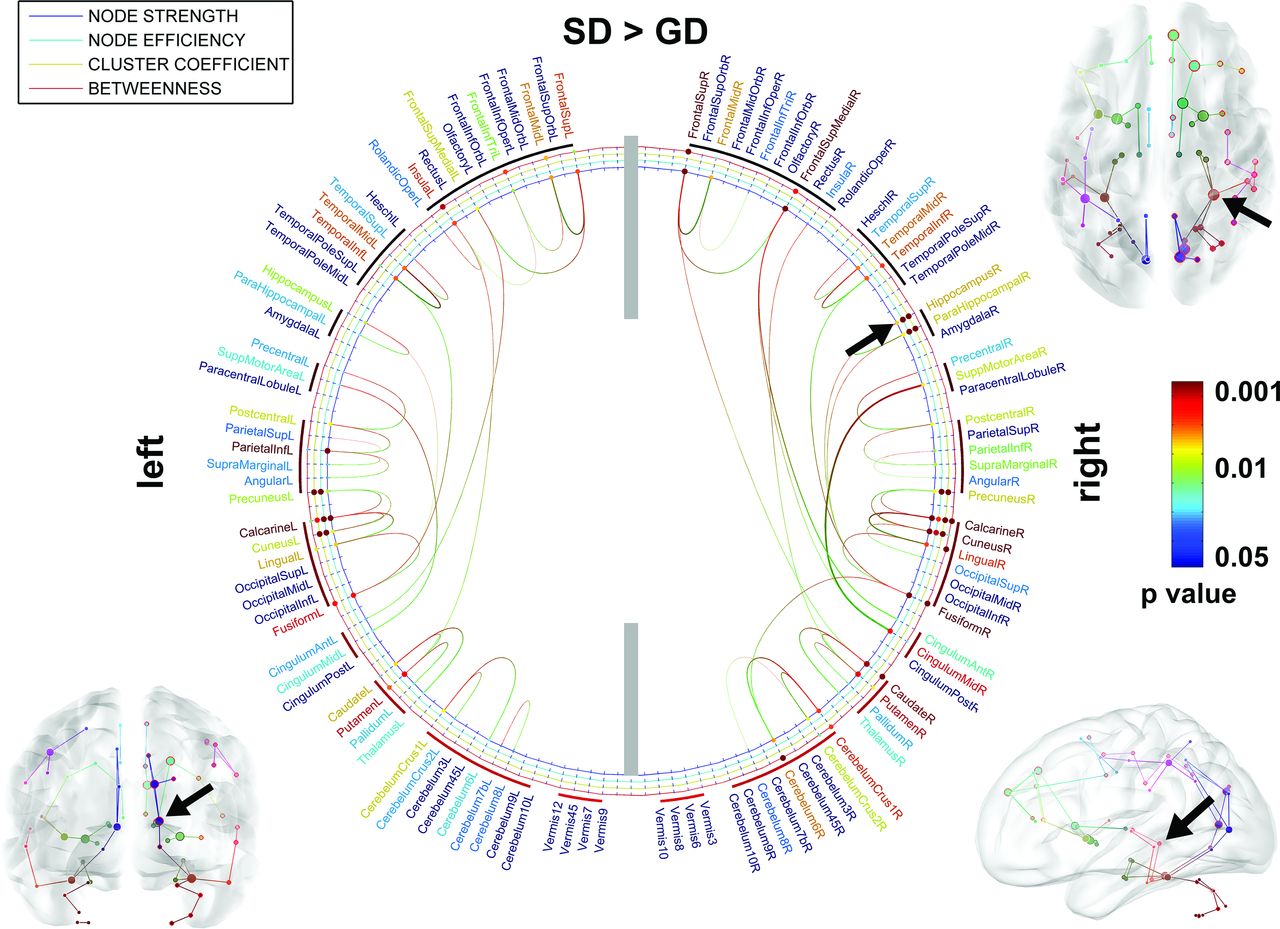
  • Fig 3.
    • Download figure
    • Open in new tab
    • Download powerpoint
    Fig 3.

    ROIs showing significantly altered network metrics in the group comparison of SD > GD. In the 2D connectogram, the color of anatomic label scales the P value of the group difference in the AAL template. Similarly, the color of each circle represents the P value of individual metrics. The 3D connectogram shows individual pair-wise pathways having significant group differences in nodal strength (ie, the greater the radius of the sphere, the greater the group difference). In both 2D and 3D connectograms, block arrows indicate the right hippocampus whose nodal properties are significantly reduced in GD compared with SD.
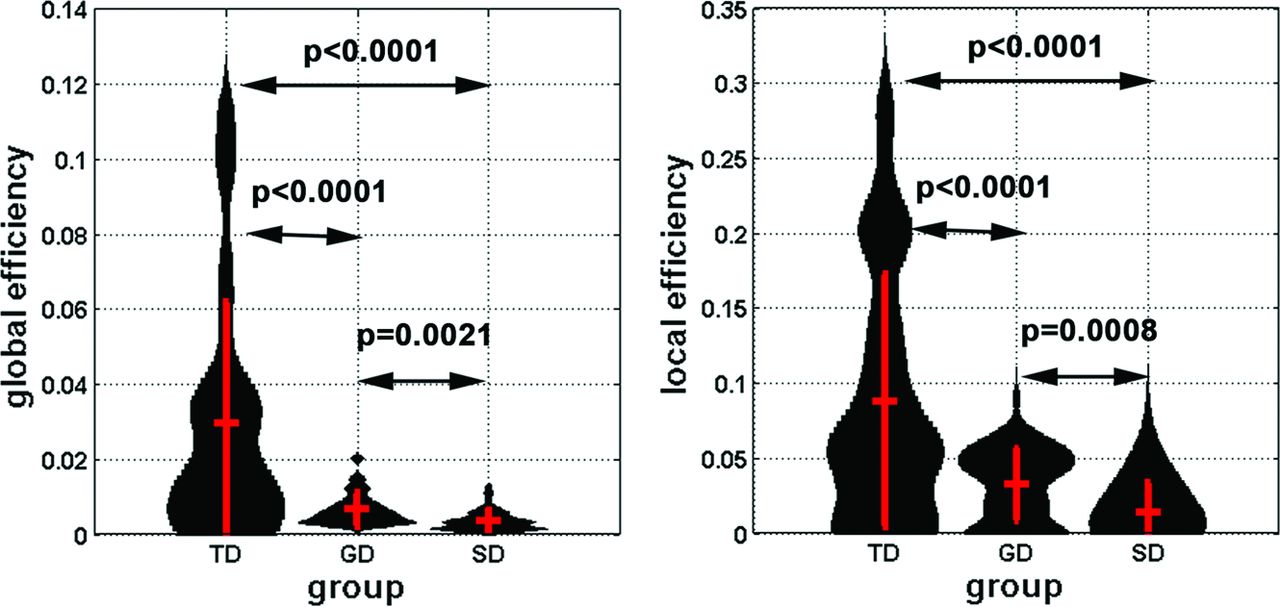
  • Fig 4.
    • Download figure
    • Open in new tab
    • Download powerpoint
    Fig 4.

    Global and local efficiency of the whole-brain network was obtained from individual subjects and is presented in the violin plots. Group mean and 1 SD are represented by red vertical lines. The black curve of each violin indicates the probabilistic attenuation function of the measure. To avoid the effect of arbitrary thresholding, we calculated the values of efficiencies at 3 discrete thresholds (5, 7, 10) of pair-wise connectivity scores of individual subjects to minimize the potential confounding across subjects.

  • Fig 5.
    • Download figure
    • Open in new tab
    • Download powerpoint
    Fig 5.

    Violin plots show the probability attenuation functions of nodal strengths (black) measured from bilateral hippocampus (left), left frontal language region (mid-/superior frontal gyrus/insular, middle), and left temporal language region (superior temporal gyrus, right) of each group. To estimate the probability attenuation function of individual groups, we calculated the values of nodal strength by applying 3 discrete thresholds (5, 7, 10) to the single connectivity matrix. Vertical red lines show mean ± 1 SD of each function.

Tables

  • Figures
  • Results of differentiation between GD and SD groups using SVM with nodal strengtha

    NetworkAccuracySensitivitySpecificityP Value
    Hippocampal89 (4)96 (5)74 (15).02
    Frontal language83 (4)93 (6)71 (16).04
    Temporal language88 (5)94 (5)77 (14).02
    • Note:—SVM indicates support vector machine.

    • ↵a The mean (SD) of accuracy, sensitivity, and specificity were reported in percentages. The P value indicates the probability of the permutation in that the accuracy of the permuted label is higher than the one obtained for the real label.

PreviousNext
Back to top

In this issue

American Journal of Neuroradiology: 37 (6)
American Journal of Neuroradiology
Vol. 37, Issue 6
1 Jun 2016
  • Table of Contents
  • Index by author
  • Complete Issue (PDF)
Advertisement
Print
Download PDF
Email Article

Thank you for your interest in spreading the word on American Journal of Neuroradiology.

NOTE: We only request your email address so that the person you are recommending the page to knows that you wanted them to see it, and that it is not junk mail. We do not capture any email address.

Enter multiple addresses on separate lines or separate them with commas.
Differentiation of Speech Delay and Global Developmental Delay in Children Using DTI Tractography-Based Connectome
(Your Name) has sent you a message from American Journal of Neuroradiology
(Your Name) thought you would like to see the American Journal of Neuroradiology web site.
CAPTCHA
This question is for testing whether or not you are a human visitor and to prevent automated spam submissions.
Cite this article
J.-W. Jeong, S. Sundaram, M.E. Behen, H.T. Chugani
Differentiation of Speech Delay and Global Developmental Delay in Children Using DTI Tractography-Based Connectome
American Journal of Neuroradiology Jun 2016, 37 (6) 1170-1177; DOI: 10.3174/ajnr.A4662

Citation Manager Formats

  • BibTeX
  • Bookends
  • EasyBib
  • EndNote (tagged)
  • EndNote 8 (xml)
  • Medlars
  • Mendeley
  • Papers
  • RefWorks Tagged
  • Ref Manager
  • RIS
  • Zotero
0 Responses
Respond to this article
Share
Bookmark this article
Differentiation of Speech Delay and Global Developmental Delay in Children Using DTI Tractography-Based Connectome
J.-W. Jeong, S. Sundaram, M.E. Behen, H.T. Chugani
American Journal of Neuroradiology Jun 2016, 37 (6) 1170-1177; DOI: 10.3174/ajnr.A4662
del.icio.us logo Twitter logo Facebook logo Mendeley logo
  • Tweet Widget
  • Facebook Like
  • Google Plus One
Purchase

Jump to section

  • Article
    • Abstract
    • ABBREVIATIONS:
    • Materials and Methods
    • Results
    • Discussion
    • Conclusions
    • Footnotes
    • References
  • Figures & Data
  • Info & Metrics
  • Responses
  • References
  • PDF

Related Articles

  • No related articles found.
  • PubMed
  • Google Scholar

Cited By...

  • No citing articles found.
  • Crossref (14)
  • Google Scholar

This article has been cited by the following articles in journals that are participating in Crossref Cited-by Linking.

  • Machine-Learning-Aided Self-Powered Assistive Physical Therapy Devices
    Xiao Xiao, Yunsheng Fang, Xiao Xiao, Jing Xu, Jun Chen
    ACS Nano 2021 15 12
  • Deep Relational Reasoning for the Prediction of Language Impairment and Postoperative Seizure Outcome Using Preoperative DWI Connectome Data of Children With Focal Epilepsy
    Soumyanil Banerjee, Ming Dong, Min-Hee Lee, Nolan O'Hara, Csaba Juhasz, Eishi Asano, Jeong-Won Jeong
    IEEE Transactions on Medical Imaging 2021 40 3
  • Altered efficiency of white matter connections for language function in children with language disorder
    Min-Hee Lee, Nolan B. O'Hara, Michael E. Behen, Jeong-Won Jeong
    Brain and Language 2020 203
  • Prediction of baseline expressive and receptive language function in children with focal epilepsy using diffusion tractography-based deep learning network
    Jeong-Won Jeong, Min-Hee Lee, Nolan O'Hara, Csaba Juhász, Eishi Asano
    Epilepsy & Behavior 2021 117
  • Neonatal encephalopathy prediction of poor outcome with diffusion-weighted imaging connectome and fixel-based analysis
    Jeong-Won Jeong, Min-Hee Lee, Nithi Fernandes, Saihaj Deol, Swati Mody, Suzan Arslanturk, Ratna B. Chinnam, Sidhartha Tan
    Pediatric Research 2022 91 6
  • Brain development in children with developmental delay using amide proton transfer‐weighted imaging and magnetization transfer imaging
    Xiaolu Tang, Hong Zhang, Jinyuan Zhou, Huiying Kang, Shuangfeng Yang, Haijing Cui, Yun Peng
    Pediatric Investigation 2020 4 4
  • Aberrant Structural and Functional Developmental Trajectories in Children With Intellectual Disability
    Xuejin Ma, Jianxia Tan, Lin Jiang, Xuqin Wang, Bochao Cheng, Peng Xie, Yuanyuan Li, Jiaojian Wang, Shiguang Li
    Frontiers in Psychiatry 2021 12
  • Relationship between genotype and arcuate fasciculus morphology in six young children with global developmental delay: Preliminary DTI stuy
    Jeong-Won Jeong, Senthil Sundaram, Michael E. Behen, Harry T. Chugani
    Journal of Magnetic Resonance Imaging 2016 44 6
  • Brain Magnetic Resonance Imaging-Based Evaluation of Pediatric Patients With Developmental Delay: A Cross-Sectional Study
    Harneet S Randhawa, Sachin Bagale, Rajesh Umap, Jasneet Randhawa
    Cureus 2022
  • Deep reasoning neural network analysis to predict language deficits from psychometry‐driven DWI connectome of young children with persistent language concerns
    Jeong‐Won Jeong, Soumyanil Banerjee, Min‐Hee Lee, Nolan O'Hara, Michael Behen, Csaba Juhász, Ming Dong
    Human Brain Mapping 2021 42 10

More in this TOC Section

  • SyMRI & MR Fingerprinting in Brainstem Myelination
  • Comparison of Image Quality and Radiation Dose in Pediatric Temporal Bone CT Using Photon-Counting Detector CT and Energy-Integrating Detector CT
  • Dandy-Walker Phenotype with Brainstem Involvement
Show more Pediatrics

Similar Articles

Advertisement

Indexed Content

  • Current Issue
  • Accepted Manuscripts
  • Article Preview
  • Past Issues
  • Editorials
  • Editor's Choice
  • Fellows' Journal Club
  • Letters to the Editor
  • Video Articles

Cases

  • Case Collection
  • Archive - Case of the Week
  • Archive - Case of the Month
  • Archive - Classic Case

Special Collections

  • AJNR Awards
  • ASNR Foundation Special Collection
  • Most Impactful AJNR Articles
  • Photon-Counting CT
  • Spinal CSF Leak Articles (Jan 2020-June 2024)

More from AJNR

  • Trainee Corner
  • Imaging Protocols
  • MRI Safety Corner

Multimedia

  • AJNR Podcasts
  • AJNR Scantastics

Resources

  • Turnaround Time
  • Submit a Manuscript
  • Submit a Video Article
  • Submit an eLetter to the Editor/Response
  • Manuscript Submission Guidelines
  • Statistical Tips
  • Fast Publishing of Accepted Manuscripts
  • Graphical Abstract Preparation
  • Imaging Protocol Submission
  • Evidence-Based Medicine Level Guide
  • Publishing Checklists
  • Author Policies
  • Become a Reviewer/Academy of Reviewers
  • News and Updates

About Us

  • About AJNR
  • Editorial Board
  • Editorial Board Alumni
  • Alerts
  • Permissions
  • Not an AJNR Subscriber? Join Now
  • Advertise with Us
  • Librarian Resources
  • Feedback
  • Terms and Conditions
  • AJNR Editorial Board Alumni

American Society of Neuroradiology

  • Not an ASNR Member? Join Now

© 2025 by the American Society of Neuroradiology All rights, including for text and data mining, AI training, and similar technologies, are reserved.
Print ISSN: 0195-6108 Online ISSN: 1936-959X

Powered by HighWire