
Abstract
Summary: Diffusion-weighted MR imaging was used to delineate the corticospinal tract (CST) successfully and to depict its relationship to adjacent brain tumors. The CST was defined by a method by which it seems possible to delimit the distance from the CST to the main tumor mass and to show displacement and infiltration of the tract by the neoplasia. This information cannot be gathered from routine anatomic MR imaging.
The goal of brain tumor surgery is to maximize tumor resection while preserving vital brain function (1–3). Methods for intraoperative identification of eloquent cortices leading to safe resection of adjacent brain tumors have been shown to be successful (1, 2, 4, 5). The question of brain surgery in the vicinity of important white matter tracts remains problematic. Transection of these tracts can lead to devastating neurologic deficits. A number of recent reports have described the ability of diffusion-weighted imaging to depict the major white matter tracts accurately in animals (6) and in healthy human volunteers (7, 8). Our purpose was to use diffusion-weighted MR imaging to identify and study the corticospinal tract (CST) in patients with brain tumors.
Description of Technique and Results
Eight studies were performed on seven patients. There were four female and three male patients ranging in age from 11 to 67 years. All patients were surgically treated except for one. Of the histologically confirmed cases, there were two gliomas (grade III/IV), one glioblastoma multiforme, one ependymoma, and two meningiomas. All the tumors were located near the expected location of the CST. One patient was studied and operated on twice, 3 months apart. In this 64-year-old woman, the tumor (a glioblastoma multiforme) increased in volume fourfold between the two studies, thereby significantly altering the radiologic presentation. The markedly different radiologic presentation prompted her to be included twice.
All patients underwent imaging 1 day before surgery. A routine anatomic MR imaging sequence included axial T1-weighted 500/14/1 (TR/TE/excitations), balanced (2500/30/1), and T2-weighted (2500/85/1) images. The imaging was performed on a 1.5-T magnet with the following parameters: matrix size, 256 × 256; field of view, 230 mm; section thickness, 5 mm; intersection gap, 1 mm.
Functional MR imaging was performed to define the location of motor cortex in relation to the lesion and to register it to a surgical navigation system for real-time intraoperative localization as described by Maldjian et al (1) and Schulder et al (2). The patient performed a finger-tapping paradigm to identify the motor cortex. This consisted of alternating periods of 30 s of rest and 30 s of self-paced finger tapping, for a total of three periods of rest and two periods of activation. The functional data were acquired using the blood-oxygen-level–dependent (BOLD) technique: gradient-echo echo-planar images (2000/60/1); number of sections, 14; matrix, 64 × 64; field of view, 230 mm; section thickness, 5 mm; no section gap.
The diffusion-weighted images were acquired using spin-echo echo-planar imaging with the following parameters: 10,000/100/1; matrix, 128 × 128; field of view, 24 cm; section thickness, 5 mm; no gap. They were acquired in the exact same plane as were the BOLD functional MR images. A diffusion gradient duration of δ = 25 ms and a diffusion gradient interval of Δ = 62 ms were used. The data were collected by automatically stepping the gradient strengths from 0 to 2.0 G/cm in increments of 0.5 G/cm along each axis. This corresponds to b values of 0, 31.2, 124.6, 280.4, and 498.5 s/mm2. Next, a contrast-enhanced (gadolinium diethylenetriamine penta-acetic acid, 0.1 mmol/kg) T1-weghted image was obtained with the following parameters: 500/14/1; matrix, 256 × 256; field of view, 230 mm; section thickness, 3 mm; no gap.
The raw functional MR imaging data were analyzed off line using a SPARC 60 workstation and software written in IDL, as described previously (1, 2). Functional MR imaging maps were generated using a cross-correlation technique (1, 2) for P < .03. The functional MR imaging data were coregistered to the high-resolution contrast-enhanced image (1, 2).
The diffusion tensor was calculated for every voxel, as described previously (9–11), using a SPARC 60 workstation and software written in IDL. For each voxel, three eigenvalues (λ1, λ2, λ3) were derived from the diffusion tensor (8, 10). The eigenvector corresponding to the largest eigenvalue, termed the principal eigenvector, defined the main direction of diffusion of water molecules. In a voxel in which the axons run predominantly in one direction, the diffusion of water molecules defines the primary direction of the white matter tracts.
The fractional anisotropy (FA) was calculated from the eigenvalues as described by Basser and Pierpaoli (10). The FA was assigned values between 0 and 1. The FA represents how strongly water diffuses in the direction of the principal eigenvector. For example, if the diffusion of water molecules is much greater in one direction than in the others, such as in the corpus callosum, the FA will approach 1. If the diffusion of water molecules is only slightly greater in one direction than in the others, the FA will approach 0.
The path of the CST was determined using a two-step method. First, voxel connectivity tracing was performed using a modified version of the focused appendix computed tomography algorithm (6) from both a selected area in the precentral gyrus and the posterior limb of the internal capsule. Next, the two tracings were mathematically overlapped and only those voxels that were included in both tracings were considered to be part of the CST.
Specifically, for every patient, multiple regions of interest were drawn to define different areas of the precentral gyrus, including those areas known to control the movement of the leg, hand, and face separately as well as the entire motor cortex. These were designated as the starting areas. The area of the precentral gyrus responsible for movement of the hand was determined from the BOLD functional MR imaging data. BOLD functional MR imaging studies were not performed separately to define the areas of activation for the leg, face, and tongue. Their locations were estimated on the precentral gyrus according to the known distribution of the motor homunculus on the precentral gyrus and previously obtained functional MR imaging data (12). Because the anisotropy in the gray matter is limited and does not lead to optimal determination of directionality, the region of interest drawn for each area in the precentral gyrus was confined to the white matter directly subjacent to the area of activation, as determined by BOLD functional MR imaging. Care was also taken to exclude areas activated on the BOLD functional MR image in the postcentral gyrus and other areas outside of the precentral gyrus. The entire posterior limb of the internal capsule was designated as the ending area.
A trace was initiated from the center of each selected voxel and allowed to propagate in both anterograde and retrograde directions in 0.25-mm increments. The direction of movement was changed once the trace entered each new voxel, as reported by Mori et al (6). Each trace propagated until it left the diffusion image space or until the FA of the voxel dropped below a specified value (typically FA = 0.25), indicating that the directionality of the vector had become unreliable.
Once tracing was complete, each of the traces initiated from a starting voxel was compared with each of the traces initiated from an ending voxel. Only those traces that passed through common start and end points were displayed and were considered to be part of the CST. The resultant trace images of the CST were coregistered to axial T1-weighted images, which were obtained in the same sitting.
The CST was identified in every case. The two large meningiomas in this series caused significant mass effect on the adjacent brain tissue. This led to a corresponding large displacement of the CST away from the tumor. In both of these cases, it would have been nearly impossible to identify the motor cortex without the aid of the BOLD functional MR imaging study. This emphasizes the need of a method to depict the exact location of the motor cortex (the starting area) accurately to trace the CST precisely.
The CST was clearly identified in the six intraaxial tumors. In four of these cases, the CST was seen to be separate from the tumor, as defined by signal changes on routine MR images. It should be emphasized that this statement could not be made with confidence on the basis of the anatomic MR images.
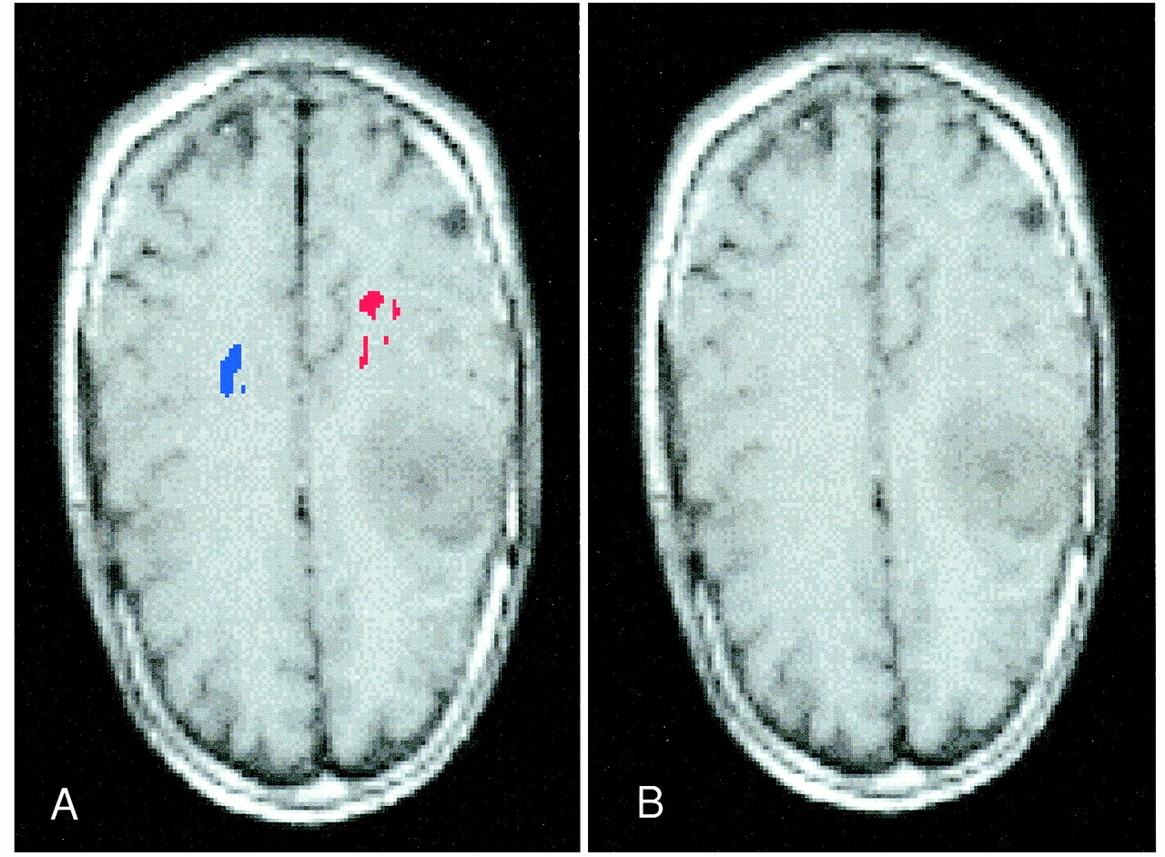
In one of the grade III/IV gliomas, the tumor was directly adjacent to the “foot” and “hand” areas of the CST (Fig 1 [page 84]). In this case, it is interesting to note the space between the blue area representing the foot area of the CST and the red area representing the hand area of the CST. This space probably represents the location of the CST that controls the leg and torso. Thus, it seems that the organization of the CST in the corona radiata corresponds to the pattern of the homunculus of the precentral gyrus.

fig 1. Images from the case of a 44-year-old woman with a grade III/IV left frontal glioma.
A, Routine axial T1-weighted image. The location of the CST is difficult to determine.
B, Diffusion trace image of the CST co-registered to an axial T1-weighed image. Visualization of the CST of the foot (blue) and the hand (red) shows its proximity to the main tumor mass. The space between the blue area and the red area probably represents the location of the CST that controls the leg and torso.
Another grade III/IV glioma showed a distinctly different pattern of involvement of the CST (Fig 2). On the diffusion trace image, the CST is not only displaced posteriorly but appears to be infiltrated by the tumor. In all other cases, the CST was seen as a compact bundle. In this case, the tracts of the CST, as defined by the diffusion trace image, appear to be distinct and separated by brain tissue.
Images from the case of a 30-year-old man with a right frontal grade III/IV glioma.
A, Routine axial T1-weighted image. The location of the CST is difficult to determine.
B, Diffusion trace image coregistered to an axial T1-weighted image shows the relationship of the tumor to CST (red) on the right. The CST on the side with the tumor (red) is not only displaced posteriorly but appears to be infiltrated by the tumor (see Discussion). The contralateral CST is shown in blue.
Discussion
The results indicate that the CST can be effectively revealed for patients with brain tumors. This promises to be a powerful technique. However, it should be stressed that this is an early study of a limited number of patients and that the CSTs depicted here were not corroborated intraoperatively.
In extraaxial tumors, the CST was displaced by the large mass in an expected manner. In the infiltrating, intraaxial tumors, three distinct patterns were appreciated. In the first, the diffusion trace images showed that the CST was not involved by the tumor, whereas the exact relationship between these two entities could not be adequately defined by the routine anatomic MR images.
In the second pattern, it appeared that the main tumor mass was directly adjacent to the CST (Fig 1). A case such as this seems optimal for future intraoperative assessment of the accuracy of the diffusion-weighted imaging method of identifying the CST presented herein. It is acknowledged that malignant glial cells almost always infiltrate past the borders of the tumor as seen on MR images. Therefore, when the CST is near a glial tumor, the malignant cells almost always infiltrate the white matter tracts on a microscopic level. However, for a neurosurgeon undertaking a gross total resection, the location of the CST with respect to the grossly visible tumor is crucial both in planning the surgical approach and in performing the resection.
In the third pattern, the tumor seemed to infiltrate into the CST macroscopically and displace its fibers (Fig 2 [page 84]). This deserves a special comment. From our understanding of the microscopic nature of invasion of the white matter tracts by malignant glial cells, it seems distinctly unlikely that the invading cells or vasogenic edema will push aside large bundles of axons of the CST to the extent visualized on Figure 2 by approximately several millimeters. In the normal CST, the axons are arranged rather regularly with scant intervening space. This degree of organization along one axis leads to a high FA. What may have occurred in the present case is that as malignant cells and edema insinuated themselves between the axons, they created increased freedom of movement of the water molecules in all directions. This is in contradistinction to the normal CST in which the diffusion of water molecules is severely limited in the directions perpendicular to the long axis of the axons. In such a scenario, the FA of the voxel could decrease to the point at which it falls below the cut-off value. Once this occurs, traces through this voxel would not be registered as part of the CST. This raises some questions regarding the accuracy of the described method in defining the exact borders of the CST in cases with tumor invasion and supports the notion that intraoperative correlation is necessary.
For this report, we used a novel method to delineate the CST optimally. In a previously described report (6), only the staring point was defined in tracing the diffusion vectors and the trace was allowed to propagate until it reached a minimum FA. This can lead to interesting results. For example, the white matter tracts from the precentral gyrus extend not only to the posterior limb of the internal capsule but also to a large number of other structures, including the corpus callosum, the postcentral gyrus, the superior frontal gyrus, and many more (Fig 3A [page 85]). Also, white matter tracts from the posterior limb of the internal capsule (or even the third quarter of the posterior limb of the internal capsule) extend to many cortical structures in the frontal and parietal lobes, not just to the precentral gyrus (Fig 3B). This creates a dilemma. If one uses a lower FA, all these white matter tracts are included in the tracing. If one uses a higher FA, the tracings typically do not extend very long. If one hopes to circumvent this problem by choosing only the most optimal tract from a specific starting point, in most cases, the result would be the CST (assuming the staring point to be in the motor homunculus). However, such a tracing would be exceedingly thin (0.25 mm) and would greatly underestimate the true volume of the entire CST.

Representation of the method used to identify the CST. Two regions of interest that contained the CST were selected: the motor homunculus of the precentral gyrus (yellow) and the posterior limb of the internal capsule (orange).
A, Using a lower FA, diffusion trace images of the precentral gyrus (yellow) would show all the white matter tracts emanating from the motor cortex. These would include tracts to the posterior limb of the internal capsule, the corpus callosum, and multiple other areas in the frontal and parietal lobes (red lines).
B, Similarly, diffusion trace images of the posterior limb of the internal capsule (orange) would show the CST and multiple other white matter tracts to the frontal and parietal lobes (red lines). To eliminate the white matter tracts that were depicted in each tracing but were not part of the CST, we mathematically intersected the two maps, eliminating those tracings that were not present on both maps.
C, Resultant map showed only the CST that was common to maps A and B.
In trying to define the entire CST optimally for the ultimate purpose of using this information to resect tumors adjacent to it, we used a method in which we selected two regions of interest that contained the CST: the motor homunculus of the precentral gyrus (Fig 3A) and the posterior limb of the internal capsule (Fig 3B). We chose a relatively low FA, thereby allowing the program to depict a large number of white matter tracings, which emanated from each selected region of interest. To eliminate the white matter tracts that were depicted in each tracing but were not part of the CST, we mathematically intersected the two maps and eliminated those tracings that were not present on both maps. In theory, what should remain is the CST (Fig 3C). For example, a U fiber would be traced out on the map originating from the precentral gyrus, but would not be traced out on the map originating from the posterior limb of the internal capsule. Consequently, the U fiber would not be depicted on the intersected map, which would show only those tracings that were seen on both maps.
The necessity to draw the region of interest in the precentral gyrus carefully cannot be overstated. On the one hand, it is imperative to include all the white matter that is associated with the specific area of the motor cortex being studied. Omission of an area would lead to underestimation of the volume of the CST and, in cases of surgery, could lead to devastating results. On the other hand, overestimation of the motor cortex also leads to errors. Originally, we outlined all the white matter subjacent to the areas of activation as seen on the BOLD functional MR images. However, it soon became apparent that there was significant contamination of the CST by the sensory (corticothalamic) tracts. In these cases, the “CST” contained traces that originated in the postcentral gyrus and terminated in the thalamus. This is not to say that the corticothalamic tracts are not important but rather that the accurate definition of the CST was compromised by the inclusion of areas that were activated during the BOLD functional MR imaging study but were outside the precentral gyrus.
The location of the CST in the posterior limb of the internal capsule deserves special mention. One would think that the exact location of what is likely the most important white matter tract in the brain would have been described in exquisite detail many years ago. However, it turns out that this has been a matter of some recent contention, and the anatomy of the CST has undergone a significant revision during the past few decades. As recently as 1981, Carpenter's classical textbook in neuroanatomy (13) averred that the CST was located in the anterior two thirds of the posterior limb of the internal capsule, on the basis of work conducted during the turn of the century. The next edition, which came out in 1983 (14), noted that recent explorations by electrical stimulation and careful anatomic work placed the CST in the third quarter of the posterior limb. This finding has been confirmed by anatomic MR imaging studies of patients with amyotrophic lateral sclerosis (15). The later assertion is supported by this study. In all cases, the entire CST gradually converged to a small volume located in the third quarter of the posterior limb of the internal capsule (Fig 4 [page 85]).

Diffusion trace image of the CST coregistered to an axial echo-planar (b = 0) image shows that the CST is located in the third quarter of the posterior limb of the internal capsule
Footnotes
1 Presented at the 38th Annual Meeting of the American Society of Neuroradiology, Atlanta, GA, April 2000.
↵2 Research support was provided by American Roentgen Ray Society Scholars Program 1999–2000.
3 Address reprint requests to Andrei I. Holodny, MD, Department of Radiology, UMDNJ-New Jersey Medical School, University Hospital C-320, 150 Bergen Street, Newark, NJ 07103-2714.
References
- Received November 10, 1999.
- Accepted after revision June 28, 2000.
- Copyright © American Society of Neuroradiology


