
Abstract
BACKGROUND AND PURPOSE: MR cisternography has been used as the noninvasive screening tool of the cerebellopontine angle. The purpose of this study was to directly compare two currently dominant types of sequences for heavily T2-weighted MR cisternography.
METHODS: Three-dimensional fast asymmetric spin-echo (3D-FASE) sequences, which are 3D half-Fourier rapid acquisition with relaxation enhancement and 3D constructive interference in the steady-state (3D-CISS) sequences, were compared on a clinical 1.5-T MR unit using the same scan times. In five healthy volunteers, the contrast-to-noise ratio (C/N) between CSF and the cerebellum was measured at three locations. Then, for qualitative analysis, the quality of the labyrinth was scored on the original source multiplanar reformatted images, the virtual endoscopic images, and the maximum intensity projection (MIP) images. In 20 consecutive patients with suspected cerebellopontine angle tumors, visualization of the tumors was evaluated using 3D contrast-enhanced spoiled gradient-echo imaging as the standard of reference.
RESULTS: Both sequences showed comparable mean C/N values; however, in qualitative analysis, the scores for 3D-CISS on the source, virtual endoscopic, and MIP images were significantly lower than those on the images obtained with 3D-FASE, owing to more prominent flow and magnetic susceptibility artifacts on the 3D-CISS sequences. In all subjects, discontinuity of the semicircular canals was seen on the virtual endoscopic and MIP images obtained with 3D-CISS, owing to susceptibility artifacts, but not on those obtained with 3D-FASE. All 12 tumors were detected by both sequences, but 3D-CISS gave one false-positive result.
CONCLUSION: 3D-FASE is considered the method of choice because artifacts are reduced and specificity is increased.
Heavily T2-weighted MR cisternography of the cerebellopontine angle has been used for the evaluation of various pathologic processes. It has been reported to be an excellent screening tool and also to be useful for detailed examinations (1–7). Currently, the three-dimensional (3D) fast asymmetric spin-echo (3D-FASE) sequence, which is a 3D half-Fourier rapid acquisition with relaxation enhancement (RARE)–based sequence (8–11), and the 3D constructive interference in the steady state (3D-CISS) sequence (12–14) are the most commonly used techniques for such diagnostic applications. The 3D-FASE sequence uses multiple 180° pulses for acquiring echoes, providing fewer susceptibility artifacts from local magnetic field inhomogeneity (6, 8, 9, 11). Multiple 180° pulses also can reduce the phase shift of the flowing spins (11). 3D-CISS is basically a gradient-echo–based sequence; however, it is designed to minimize susceptibility and flow artifacts by gradient moment nulling and by averaging the two images by opposite-direction phase cycling of excitation radio-frequency pulses (12). To our knowledge, neither sequence is routinely commercially available on a single scanner. We implemented both sequences on a 1.5-T clinical MR unit to directly compare them for use in MR cisternography.
Methods
3D-FASE and 3D-CISS sequences were compared on a1.5-T MR unit (Visart, Toshiba, Tokyo, Japan). Maximum gradient amplitude was 25 mT/m and slew rate was 130 mT/m per millisecond. Details of these sequences have been described in previous reports (13, 15). All examinations were performed using quadrature-surface phased-array coils for all volunteers and for eight of the patients. A quadrature head coil was used for 12 of the patients. After obtaining scout and shimming scans, the 3D-CISS and 3D-FASE sequences were performed.
Scan parameters for 3D-CISS were 16/8 (TR/TE), a flip angle of 70°, and a scan time of 7 minutes 23 seconds. Two images obtained by opposite-direction phase cycling of excitation radio-frequency pulses were averaged to generate the final CISS images. Parameters for 3D-FASE were 5000/241.6, echo spacing of 15.1 milliseconds, an echo train length of 80, and a scan time of 7 minutes 25 seconds. For both sequences, the field of view was 18 × 18 cm, the matrix was 512 × 256, and the slice thickness was 1.0 mm. Actual voxel size was 0.35 × 0.70 × 1.00 mm.
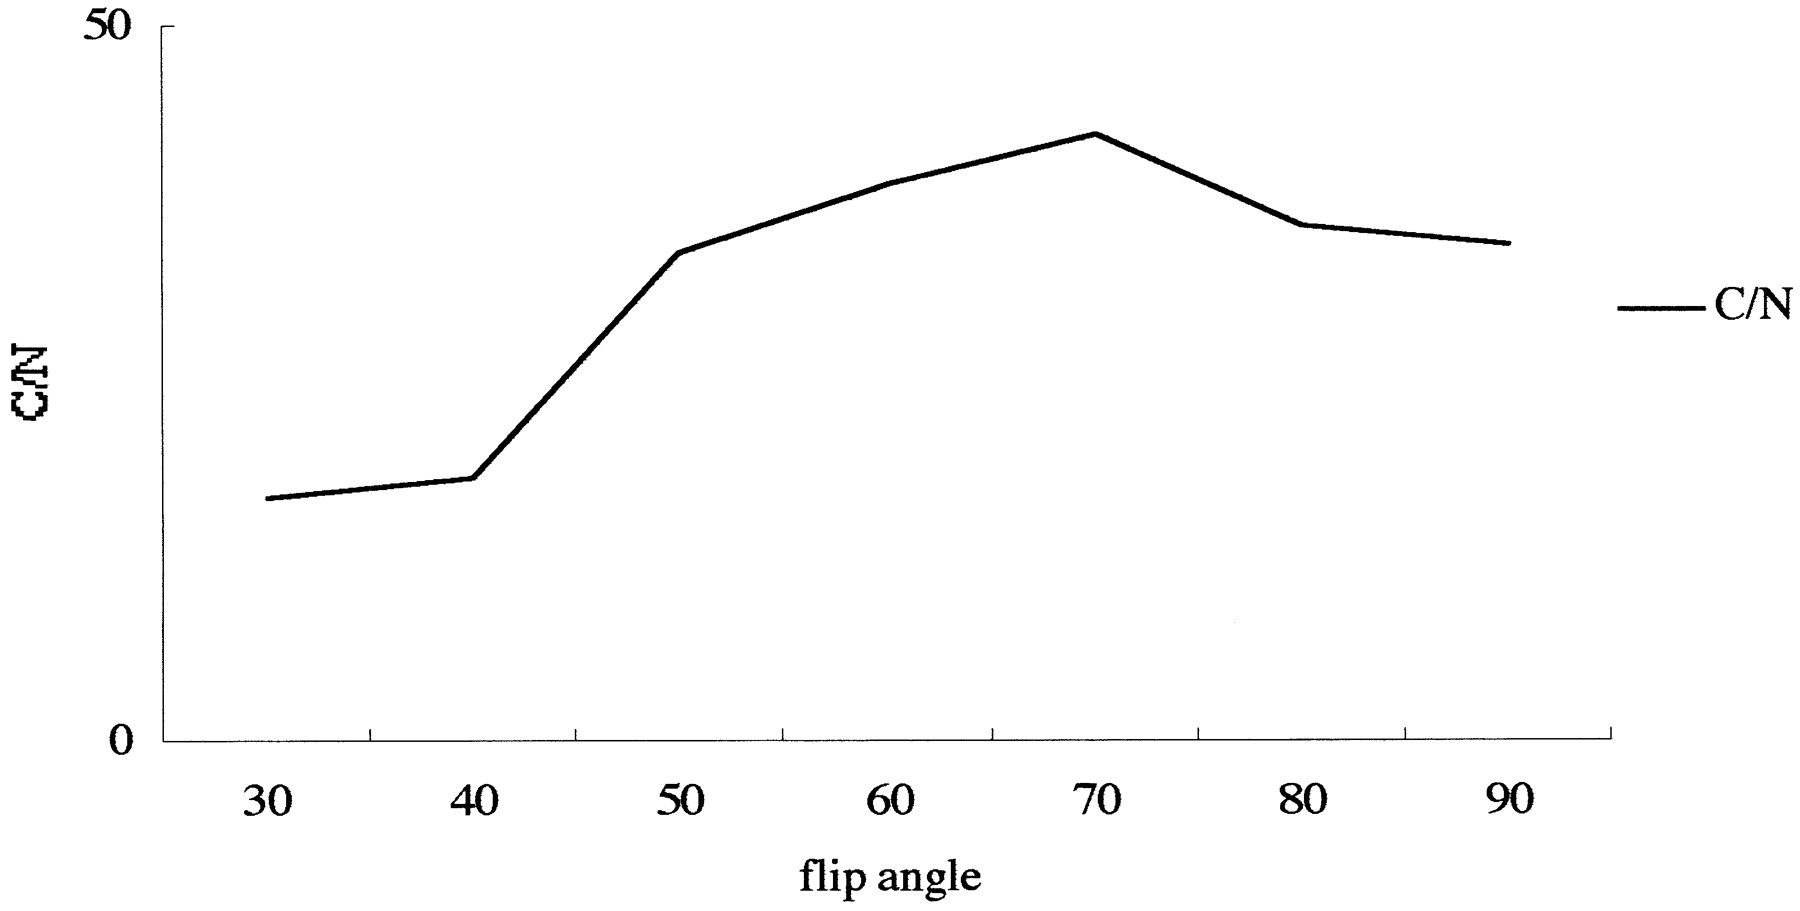
Initially, the flip angle of the excitation pulse was optimized for 3D-CISS in a volunteer. Subsequently, the flip angle was varied from 30° to 90° in 10° increments, and the contrast-to-noise ratio (C/N) between CSF and the cerebellum in a slice containing the cochlear nerve was measured. A flip angle of 70° provided the highest C/N, and this flip angle was therefore used in subsequent 3D-CISS studies (Fig 1).

Contrast-to-noise ratio (C/N) between CSF and the cerebellum on 3D-CISS images obtained at various flip angles in a volunteer. The maximum C/N was obtained at a flip angle of 70°. In this particular subject, the C/N on 3D-FASE images was 50.3
A TE of 8 milliseconds in 3D-CISS is the shortest TE on this MR scanner that allows an 18-cm field of view with a 512 × 512 matrix readout even if the slab is tilted. A phantom experiment was performed to evaluate the effect of a longer TE (8 milliseconds) as compared with a shorter TE (6 milliseconds). With TE = 6, the field of view has to be made larger, up to 24 cm, if the slab is tilted. A polyethylene tube of 2.4 mm in diameter filled with distilled water was coiled and placed on the 20 × 20 × 20-cm3 water phantom. This model was scanned with a 3D-CISS sequence using a TE of 6 milliseconds (12/6/1, flip angle of 70°) and a TE of 8 milliseconds (16/8/1, flip angle of 70°), and with a 3D-FASE sequence. In this particular phantom experiment, the field of view was 20 × 20 cm in a nontilted axial slab.
In 20 consecutive patients with suspected cerebellopontine angle tumor (eight males and 12 females, 11–72 years of age), a contrast-enhanced 3D spoiled gradient-echo sequence (3D-SPGR) was also used after intravenous administration of0.1 mmol/kg of contrast material. The scan parameters for the 3D-SPGR sequence were 23/10 (TR/TE) with first-order gradient moment nulling, a flip angle of 25°, a field of view of 18 × 18 cm, a matrix of 256 × 224, and a slice thickness of 1.0 mm.
In five healthy volunteers, 3D-CISS and 3D-FASE sequences were used to measure the C/N between CSF and the cerebellum at three locations: in a slice containing the root entry zone of the trigeminal nerve, in one containing the cochlear nerve, and in one containing the cochlear aqueduct. The region of interest (ROI) for noise measurements was drawn as a 2-cm circle in the most artifact-free background area. The C/N was calculated as follows:  Then, for qualitative analysis, the overall image quality of the original source images, the flow ghosts from CSF, the quality of the multiplanar reformatted (MPR) images of the internal auditory canal, the susceptibility artifacts on the original source images, the quality of maximum intensity projection (MIP) images of the labyrinth, the quality of virtual endoscopic images of the labyrinth, and the depiction of vessels were scored as 1 (poor), 2 (fair), 3 (good), or 4 (excellent) by two radiologists working independently. Any discrepancy between the two scorers was discussed until a consensus was reached. Statistical analysis was performed using the paired Student's t-test for quantitative analysis and the Mann-Whitney U test for qualitative analysis.
Processing to generate the virtual endoscopy images was done by the surface-rendering method (16). First, the lower threshold was set as the mean signal intensity in the ROI containing the horizontal part of the superior semicircular canal minus one-half the SD in the ROI. The upper threshold was defined as the maximum signal intensity of the image data. Then, the voxels with signal intensity values between the lower and upper thresholds were segmented using the region-growing method. Segmented volumes ranged from 1.3 to 1.6 mL. Region-growing was started at the fundus of the internal auditory canal.
In 20 patients, visualization of the tumors was evaluated using contrast-enhanced 3D spoiled gradient-echo (3D-SPGR) studies as the standard of reference. Evaluation of contrast-enhanced 3D-SPGR images was performed by the same two radiologists after all evaluations of 3D-CISS and 3D-FASE images had been completed.
The study protocol was approved by our institutional medical ethics committee, and all patients gave their informed consent to participate in the study.
Results
The 3D-CISS and 3D-FASE sequences showed comparable mean C/N values (each, 35.4). In the phantom study, the 3D-CISS images obtained with TE = 6 and TE = 8 both showed susceptibility artifacts in the water-filled tube, whereas no artifacts were seen on the images obtained with the 3D-FASE sequence (Fig 2). The results of quantitative analysis are shown in Table 1. However, in qualitative analysis, all the scores for the CISS sequence, except for the quality of MPR images (Fig 3), were significantly lower than those for the 3D-FASE sequence, owing to the more prominent flow ghosts and magnetic susceptibility artifacts on the 3D-CISS images (Figs 4 and 5). On the virtual endoscopic images of the labyrinth, it was not possible to navigate through the three semicircular canals of any of the volunteers imaged with 3D-CISS, but it was possible in all of the volunteers imaged with 3D-FASE (Fig 6). On MIP images, discontinuity of the semicircular canals was seen in all subjects imaged with 3D-CISS, owing to susceptibility artifacts, but no discontinuities were seen on the 3D-FASE images (Fig 7). The results of qualitative analysis are shown in Table 2.
Results of contrast-to-noise ratio measurements in volunteers
Results of qualitative analysis

Phantom experiment to evaluate the effect of TE on 3D-CISS sequences. Water-filled polyethylene tube is coiled and placed on cubic water phantom.
A–C, 3D-CISS (12/6/1) (A), 3D-CISS (16/8/1) (B), and 3D-FASE (5000/241.6/1) (C) sequences. Bandlike susceptibility artifact is seen on A and B (arrows); however, it is slightly more prominent on B. There is no artifact on C (arrow). Note that the cubic water phantom signal is uniform in C. This experiment shows that shorter TE has some ability to reduce susceptibility artifacts on 3D-CISS studies, but 3D-FASE has far fewer susceptibility artifacts.

Multiplanar reformatted images of the internal auditory canal of a volunteer.
A and B, Four nerve branches are clearly depicted by both 3D-CISS (16/8/1) (A) and 3D-FASE (5000/241.6/1) (B) sequences.

A and B, Flow ghosts of CSF are pronounced on 3D-CISS (16/8/1) sequence (white arrows, A); however, no ghosts are seen on 3D-FASE (5000/241.6/1) image (B) in this volunteer. Note that the shape of the vestibule near the oval window is deformed on the 3D-CISS image (black arrow, A) but not on the 3D-FASE image (black arrow, B)

A and B, Low-signal bands due to susceptibility artifacts are prominent from the vestibular area just above the oval window to the crus of the lateral semicircular canal on 3D-CISS (16/8/1) image (arrow, A), whereas no low-signal bands are seen on 3D-FASE (5000/241.6/1) image (B) in this volunteer. Intracochlear anatomy, such as modiolus (M) and osseous spiral lamina (O), is depicted slightly better on 3D-CISS image, probably because of the susceptibility effect from these bony structures. Endolymphatic duct (E) is visible only on 3D-CISS image in this particular subject
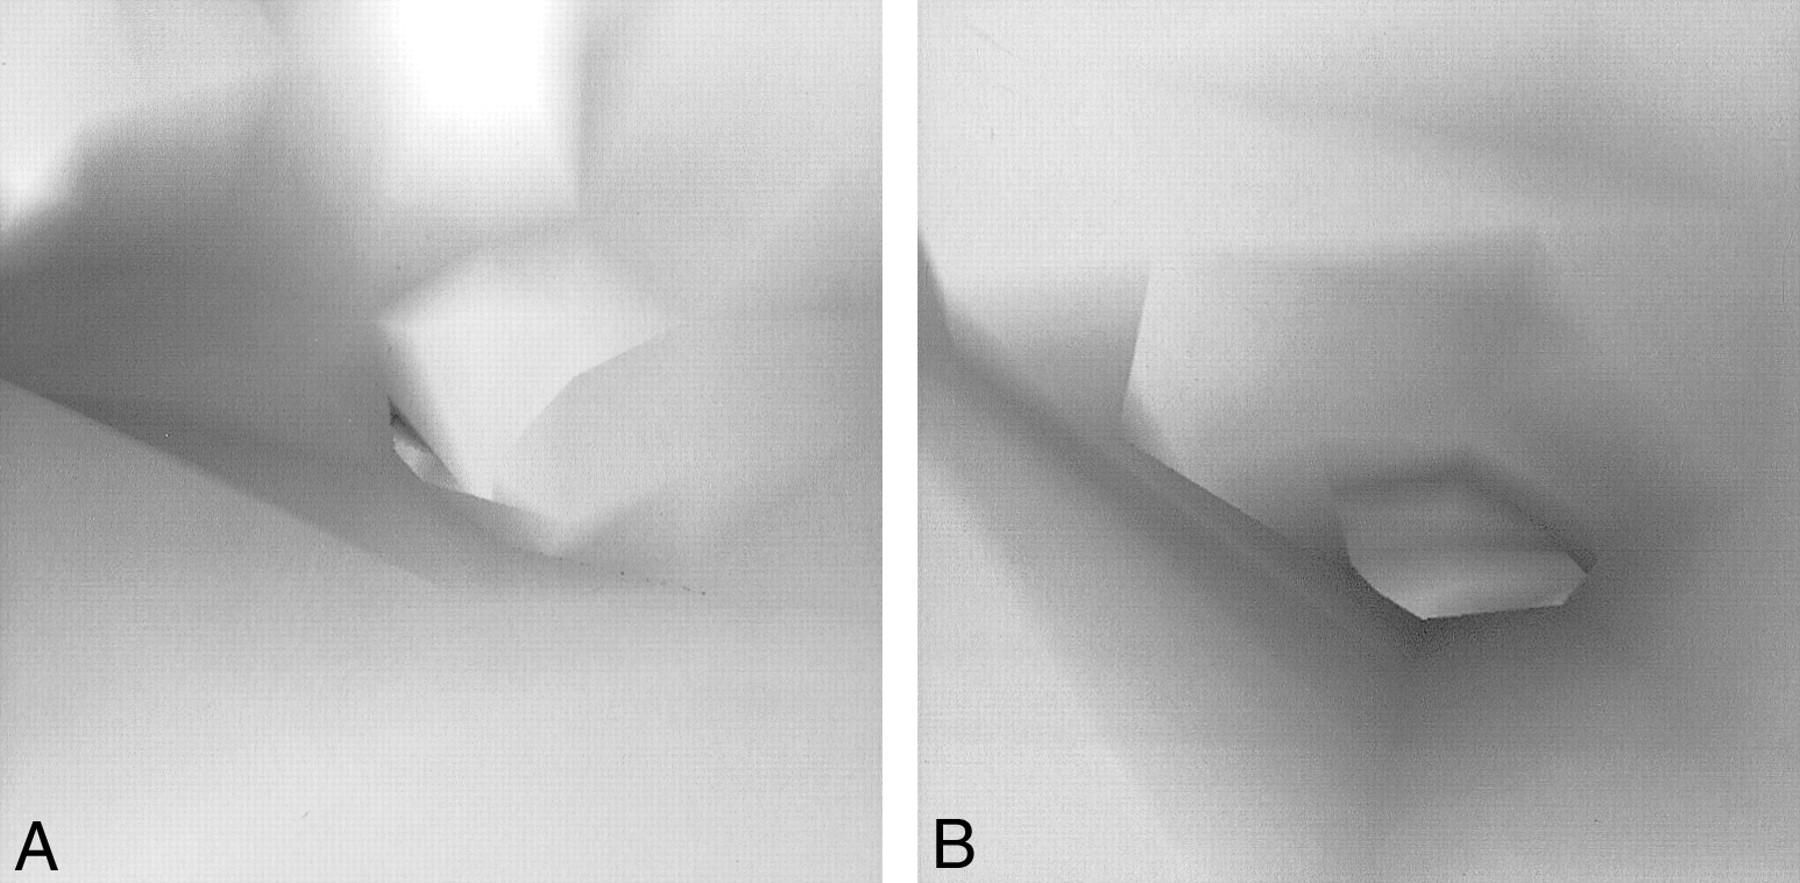
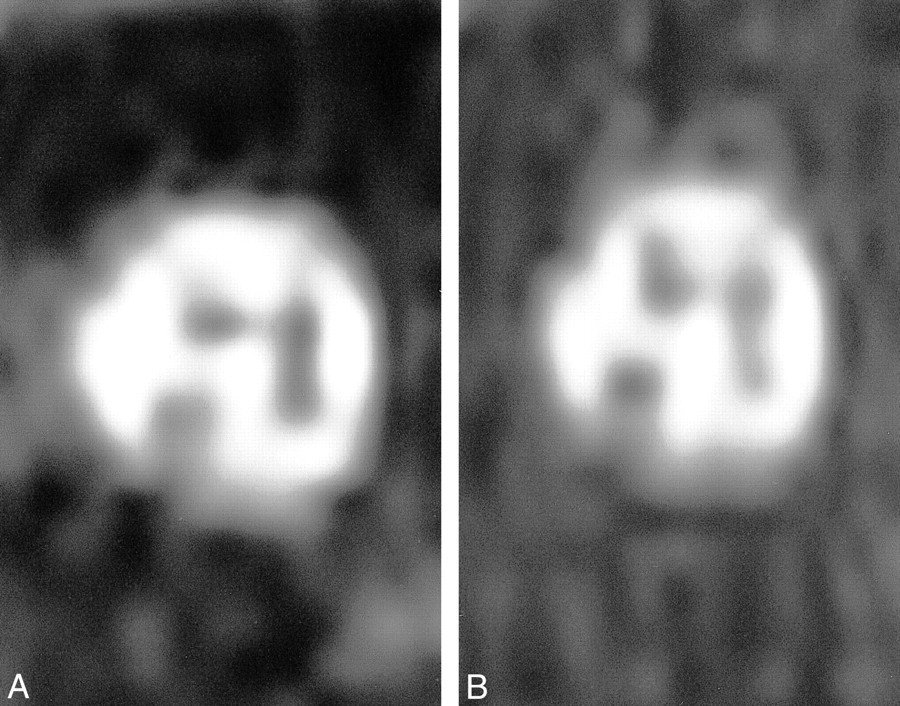
Virtual endoscopic images of the superior semicircular canal from the vestibule in a volunteer.
A and B, Pseudoocclusion is seen on 3D-CISS image (16/8/1) (A). On 3D-FASE (5000/241.6/1) image (B), it is possible to navigate through the three semicircular canals.
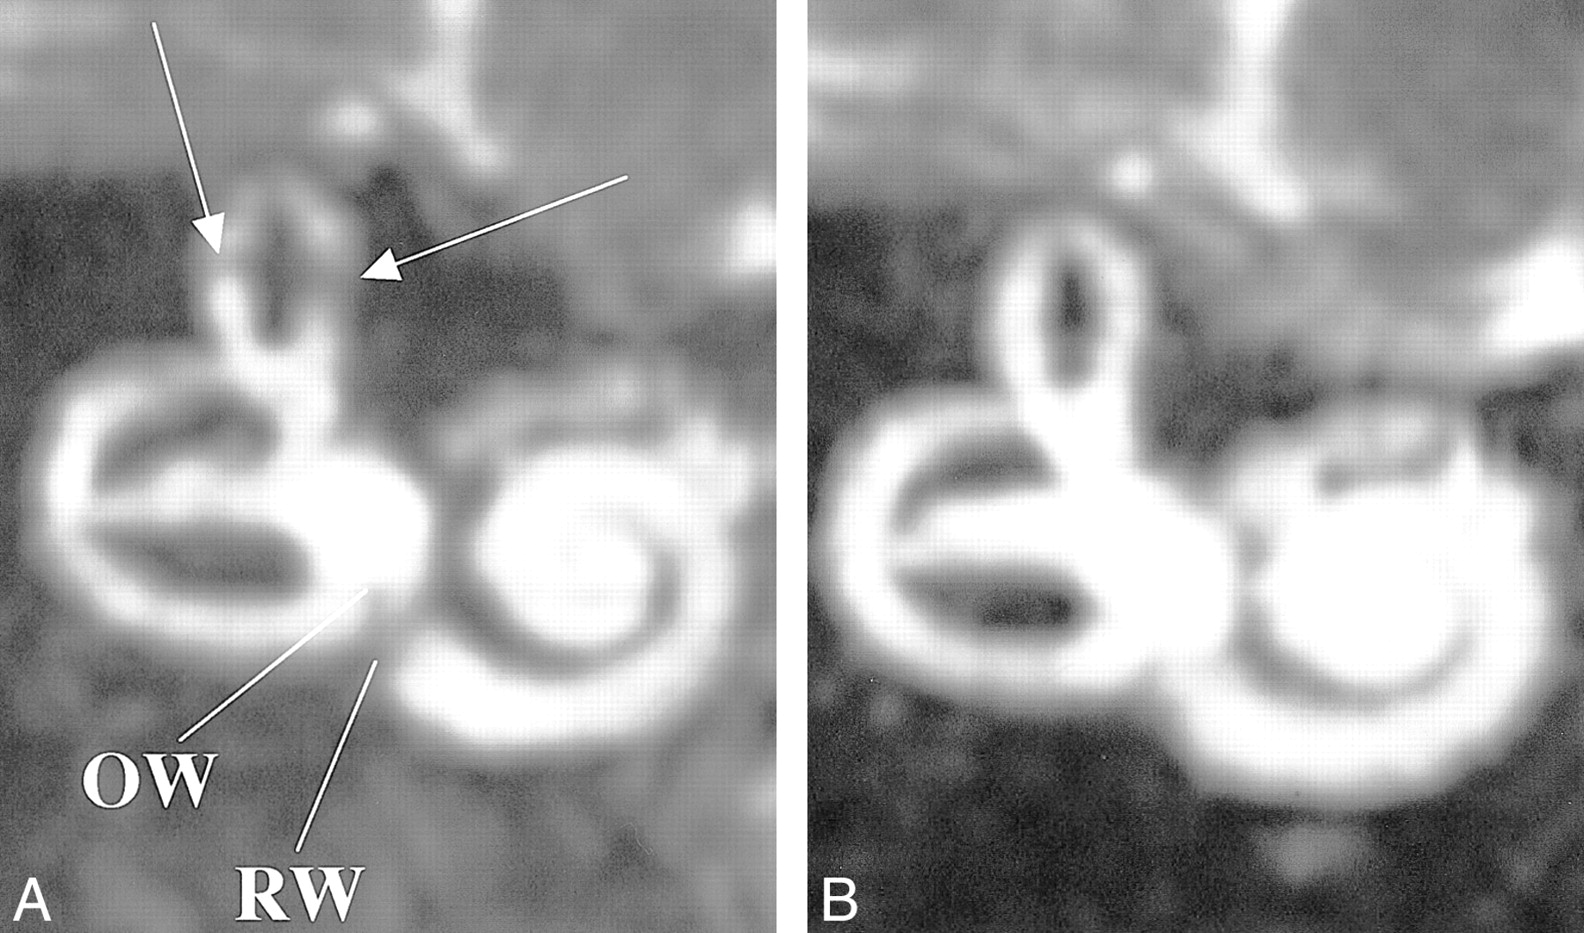
MIP image of the labyrinth in a volunteer.
A and B, Low-signal artifacts are seen in superior semicircular canal (arrows, A) as well as in the area of the oval window (OW) and round window (RW) on 3D-CISS image (16/8/1) (A), but not on the 3D-FASE image (5000/241.6/1) (B).
Twelve masses were detected by contrast-enhanced 3D-SPGR in five patients. One patient was found to have neurofibromatosis type 2, with schwannomas of the oculomotor, trigeminal, acoustic, and vagus nerves bilaterally. Three patients had unilateral acoustic schwannomas (Fig 8), and one patient had a cerebellopontine angle meningioma. All tumors were detected by both sequences. However, 3D-CISS gave a false-positive result in one case, in which a small masslike low-signal area was seen in the fundus of the internal auditory canal (Fig 9).

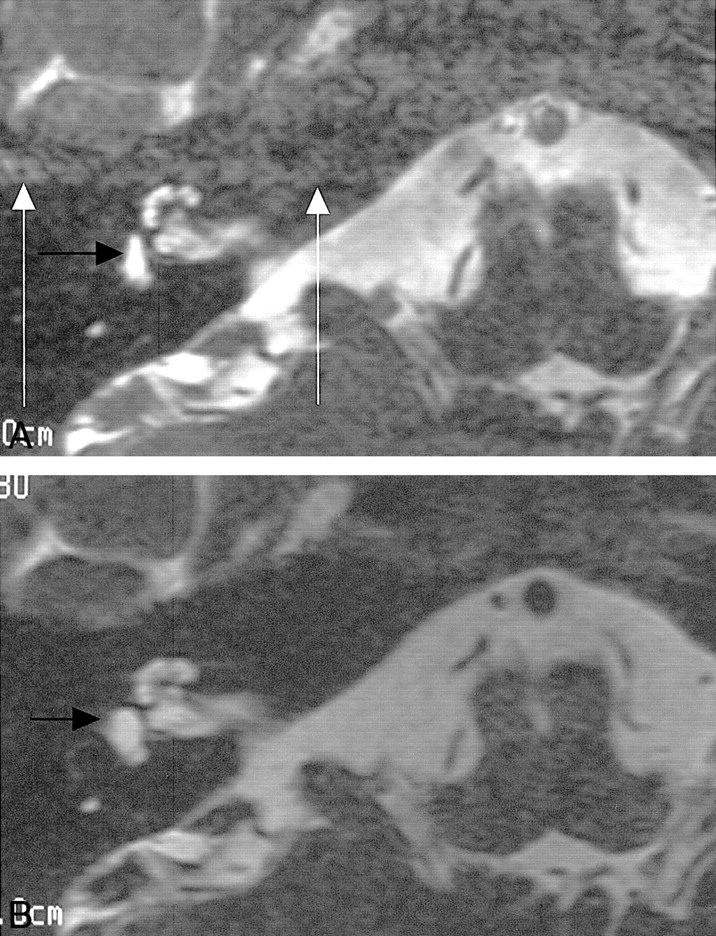
63-year-old man with right intracanalicular acoustic schwannoma.
A–E, A mass (arrow) is seen on unenhanced (A) and contrast-enhanced (B) 3D-FASE (5000/241.6/1) images, on unenhanced (C) and contrast-enhanced (D) 3D-CISS (16/8/1) images, and on contrast-enhanced 3D-SPGR (23/10/1) image (E). Note that the signal of the mass is not influenced by contrast material on the 3D-FASE image, but enhancement is present on the 3D-CISS sequence.
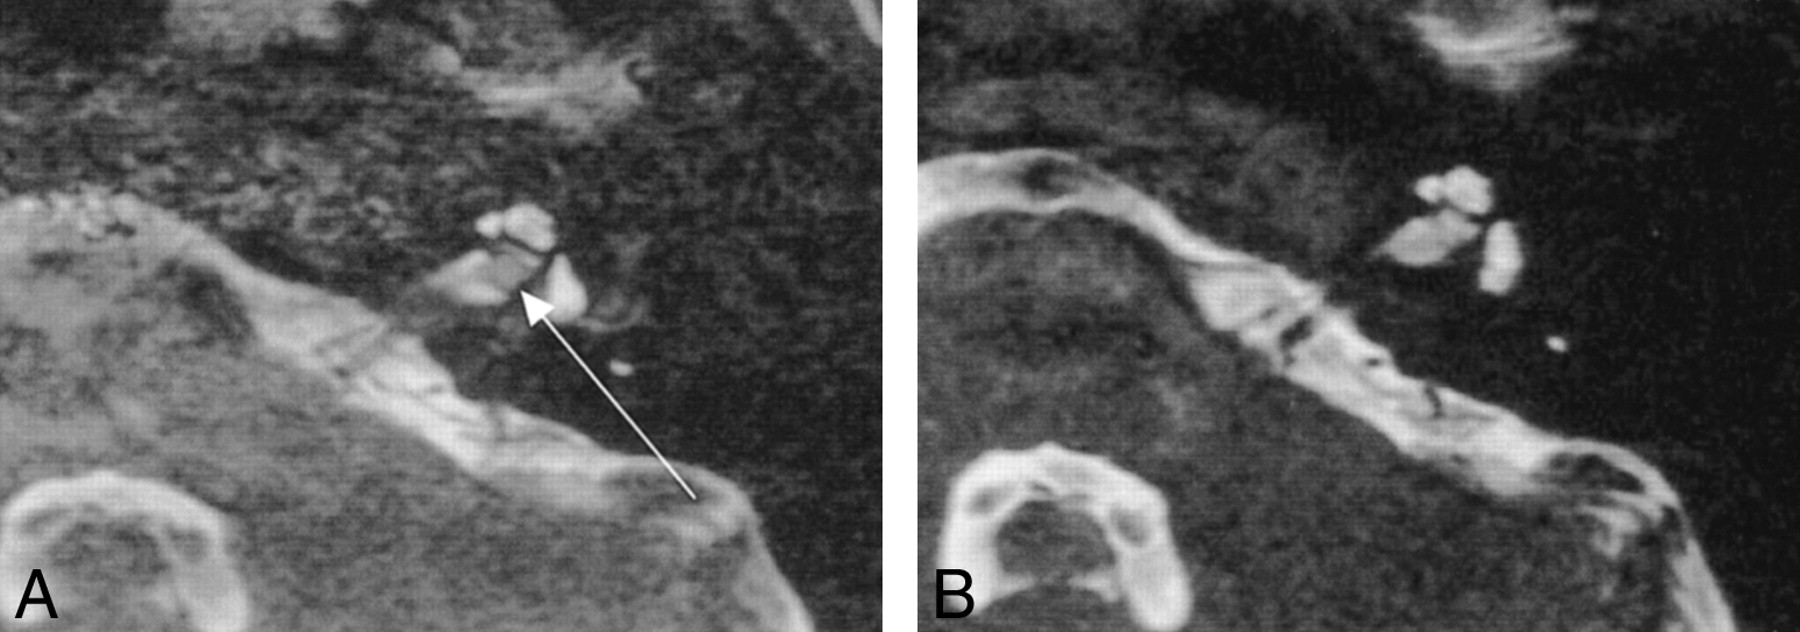
False-positive finding on 3D-CISS image in an 11-year-old girl.
A and B, A small masslike nodule is seen at the fundus of the left internal auditory canal on 3D-CISS (16/8/1) image (arrow, A), although no mass is seen on 3D-FASE (5000/241.6/1) image (B). This artifact was assumed to be due to the combination of susceptibility and flow artifacts.
Discussion
Basically, the 3D-CISS sequence has been designed to compensate for CSF motion and susceptibility artifacts due to local magnetic field inhomogeneities (13). However, flow ghosts of CSF and susceptibility artifacts are seen on 3D-CISS images despite the use of magnetic field shimming. The application of more than two directions of phase cycling, such as in the segment-interleaved motion-compensated acquisition in steady state (SIMCAST) technique, may help to reduce these artifacts, although multidirectional phase cycling significantly lengthens the scan time (2, 17). For example, if we were to perform phase cycling in four directions, the scan time would be doubled as compared with that required for the present 3D-CISS method. The signal acquired in 3D-CISS contains some contribution from gradient echoes; thus, the presence of metallic objects in the patient would increase susceptibility artifacts on 3D-CISS images. In this study, none of the patients had excessive metallic dental amalgams.
The contribution of gradient echoes sometimes increases the signals from vessels. Vessels that are perpendicular to the slab tend to show an increase in signal near the entrance to the slab due to the time-of-flight effect. This phenomenon sometimes increases the signal of the basilar or vertebral artery. Thus, the depiction of these vessels is inferior to that on 3D-FASE images, in which vessels appear as complete flow voids. The visualization of these vessels is important in the evaluation of neurovascular compression (4, 11, 18).
3D-FASE is a 3D-RARE–based sequence that is less susceptible to local magnetic field inhomogeneities. This sequence does not require shimming in the prescan. In 3D-CISS, susceptibility artifacts on the source, MIP, and virtual endoscopic images can simulate labyrinthitis or intralabyrinthine schwannoma. Susceptibility artifacts are frequently seen in semicircular canals and in the area of round and oval windows on 3D-CISS images. This method is therefore unsuitable for examining candidates for cochlear implant, in whom the patency of the cochlea is important (9, 12). A small masslike low-signal area seen in the fundus of the internal auditory canal on the 3D-CISS image in Figure 9 was assumed to be due to the combination of susceptibility and flow artifacts. Furthermore, the mean specific absorption ratio (SAR) of 3D-FASE was found to be slightly lower than that of 3D-CISS in this study (0.053 W/kg for 3D-CISS vs. 0.019 W/kg for 3D-FASE using a quadrature head coil). This difference in SAR values may be a significant issue at ultra-high field strengths, such as 3.0 T. The quality of the MPR images was comparable for both types of sequences. MPR images are important for the evaluation of hypogenesis of the cochlear nerve (19, 20).
The contrast enhancement of acoustic tumors can be evaluated by 3D-CISS but not by 3D-FASE (21) (Fig 7). Contrast between the normal cranial nerve and vestibular schwannoma increases after contrast administration on 3D-CISS images (21); however, as a screening tool for vestibular schwannoma, this sensitivity to contrast material is not a significant advantage.
There is potential for further improvement in 3D-FASE. The application of a fast recovery pulse may permit further reduction in the TR while maintaining acceptable T2 contrast (22). Comparison between an improved version of 3D-CISS, such as 3D-SIMCAST (17), and 3D-FASE with a fast recovery pulse would be an interesting topic for future investigations. 3D-SIMCAST uses more than two-directional phase cycling and shorter TEs by fractional echo, resulting in the reduction of susceptibility artifacts on gradient-echo–based images (17, 23). 3D-FASE is based on the fast spin-echo sequence with a long echo train length. Thus, the blurring of short-T2 substances is pronounced as compared with 3D-CISS. However, for the purpose of MR cisternography, blurring of nonwater tissue is not a significant problem (8, 15).
Conclusion
Although the C/N and sensitivity of tumors were comparable in both sequences, the higher specificity and reduction in artifacts offered by 3D-FASE make it the method of choice for MR cisternography of the cerebellopontine angle.
Footnotes
1 Address reprint requests to Shinji Naganawa, MD, Department of Radiology, Nagoya University School of Medicine, 65 Tsurumai-cho, Shouwa-ku, Nagoya 466-8550, Japan.
References
- Received October 23, 2000.
- Accepted after revision January 3, 2001.
- Copyright © American Society of Neuroradiology
In this issue


Jump to section
Related Articles
Cited By...
- Does CISS MRI Reliably Depict the Endolymphatic Duct in Children with and without Vestibular Aqueduct Enlargement?
- Correlation between Histopathology and Signal Loss on Spin-Echo T2-Weighted MR Images of the Inner Ear: Distinguishing Artifacts from Anatomy
- Measuring 3D Cochlear Duct Length on MRI: Is It Accurate and Reliable?
- Visualization of the Peripheral Branches of the Mandibular Division of the Trigeminal Nerve on 3D Double-Echo Steady-State with Water Excitation Sequence
- 3D Double-Echo Steady-State with Water Excitation MR Imaging of the Intraparotid Facial Nerve at 1.5T: A Pilot Study