
Abstract
BACKGROUND AND PURPOSE: Initially decreased apparent diffusion coefficient (ADC) values are reversible if reperfusion is rapidly performed after focal brain ischemia. We sought to determine if reperfusion-induced renormalization of initially abnormal values indicates reversal of cellular, morphologic changes that occur during acute ischemia.
METHODS: Eighteen rats underwent 30 minutes of middle cerebral artery occlusion (MCAO) without reperfusion (group A, n = 6), with 1.5 hours of reperfusion (group B, n = 6), or with 12 hours of reperfusion (group C, n = 6). Diffusion- and perfusion-weighted MR images were obtained at the end of MCAO and 1.5 and 12 hours after reperfusion. Immediately after the final MR study, the brains were fixed by cardiac perfusion with 4% paraformaldehyde. Neuronal injury was evaluated on hematoxylin-eosin-stained slices, and astrocytic size was determined by the area of glial fibrillary acidic protein (GFAP) plus S-100 expression.
RESULTS: In group A in which ADC values decreased significantly, 47 ± 12% of the neurons were slightly shrunken; astrocytes were moderately swollen, and the area expressing GFAP plus S-100 was larger than that in the contralateral hemisphere (117 μm2 ± 6 vs 89 μm2 ± 2; P < .001). In group B in which ADC had renormalized, most neurons were moderately shrunken, and the frequency of such neurons was greater in group B (92% ± 2) than in group A (P < .001); astrocytes were markedly swollen, and the area was larger than that in the contralateral hemisphere (123 μm2 ± 8 vs 85 μm2 ± 4, P < .001). In group C in which a secondary ADC decrease occurred, most neurons (94% ± 3) were severely shrunken, and some had eosinophilic cytoplasm; astrocytes were disintegrated, and the area of GFAP plus S-100 expression was reduced (78 μm2 ± 4 vs 90 μm2 ± 5, P < .001).
CONCLUSION: Reperfusion-induced acute renormalization of ADC values is not associated with the reversal of neuronal shrinkage and astrocytic swelling that occur during ischemia. Conversely, the morphologic changes of astrocytes and neurons progressively worsen over time, although ADC values show a biphasic change.
Although diffusion-weighted (DW) MR imaging has been used increasingly in delineating ischemic stroke, the mechanisms of decrease in the apparent diffusion coefficient (ADC) of water that are used to generate contrast on DW images are not well understood. Previous evidence suggests that decreases in ADC are likely related to cellular swelling that is caused by shifts of water from the extracellular space to the intracellular space where water movement is more restricted (1–5). Recent experimental studies demonstrated that initially reduced ADC values that occur during ischemia can renormalize with rapid restoration of cerebral blood flow (6–9) and that such renormalized ADC values can secondarily decrease (10–16). However, to our knowledge, it has not been determined whether changes in ADC values (ie, initial decrease, renormalization, and secondary decrease) are associated with corresponding changes in cellular morphology (such as cellular swelling) after a short period of focal brain ischemia.
The purposes of the present study were to determine 1) if the initial decreases in ADC after focal cerebral ischemia are accompanied by perturbations and abnormalities in cellular morphology, 2) if acute renormalization of ADC values induced by early reperfusion indicates resolution of cellular perturbations and abnormalities that arose during ischemia, and 3) if similar values of ADC during the initial and secondary decreases reflect similar histopathologic abnormalities. To achieve these goals, DW imaging was performed in animals undergoing 30 minutes of middle cerebral artery occlusion (MCAO) with immediate sacrifice and tissue fixation, 30 minutes of transient MCAO followed by 90 minutes of reperfusion and immediate fixation, and 30 minutes of transient MCAO followed by 12 hours of reperfusion and brain fixation (n = 6 per group). With the fixed tissue sections, neuronal injury was determined by hematoxylin-eosin (H&E) staining, and changes of astrocytic expression of glial fibrillary acidic protein (GFAP) plus S-100 nuclear protein were assessed by immunohistochemistry. To gain further insight into the degree of injury, the ultrastructural changes of representative astrocytes and neurons were investigated with electron microscopy. Subsequently, the changes in ADC values in each group were correlated with these indices of neuronal and astrocytic injury.
Methods
Animal Preparation and Induction of Ischemia
All experimental procedures were approved by our institutional animal research committee. Eighteen male Sprague-Dawley rats weighing 300–350 g were anesthetized with 2.0% isoflurane delivered in air at 1.0 L/min. PE-50 polyethylene tubing was inserted into the left femoral artery for continuous monitoring of mean arterial blood pressure throughout the study and for obtaining blood samples to measure pH, PaCO2, and PaO2. Another piece of PE-50 polyethylene tubing was inserted into the left femoral vein for injection of gadopentetate dimeglumine for perfusion-weighted (PW) imaging. During the surgical procedure, temperature was continuously monitored with a rectal probe and maintained at 37°C with a thermostatically controlled heating lamp.
Focal brain ischemia was induced with the intraluminal suture MCAO method as initially described by Koizumi et al (17). Briefly, the right common carotid artery, internal carotid artery, and external carotid artery were exposed through a midline incision of the neck. The proximal portions of the right common carotid artery and external carotid artery were ligated with 5-0 surgical sutures. A 4-0 monofilament nylon suture, its tip rounded by flame and coated by silicone, was inserted through an arteriotomy of the right common carotid artery 3 mm below the carotid bifurcation and advanced into the internal carotid artery until a mild resistance was felt, indicating that the occluder had entered the anterior cerebral artery and thus blocked the blood flow to the middle cerebral artery.
Animals were subjected to 30 minutes of MCAO with immediate sacrifice (group A, n = 6), 30 minutes of transient MCAO followed by 90 minutes of reperfusion (group B, n = 6), and 30 minutes of transient MCAO followed by 12 hours of reperfusion (group C, n = 6). The rats in groups B and C were reperfused in the MR magnet bore by withdrawing the occluder.
MR Imaging Measurements
Animals were fixed to a head holder with a tooth-bar and ear-bars and quickly placed into the MR magnet bore after MCAO. Inside the magnet, anesthesia was maintained with 1.0% isoflurane delivered in air at 1.0 L/min. Body temperature was maintained at 37°C by means of a thermostatically regulated, heated-air flow system. The MR imaging studies were performed in a GE CSI-II 2.0 T/45 cm imaging spectrometer (GE NMR Instruments, Fremont, CA) operating at 85.56 MHz for hydrogen 1 and equipped with ±20 G/cm self-shielding gradients. Half-sine-shaped diffusion-sensitive gradient pulses were applied along each of the three orthogonal gradient axes (x, y, and z). Eight contiguous, coronal, 2-mm-thick sections were acquired with DW spin-echo echo-planar imaging (18), and nine b values ranging from 18 to 1552 s/mm2 were used to measure the ADC of water along each of the three diffusion-gradient directions for each section. The imaging offset in the coronal plane was adjusted such that the second section started from the frontal pole of the brain. The MR imaging parameters were field of view of 25.6 × 25.6 mm, pixel resolution of 64 × 64, 5000/74/2 (TR/TE/excitations), echo-planar imaging data acquisition time of 65 ms, diffusion-sensitizing-gradient pulse width of 7 ms, and diffusion-sensitizing-gradient separation time of 35 ms. The natural logarithm of the signal intensity was plotted versus b value, and the slope of the resultant line was extracted to yield ADC by using linear least-squares regression. The ADC map was calculated by averaging the three orthogonal ADC values on a pixel-by-pixel basis (19).
T2-weighted spin-echo echo-planar imaging was used to perform dynamic contrast material-enhanced PW imaging for demonstrating arterial occlusion and reperfusion (20). Four contiguous, coronal, 2-mm-thick sections, which corresponded to the center four diffusion sections, were acquired with field of view of 25.6 × 25.6 mm and pixel resolution of 64 × 64. A total of 40 spin-echo echo-planar images (900/74/1, echo-planar imaging data acquisition time of 65 ms) were obtained for each section. A bolus injection of 0.25 mL of gadopentetate dimeglumine was administered following acquisition of the 15th image. A cerebral blood flow (CBF) index was derived from PW imaging data to quantitatively estimate the change in CBF during occlusion and after reperfusion, as previously described (13).
DW and PW images were acquired at 25 minutes after MCAO in all groups, at 90 minutes after reperfusion in groups B and C, and at 12 hours in group C.
Analysis of CBF Index and ADC Values
On the CBF index maps or ADC maps at the level of the optic chiasm (section 4), one region of interest (ROI) in the center of the lesion of the ipsilateral caudoputamen (10 × 10 pixels on CBF index maps and 4 × 4 pixels on ADC maps) and another in the homologous region of the contralateral hemisphere were selected for the measurement of CBF index or ADC values. The percentage change in the CBF index in the ipsilateral hemisphere in comparison with the CBF index in the contralateral hemisphere was used to estimate CBF changes during occlusion and after reperfusion. The two ROIs on the ADC maps were labeled for histologic analysis, as shown in Fig 1.

Representative ADC maps from each group. ROIs (□) in the center of the lesion of the ipsilateral ischemic hemisphere and in a homologous region of the contralateral nonischemic hemisphere were chosen for measurement of ADC values and labeled for histologic analysis.
Histopathologic Evaluation
After the MR imaging protocol was completed, the rats were immediately subjected to cardiac perfusion-fixation with 200 mL of phosphate buffered 4% paraformaldehyde (21). The rats were decapitated, and the heads were fixed overnight in the same paraformaldehyde solution. The next day, the brains were removed from the skull. Each brain was cut into seven 2-mm-thick coronal slabs starting from the frontal pole of the brain and labeled A (frontal) through G (occipital). Slices from the posterior surface of slab C and the anterior surface of slab D at the level of the optic chiasm that precisely matched section 4 on the ADC maps were used for the following histologic evaluation. The corresponding ROI on the histologic slices was matched to that on the ADC maps by using a previously described coregistration method (9). All histologic analyses were performed by one investigator (K.-F.L.) who was blinded to the animal groups.
Neuronal analysis.—
The first 6-μm-thick slice from the posterior surface of slab C was stained with H&E for the evaluation of neuronal injury. A global laboratory image analysis system (Data Translation Incorporated, Marlboro, MA) was used for quantitation by collecting images through a Sony video camera interfaced with an Olympus microscope system. Under a light microscope at ×400 magnification, 10 nonoverlapping fields in each selected ROI were examined to determine the number of intact neurons and injured neurons. Injured neurons included both the shrunken neurons that exhibited condensed neuronal perikarya surrounded by swollen cellular processes and necrotic (red) neurons that exhibited nuclear pyknosis and cytoplasmic eosinophilia (22). The percentage of injured neurons was obtained by dividing the number of injured neurons by the total number of intact and injured neurons.
Astrocytic analysis.—
The second 6-μm-thick slice from the posterior surface of slab C was obtained for astrocytic staining. Immunohistochemical probes for GFAP and S-100 protein (Dako Corporation, Carpenteria, CA) were used to detect astrocytes by double staining. Both antigens were demonstrated by the avidin-biotin peroxidase system. The GFAP in both perikaryal cytoplasm and processes of astrocytes was stained brown with diaminobenzidine substrate. On the same slice, S-100 protein within the nuclei of astrocytes was stained purple with the Vector VIP substrate kit (Vector Lab Inc, Burlingame, CA). With use of the imaging system indicated above, 10 nonoverlapping fields in each selected ROI were examined to determine the number of astrocytes coexpressing GFAP and S-100 and the areas of their coexpression.
Electron microscopic analysis.—
Slab D was cut into eight pieces that included the entire surface of each hemisphere, and these tissues were postfixed in 3% glutaraldehyde and osmium tetroxide, and embedded in araldite. A 1-μm-thick slice stained with toluidine blue was obtained from each block to identify the selected ROI. The ultrathin sections were stained with lead citrate and uranyl acetate and examined with a Philips electron microscope to evaluate the ultrastructure of the normal and abnormal neurons and astrocytes (23).
Statistical Analysis
Data are presented as the mean ± the standard deviation (SD). The parametric variables were analyzed by using one-way analysis of variance (ANOVA), two-way repeated ANOVA, or an unpaired or paired t test. A two-tailed value of P less than .05 was considered to indicate a statistically significant difference.
Results
Physiologic variables such as body temperature, mean arterial blood pressure, pH, PaCO2, and PaO2 were within the normal range throughout the experiment in each group (data not shown).
Cerebral Blood Perfusion
During occlusion, the CBF index in the ipsilateral ROI decreased by approximately 50% (54% ± 6 in group A, 51% ± 5 in group B, and 53% ± 10 in group C) in all animals, compared with the CBF index in the contralateral homologous ROI, indicating successful MCAO. After reperfusion, the CBF index returned to normal (104% ± 13 in group B and 101% ± 10 in group C at 90 minutes after reperfusion), indicating successful reperfusion.
ADC Changes
At the end of 30 minutes after MCAO, ADC values were about 25% lower in the ipsilateral ischemic ROI than in the contralateral nonischemic ROI in all three groups (Figs 1 and 2), and the differences in ADC between the two sides were significant (P < .001). Furthermore, ADC values in the ischemic ROI were almost the same in all three groups: (47.3 ± 6.7) ×10−5 mm2/s in group A, (47.6 ± 3.9) ×10−5 mm2/s in group B, and (45.6 ± 2.0) ×10−5 mm2/s in group C; P > .5, ANOVA. In groups B and C, ADC values returned to normal at the end of 90 minutes of reperfusion (Figs 1 and 2). In group C, ADC values decreased secondarily when DW imaging was repeated at 12 hours after reperfusion (Figs 1 and 2); ADC values at 12 hours after reperfusion were virtually identical to those observed at 30 minutes after occlusion (45.6 ± 2.0) ×10−5 mm2/s vs (47.1 ± 1.2) ×10−5 mm2/s, P > .41.
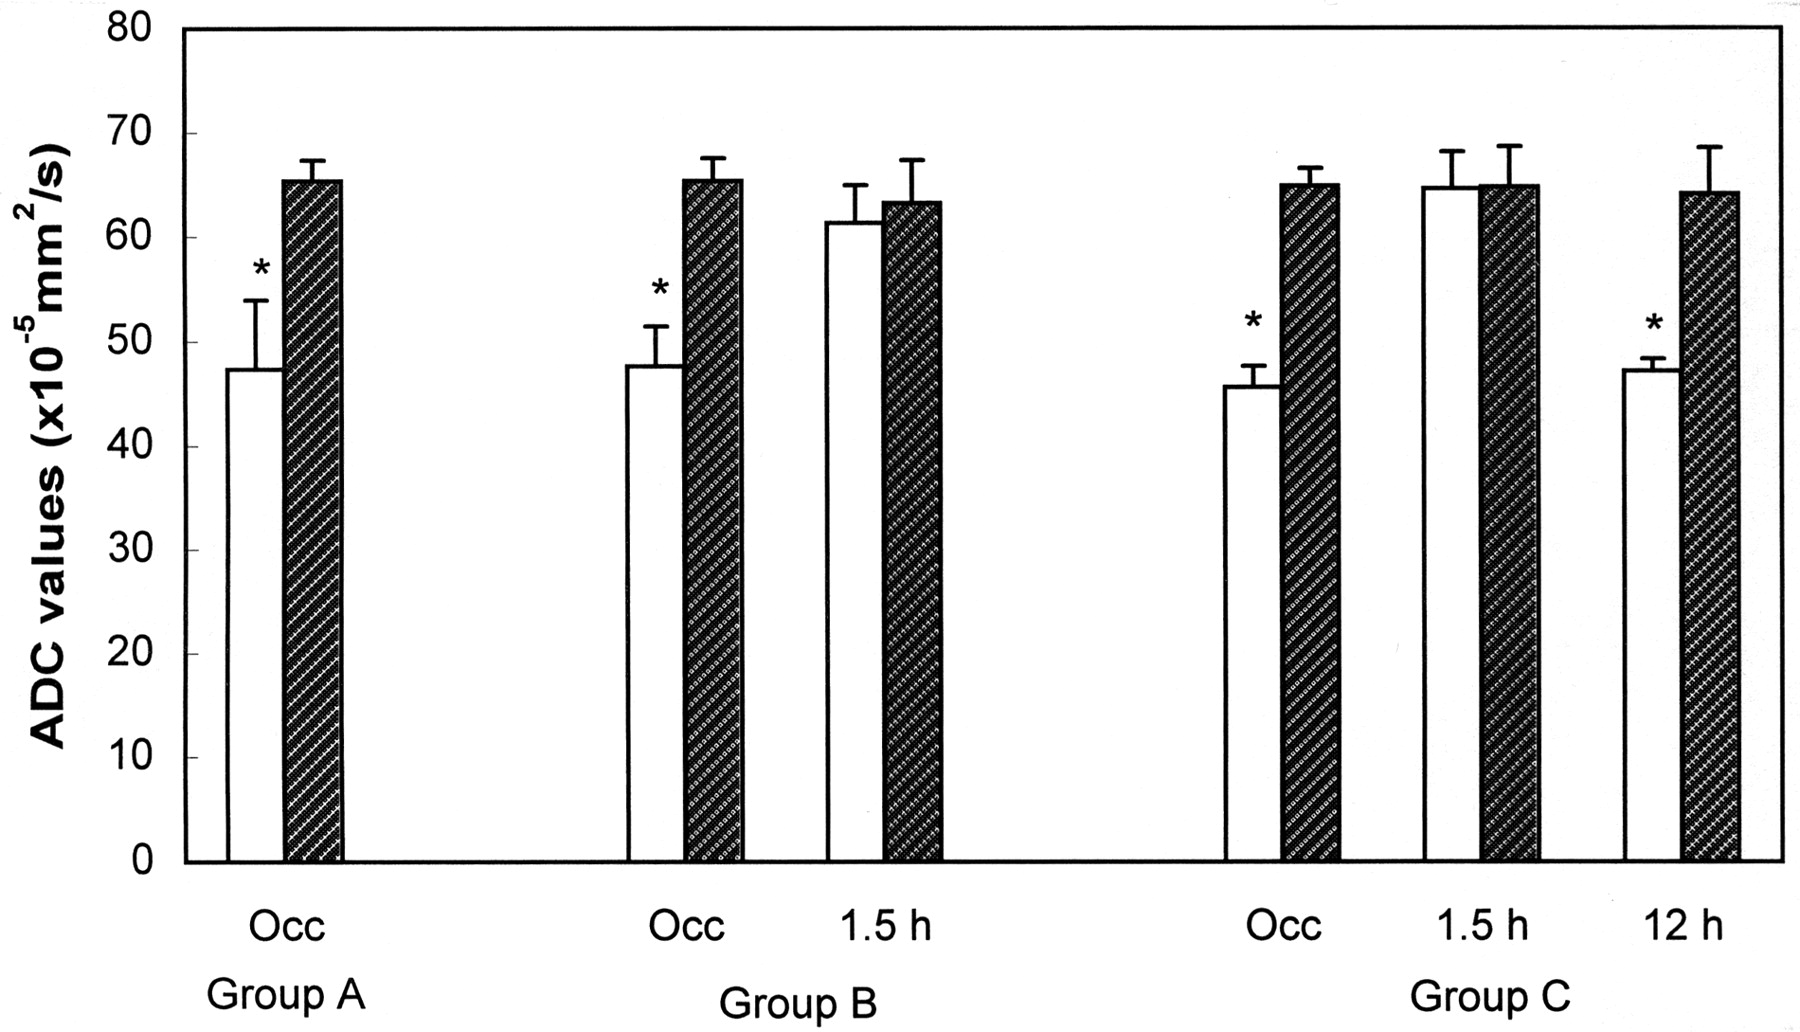
Bar graph shows changes in ADC values over time in the center of the lesion of the ipsilateral caudoputamen (white bars) and the nonischemic homologous region of the contralateral caudoputamen (striped bars). In all groups, ADC values in the ischemic lesion center decreased significantly (* indicates P < .001) during 30 minutes of ischemia, compared with the contralateral hemisphere. In group B, the reduced ADC values during ischemia recovered to normal 90 minutes (1.5 h) after reperfusion. In group C, the previously renormalized ADC values declined secondarily at 12 hours (12 h) after reperfusion. Occ indicates occlusion.
Histologic Outcomes
In the contralateral nonischemic ROI of all groups, no histologic abnormalities except for a few dark neurons were found in all groups (Fig 3A and E).

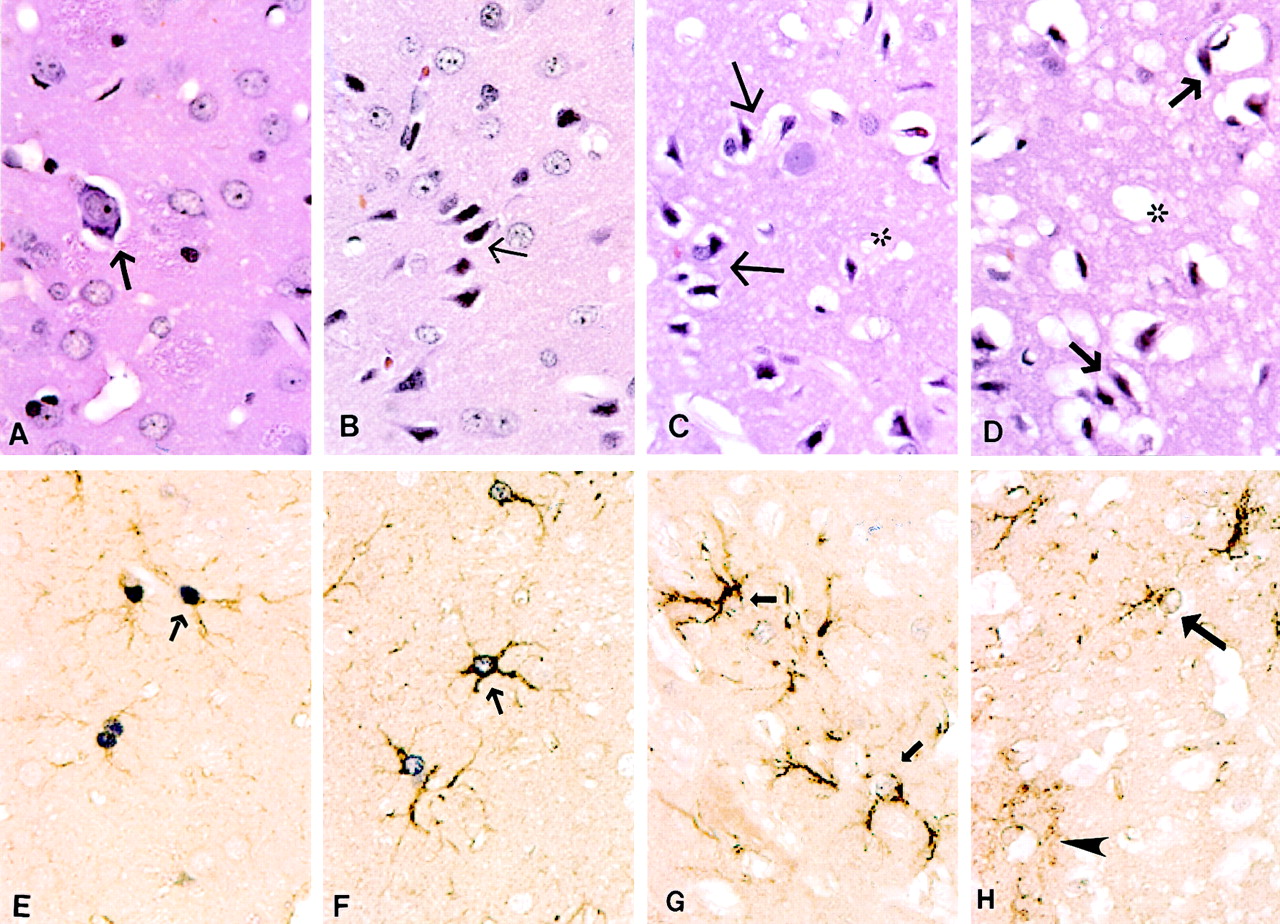
Photomicrographs of neurons and astrocytes (original magnification ×160). A–D, Neuronal morphology indicated by hematoxylin-eosin staining, and E–H, astrocytic changes indicated by double staining with GFAP plus S-100 protein.
A, Many normal neurons and one dark neuron with perineural vacuoles (arrow) are present in the contralateral nonischemic caudoputamen.
B, At the end of 30 minutes of ischemia when ADC had initially decreased, some neurons show slightly shrunken perikarya and nuclei (arrow).
C, After 90 minutes of reperfusion and recovery of ADC to normal, most neurons are moderately shrunken and surrounded by swollen cellular processes and are scalloped in appearance (arrows). Neuropil shows marked vacuolation (∗), indicative of swollen dendrites and astrocytic processes.
D, After 12 hours of reperfusion and a subsequent or second decrease in ADC, most neurons are severely shrunken (arrows), and the neuropil shows extensive vacuolation, and possibly some vasogenic edema (∗).
E, Dark purple reaction product demarcates S-100 protein in astrocytic nuclei; brown reaction product indicates GFAP in the cytoplasm and processes of astrocytes (arrow) in the contralateral nonischemic caudoputamen.
F, At the end of 30 minutes of ischemia, astrocytes are moderately swollen (arrows).
G, After 90 minutes of reperfusion, astrocytes are severely swollen (arrow) with less intranuclear S-100 reactivity and watery appearance.
H, After 12 hours of reperfusion, astrocytes have begun to disintegrate and lose nearly all S-100 immunoreactivity within their nuclei (arrow). At this time, some GFAP has moved into the extracellular space (arrowhead).
In the ischemic ROI of group A, many neurons were slightly shrunken and surrounded by swollen cellular processes (Fig 3B), and the nuclei of the shrunken neurons were often triangular and darkly stained. Some microvacuolation due to dilatation of the endoplasmic reticulum and mitochondria was evident in the cytoplasm of these injured neurons (Fig 4A). At the end of 30 minutes of occlusion, 47% ± 12 of the neurons in the ischemic ROI were shrunken (Fig 5). The nuclei and cytoplasm of astrocytes were moderately swollen in the ischemic ROI at the end of 30 minutes of MCAO (Figs 3F and 4B). The area of GFAP plus S-100 expression (Fig 6) was significantly greater in the ipsilateral ischemic ROI (117 μm2 ± 6) than in the contralateral nonischemic ROI (89 μm2 ± 2, P < .001).

Electron micrographs of neurons (original magnification ×3000) and astrocytes (original magnification ×4500).
A and B, At the end of 30 minutes of ischemia. A, Shrunken neurons (N) with condensed nuclei and cytoplasm are surrounded by a ring of swollen astrocytic processes (a). B, Swollen astrocyte with clumps of heterochromatin around the edge of its nucleus and an abnormally wide rim of watery perikaryal cytoplasm, which contained a few swollen mitochondria (m).
C and D, At the end of 90 minutes of reperfusion. C, Two markedly shrunken neurons with highly condensed nuclei and cytoplasm; these neurons are surrounded by severely swollen astrocytic processes (a). D, Greatly swollen astrocyte with extensive and watery perikaryal cytoplasm and a few contracted mitochondria (m).
E and F, At the end of 12 hours of reperfusion. E, Two necrotic neurons show cytoplasmic and nuclear disintegration with marked chromatin clumping and discontinuous cellular membranes. F, An irreversibly injured astrocyte with breaks in the nuclear membrane (arrows), watery cytoplasm, and severely swollen mitochondria (M).

Bar graph indicates percentage of injured neurons in the ipsilateral ROI in the three groups (mean ± SD). Group A, at end of 30 minutes of MCAO; group B, at 90 minutes of reperfusion after 30 minutes of transient MCAO; and group C, at 12 hours of reperfusion after 30 minutes of transient MCAO.

Bar graph indicates combined area of expression of two astrocytic proteins, GFAP and nuclear S-100, in both ipsilateral and contralateral hemispheres of the three groups (mean ± SD). Group A, at end of 30 minutes of MCAO; group B, at 90 minutes of reperfusion after 30 minutes of transient MCAO; and group C, at 12 hours of reperfusion after 30 minutes of transient MCAO.
In the ischemic ROI of group B where ADC values recovered completely after 90 minutes of reperfusion, neurons were moderately shrunken, scalloped in appearance, and surrounded by swollen cellular processes (Fig 3C). Both the nuclei and cytoplasm were highly condensed (Fig 4C). The percentage of injured neurons was significantly greater after 90 minutes of reperfusion (92% ± 2) than at the end of occlusion (47% ± 12, P < .001). Both the nuclei and cytoplasm of most astrocytes were markedly swollen and highly electron-lucent (Figs 3F and 4D), and vacuolation of the neuropil, indicative of swelling of dendrites and astrocytic processes, was evident (Fig 3C). In this group, the area of GFAP plus S-100 expression (Fig 6) was significantly greater in the ipsilateral ischemic ROI (123 μm2 ± 8) than in the contralateral nonischemic ROI (85 μm2 ± 4, P < .001).
In the ischemic ROI of group C where secondary ADC decreases occurred, most neurons were markedly shrunken, and some had pyknotic nuclei and eosinophilic cytoplasm (Fig 3D), both signs of irreversible injury. In support of this contention and further indicative of necrosis, many neurons had fragmented nuclei, ruptured nuclear membranes, dense organelles, and patches of homogeneous electron-dense material in the cytoplasm (Fig 4E). The percentage of injured neurons in this group (94% ± 3) was not different from that in group B (92% ± 2, P = .2) (Fig 5), but the qualitative degree of cellular injury was much greater in group C than in group B. The number of astrocytes staining positive for GFAP and S-100 was significantly lower (P < .03) after 12 hours of reperfusion (2.2 ± 1.5 per microscopic field) than after 1.5 hours of reperfusion (6.5 ± 1.5 per microscopic field). Within the neuropil, there were many large vacuoles (Fig 3D), in this instance possibly the result of both cytoxic and vasogenic edema. In a few residual astrocytes, cytoplasmic GFAP had disintegrated, and nuclear S-100 protein was greatly reduced (Fig 3H). Electron microscopy showed gaps in the nuclear membranes of these disintegrated astrocytes (Fig 4F), indicating that they were irreversibly injured. In this group, the area of GFAP plus S-100 expression was significantly less in the ipsilateral ischemic ROI (78 μm2 ± 4) than in the contralateral nonischemic ROI (90 μm2 ± 5, P < .001) (Fig 6).
Discussion
In the present study, two structural features or end points were quantified and assumed to be good indicators of cellular status. First, the percentage of injured neurons that were shrunken and/or necrotic was taken as a marker of neuronal damage. This is a standard index of neuronal injury during and after cerebral ischemia (21–23), and its employment is straightforward. Second, the combined area of expression of two astrocytic proteins—GFAP within the perikaryon and cellular processes and S-100 within the nucleus—was taken as an index of astrocytic size. GFAP and S-100 are well-known astrocytic markers (24, 25) and have been used to investigate astrocytic changes after ischemia (26–28). In the shorter time groups (groups A and B) of the present study, increase of the GFAP and S-100 positive area most likely reflects swelling of the soma and processes of astrocytes as suggested by the electron-lucent appearance within astrocytes and by one previous study (29). After 12 hours of reperfusion (group C), however, GFAP had begun to breakdown in the ischemic ROI, and the area of expression had decreased, indicating disintegration of astrocytes. Further electron microscopic study demonstrated extensive vacuolation of the neuropil (representing swelling of astrocytic processes and/or dendrites) and gaps in the nuclear membranes of these disintegrated astrocytes, suggesting that many astrocytes were irreversibly injured, either dying or already dead.
Considering these observations, the present findings demonstrate three major points. First, neuronal shrinkage and astrocytic swelling were seen in the region where ADC declined during the first 30 minutes of ischemia. Second, acute ADC renormalization after reperfusion was not associated with reversal of these structural abnormalities. Third, these and other morphologic features showed more severe structural disturbances and death of neurons and astrocytes when ADC decreased for the second time. These results imply that the morphologic changes of astrocytes and neurons associated with decreases in ADC during ischemia do not reverse and worsen over time even though ADC values recover after 30 minutes of temporary focal brain ischemia.
Acute ADC Decreases and Morphologic Changes
DW imaging is a highly sensitive modality for detection of early focal brain ischemia (30). Since the early DW imaging hyperintensity (ADC decrease) was found to be associated with eventual infarction at a delayed time point, such an early ADC decrease is likely to be an in vivo sign of ischemic brain injury at least in the center of ischemia after 30 minutes of focal brain ischemia, as demonstrated by a previous study (12). It is not clear, however, what acute morphologic changes are related to the lower ADC at the time of its measurement. The histopathologic features appearing during the acute phase of ischemia include both shrinkage and swelling of the neuronal soma, as well as swelling of astrocytes and dendrites (31, 32). Some investigators have suggested that water movement from the extracellular to intracellular space (cytotoxic edema) causes ADC to decrease (1–5). In the current study, when histologic evaluation was performed on brain tissues fixed immediately after DW imaging, the areas with ADC decreases at 30 minutes after ischemia manifested neuronal shrinkage and astrocytic swelling. The possible role of neuronal shrinkage in the decrease of ADC has been, in general, overlooked. Although unclear in detail, the current findings suggest that the early ADC decrease after arterial occlusion is a complex function of water flow not only between the extracellular and intracellular spaces, but also among the different cellular compartments of neurons and glia.
Acute ADC Renormalization and Cellular Injury
Acute reversal of ADC following rapid restoration of blood flow and the subsequent or secondary decrease in ADC have been reported similarly by us and by other groups as well (10–16). It is fairly clear that the secondary reduction in ADC is associated with delayed neuronal death after a short period of focal brain ischemia (9, 12–14). With a cerebral ischemia-hypoxia model, Miyasaka et al (33) recently demonstrated that acute renormalization of ADC is not associated with normal brain histology. To our knowledge, however, whether reperfusion-induced renormalization of ADC after transient focal brain ischemia indicates reversal of histologic changes that occur during ischemia has not been demonstrated. Furthermore, it is not known whether delayed neuronal death is truly a secondary event or just a slow continuation of the initial changes. Presumably, ADC renormalization should indicate resolution of cellular swelling, if cellular swelling is the only reason for the decrease in ADC values. Surprisingly, the present study demonstrates that ADC renormalization after reperfusion is not associated with restoration of astrocytic size and neuronal structure. Indeed, with renormalization of ADC, not only were many neurons and astrocytes morphologically abnormal in the regions, but also the number of injured neurons and the amount of astrocytic swelling became greater. Our findings in the present study are consistent with those of a recent study (33) in which an ischemia-hypoxia model was used. Those results suggest that ADC reduction during ischemia is likely related to more than just cytotoxic edema.
Recent studies (34, 35) have shown that a reduction of energy-dependent cytoplasmic motion after ischemia is likely an important factor for ischemia-related ADC decreases. Restoration of energy production is able to restore cytoplasmic movement, thus renormalizing ADC values. Using phosphorus MR spectroscopy, Lorek et al (36) and Blumberg et al (37) demonstrated in transient hypoxia-ischemia models that energy metabolism can recover to normal after initial declines, and such energy restoration was associated with ADC renormalization (38). We therefore assume the reperfusion-induced ADC renormalization in the present study is likely due to energy recovery. However, such an explanation contradicts the finding in a previous study (39) in which there was still decreased metabolite diffusion in the intracellular environment early after reperfusion, although water ADC recovered completely. Moreover, further study will be needed to demonstrate if morphologically abnormal neurons and astrocytes are able to restore energy production when blood flow is restored.
Another important finding in this study is that delayed neuronal damage associated with secondary ADC deceases demonstrated in previous studies (9, 12–14) is likely a slow continuation of initial ischemic injury rather than a true secondary injury, since the morphologic abnormalities measured at the end of 30 minutes of focal ischemia did not return to normal after reperfusion. Although this postulation may hold for the ischemic core following 30 minutes of unilateral MCAO in Sprague-Dawley rats, it does not rule out the possibility that injury is reversible in the areas of less severe ischemia in this model or in other models of ischemia.
Histopathologic Features of Secondary ADC Decreases
The findings herein show that the initial and secondary ADC decreases, although similar in severity, have different histopathologic features. During the initial decrease in ADC, neurons were slightly shrunken and surrounded by swollen cellular processes. After 12 hours of reperfusion and with secondary ADC decrease, cellular injury was more severe—neurons had become necrotic, and astrocytes disintegrated and decreased in number. We recently demonstrated that the extent of neuronal damage correlates with the severity of initial ADC reduction (9, 40) and now report that the initial and secondary ADC decreases have different histologic features. Because the secondary decrease is probably indicative of untreatable injury, distinguishing the initial from the secondary ADC decrease may be of clinical importance.
Conclusion
In summary, it has been shown for this model of reversible focal ischemia that the initial decrease in ADC is accompanied by neuronal shrinkage and astrocytic swelling and that acute renormalization of ADC values after reperfusion does not indicate reversal of these cellular abnormalities. Indeed, despite the rapid restoration of CBF and renormalization of ADC, the state of astrocytes and neurons worsens over time.
Acknowledgments
We thank Dr Turgut Tatlisumak for his valuable comments.
Footnotes
F.L. supported in part by a Research Fellowship Award from the National Stroke Association.
Presented in part at the 39th annual meeting of the American Society of Neuroradiology, April 2001, Boston, MA.
References
- Received April 17, 2001.
- Accepted after revision October 24, 2001.
- Copyright © American Society of Neuroradiology
In this issue


Jump to section
Related Articles
Cited By...
- The Effect of Age and Cerebral Ischemia on Diffusion-Weighted Proton MR Spectroscopy of the Human Brain
- Correlation between CT and Diffusion-Weighted Imaging of Acute Cerebral Ischemia in a Rat Model
- Neurite beading is sufficient to decrease the apparent diffusion coefficient after ischemic stroke
- Modest MRI Signal Intensity Changes Precede Delayed Cortical Necrosis After Transient Focal Ischemia in the Rat
- Editorial Comment--ADC and Metabolites in Stroke: Even More Confusion About Diffusion?
- Guidelines and Recommendations for Perfusion Imaging in Cerebral Ischemia: A Scientific Statement for Healthcare Professionals by the Writing Group on Perfusion Imaging, From the Council on Cardiovascular Radiology of the American Heart Association