
Abstract
BACKGROUND AND PURPOSE: Patients with cerebrovascular occlusive disease may develop compensatory changes in local cerebral vasculature with a resultant loss of vascular reactivity. These alterations can affect the blood oxygen level-dependent (BOLD) signal that is the basis for functional MR imaging. We investigated the BOLD signal in patients with unilateral cerebrovascular disease to ascertain the clinical utility of functional MR imaging in these patients.
METHODS: Five healthy volunteers and three patients with cerebro-occlusive disease were imaged with both a block and an event-related design of a visually cued bilateral motor task. Activation maps were calculated, and individual hemodynamic response curves were generated for left and right primary motor cortices. Vascular reserve was determined for the relevant vascular territory by using transcranial Doppler ultrasonography (US).
RESULTS: In the event-related data, the amplitude of the BOLD response was significantly decreased in the motor cortex ipsilateral to the stenosis and showed significant delays in the timing of the hemodynamic response. In contrast, the longer duration stimulus and longer TR of the block design showed significant decreases in the BOLD amplitude but no significant interhemispheric temporal differences. Corroborating the hemodynamic status, transcranial Doppler US analysis showed diminished vascular reserve ipsilateral to the lesion.
CONCLUSION: Differences in the results between the event-related and block paradigms reflect the sensitivity to alterations in autoregulation or vascular compliance. These changes in the vasculature directly affect the BOLD contrast underlying functional MR imaging. Thus, while this technique remains a useful clinical tool, caution is warranted when studying patients with cerebrovascular disease.
Because cerebrovascular disease is among the leading causes of death in the United States, noninvasive assessment of vascular status is of great clinical relevance. The advent and use of MR imaging has improved the study of vascular anatomy (1), vascular velocities (2), and cerebral blood flow and volume (3). Imaging techniques such as positron emission tomography and functional MR imaging exploit the blood flow changes that accompany neuronal activity in normal brain and potentially in disease states. Owing to its noninvasive nature, functional MR imaging, which uses blood oxygen level-dependent (BOLD) imaging (4–6), has been used extensively in all facets of human brain mapping (5, 7, 8) and holds great potential for evaluation of cerebrovascular disease.
Whereas some forms of MR imaging measure physiology directly, the functional MR imaging signal is sensitive to the complex interaction of cerebral blood flow, cerebral metabolic rate of oxygen consumption (CMRO2), and cerebral blood volume (9). In response to a stimulus, a transient uncoupling of flow and oxygen metabolism may occur such that cerebral blood flow changes more than CMRO2, creating localized increases in tissue oxygen concentration (10). Not all models support this hypothesis, however, and other factors may contribute to the signal changes seen (11–13). Current functional MR imaging methods measure localized changes in tissue oxygen content by alterations in the local magnetic field owing to the different magnetic properties of oxygenated (diamagnetic) and deoxygenated (paramagnetic) blood. Because of the complex origins of the BOLD signal, obtaining reliable results in elderly subjects or those with vascular disease may be difficult. In fact, results from recent prospective MR imaging studies on aging suggest that the BOLD signal response changes as a function of age; this is due to increased vascular tortuosity resulting in differences in the spatial properties of the vascular bed (14, 15). This may be an important consideration in imaging of cerebrovascular disease because of the advanced age of most of these patients.
A link may also exist between the vascular abnormality in cerebrovascular diseases (eg, thickening of the vascular basement membrane, thinning of the endothelium, or plaque formation) and subsequent changes in vascular reactivity (16). If vasoreactivity is lost in functioning brain tissue, the vascular bed is unable to respond to neuronal activity with a corresponding increase in blood flow or blood volume. Consequently, these compromised areas may not show statistically significant changes in the BOLD functional MR imaging signal; this may lead to false-negative results. Alternatively, compensatory collateral blood flow may complicate matters, leading to potential false-positive results. For example, the longitudinal assessment with functional MR imaging of subjects with a compromised vascular bed after a stroke may not measure recovery of neuronal activity, as is often assumed, but the return of normal blood flow.
The purpose of this study was to investigate the changes in the nature and timing of the BOLD signal that occur when imaging patients with significant cerebrovascular disease and to assess the implications of these changes for functional MR imaging.
Methods
Participants
Three patients (two men, one woman; age range 55–74 years [mean, 63 years]) with greater than 60% unilateral stenosis of either the internal carotid artery (n=2) or middle cerebral artery (n=1) were evaluated in this study. As control subjects, five healthy right-handed volunteers (three men, two women; age range 20–35 years [mean, 25.5 years]) with no history of cerebrovascular disease were recruited for the MR imaging portion of the protocol. For each subject, informed consent was obtained for participation in the study, in keeping with the guidelines approved by our institutional review board. The study was conducted over 9 months, and data analysis and preparation over 2 months.
The initial screening of the patients included transcranial Doppler ultrasonography (US) to determine vascular reserve status, contrast-enhanced MR angiography to establish vascular anatomy, and diagnostic MR imaging to ascertain possible areas of ischemia or infarction. All healthy control subjects and the patients completed the MR-based perfusion acquisition to establish areas of poor perfusion and underwent functional MR imaging to assess the hemodynamic response function to a stimulus.
Transcranial Doppler Ultrasonography
Transcranial Doppler US was used to measure middle cerebral artery velocities through a transtemporal window, according to standard criteria. Arterial blood pressure was measured noninvasively over one radial artery by a continuous tonometric blood pressure monitor (N-Cat N-500; Nell Corp, Hayward, CA). The physiologic data were simultaneously recorded by using the Multidop X transcranial Doppler device (DWL Corp, Sipplingen, Germany).
The degree of vascular reserve was determined by one of two methods. The first method (n=1) measured dynamic autoregulation in the middle cerebral artery territory in response to a systemic drop in blood pressure after the release of thigh blood pressure cuffs, which were inflated to 20–40 mm Hg above the systolic blood pressure for 3 minutes (17). Rapid release of the cuffs caused a sharp but moderate transient decrease in systemic blood pressure. Mean decreases in arterial blood pressure of more than 10 mm Hg were considered a sufficient autoregulatory stimulus. In each subject, the test was repeated three times, and the responses were averaged to determine the final dynamic autoregulatory response for each middle cerebral artery perfusion territory. The velocity response, which measures both latency and efficiency, was fit by using software built into the Multidop X device and assigned an autoregulatory index between 0 and 9, where an autoregulatory index greater than 4 is considered a normal response (18). The second method (n=2) measured the change in cerebral blood flow velocity in the middle cerebral arteries after administration of 1 g of acetazolamide (Diamox; Wyeth, Collegeville, PA) to evaluate hemodynamic reserve capacity (18). An increase in velocity of greater than 40% of baseline was considered normal.
Arterial Spin Labeling
To measure the resting state perfusion level, we used a pulsed arterial spin labeling sequence called quantitative imaging of perfusion with a single subtraction, version II, or QUIPSSII (19, 20). This method tags the arterial blood with an inversion pulse and allows the tagged blood to arrive and mix with the section of interest, at which time the image is formed. The acquired image is interleaved with a control image where no inversion tag has been applied. By subtracting the perfusion-weighted image from the control image, a measurement proportional to local perfusion can be obtained (19, 20). The signal-to-noise ratio was improved by averaging this signal over 3 minutes, which removed the influence of cardiac pulsation, respiration, and any low frequency drift in the MR signal. The perfusion data were acquired while the subject was at rest with eyes closed. Analysis of the data required the investigator to define a region of interest (ROI) located in the left and right motor cortices. Anatomic data were used to localize the ROIs for the perfusion analysis. In the healthy subjects, the perfusion measurement in the left hemisphere was reported as a percentage of the right hemisphere; in the patients, the perfusion measurement of the hemisphere ipsilateral to the lesion was reported as a percentage of the normal hemisphere.
Functional MR Imaging
Functional MR imaging was performed to define the location of the motor cortex to observe any changes in activation patterns and to investigate BOLD time course changes due to the blood flow effects of a stenosed internal carotid artery or middle cerebral artery. Before entering the imaging unit, the subject was trained on two functional paradigms: an event-related, visually cued bilateral motor task and a block-design bilateral motor task. All functional data were acquired by using BOLD imaging (single-shot gradient echo-planar imaging) on either a 1.5-T Vision (Siemens Medical Solutions AG, Erlangen, Germany) or Sonata imager (Siemens). With use of a sagittal scout image for positioning, the sections were acquired obliquely to provide data from primary motor cortex and primary visual cortex. A high-spatial-resolution, T1-weighted, 3D anatomic data set was obtained for each subject. A 3D fast low-angle shot, or FLASH, acquisition with identical orientation to that of the functional dataset was used with the following parameters: 15/5.6 (TR/TE), 20° flip angle, matrix of 256 × 256, field of view of 240 mm with 0.9375 × 0.9375-mm in-plane resolution, and 160 1-mm sections. Head movement was minimized with the use of restraint calipers built into the head coil and a foam vacuum pillow (Vac-Fix; Bionix, Toledo, OH) that was placed within the head coil and fitted to the subject’s head. These devices help to keep movement minimized to less than 0.5 mm during each functional run (21). The head coil was outfitted with a mirror system to enable visualization of the stimuli. In the healthy subjects and in one patient, stimuli were displayed by means of a liquid crystal display projector onto a rear projection screen. In two patients, MR-compatible liquid crystal display goggles (Avotec, Jensen Beach, FL) were used to deliver the stimulus. In all subjects, MR-compatible headphones (Avotec) were used to reduce the noise and to communicate with all the subjects.
The event-related design consisted of a long intertrial interval of 30 seconds, using a brief 2.5-second stimulus period. This design allowed for the investigation of the hemodynamic response subsequent to neuronal activity. During the rest period of the trial, the subject fixated on a cross in the middle of the visual field. This long period of rest allowed the MR signal to return to baseline before the next activation period. The stimulus for the visually cued motor task consisted of an 8-Hz, flashing, black and white checkerboard (6 squares × 6 squares), during which the subject was instructed to perform a complex bilateral hand movement. This task required the subject to sequentially oppose the thumb with the index finger followed by the ring finger, the middle finger, and finally the little finger. The subject was instructed to repeat this movement throughout the duration of the flashing checkerboard and stop moving during the fixation period. Every subject was observed to verify that they performed the task correctly. The acquisition parameters of the visually cued motor task were six 6-mm sections with a 3-mm gap, 240-mm field of view with 3.75 × 3.75-mm in-plane resolution, 64 × 64 matrix, 500/40, 58° flip angle, and 10 trials. Sections were oriented in an oblique plane that intersected the motor and visual cortices.
The block design consisted of a 30-second stimulus period with a green box serving as a cue for the subject to perform the aforementioned complex finger movements and a 30-second period of rest cued by a red box. The active-rest block was repeated four times. The acquisition parameters for the block-design bilateral motor task were 32 4-mm sections with no gap, 240-mm field of view with 3.75 × 3.75-mm in-plane resolution, 64 × 64 matrix, 3.0/40, and 90° flip angle. The sections for the block experiment were in the same plane as the event-related experiment. No differences in the performance of the paradigms were observed.
Analysis
Image data were transferred to a Dell Windows NT workstation where analysis for both the block and event-related paradigms was performed with use of BrainVoyager version 4.0 software (Brain Innovation, Maastricht, the Netherlands), which included section timing correction, 3D motion correction, spatial smoothing of 5 mm, and temporal smoothing of two TRs (1 second for the event-related paradigm and 6 seconds for the block paradigm). Functional activation maps were calculated by using linear correlation with a modeled hemodynamic response for both the block and event-related paradigms. A correlation threshold of r greater than 0.45 was used for the block design and an r greater than 0.3 was used for the event-related design, based on a priori information about the expected areas of activation (motor cortex, supplemental motor cortex, and visual cortex). Using a limited search area allows one to use a less stringent statistical threshold because of the reduced number of multiple comparisons. With use of the Fisher transformation to convert the correlation coefficient, r, to a Z score, an “n” of 80 and an r of 0.45 is equivalent to a Z score of 4.25, and an r of 0.3 with “n” of 600 is equivalent to a Z score of 7.56 (22). The hemodynamic response function and curve parameters (rise and fall slope, magnitude, time to peak, initial dip, and poststimulus undershoot) were generated for left and right primary motor cortex and primary visual cortex. These curves were generated by locating anatomically driven ROIs on the functional maps and then generating the time course data for five individual voxels within each ROI. The data from the voxels were averaged to form an average hemodynamic response function for that particular anatomic ROI. t statistics were derived from the original data sets to evaluate curve parameters with significance levels set at P less than .01.
Results
Initial transcranial Doppler US measurements without challenge were used to establish baseline blood flow velocities in the relevant vascular territories. Subsequently, hemodynamic reserve was assessed by dynamic autoregulation or acetazolamide administration. Contralateral to the occlusive disease, hemodynamic reserve was in the normal range. However, in the ipsilateral middle cerebral artery territory, vascular reactivity was significantly blunted in all patients with cerebrovascular disease. In the Table, the results of the transcranial Doppler US experiment are reported relative to baseline. A response was considered normal if a greater than 40% velocity existed after administration of acetazolamide or an autoregulatory index greater than 4.
Population and experimental data
A consequence of this deranged blood flow physiology was visualized on the arterial spin labeled images. The resting state perfusion images from the three patients showed decreased blood flow in the hemisphere ipsilateral to the stenosis denoted by decreased signal levels compared with the contralateral hemisphere. In the Table, perfusion deficit as detected with arterial spin labeling is reported as a percentage of the normal hemisphere. The data for the control subjects was arbitrarily presented as a percentage of the right hemisphere.
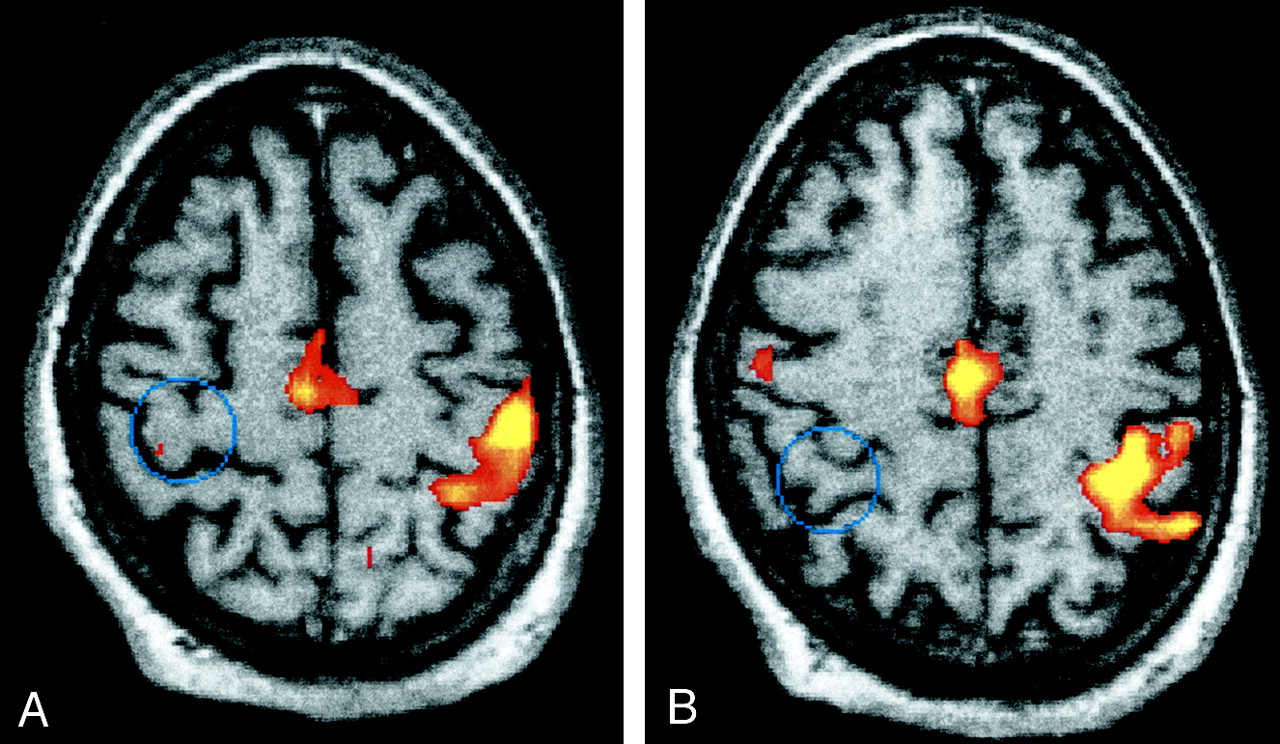
Functional MR imaging maps for both the event-related and block paradigms for a single patient (patient 1) with an acute right internal carotid artery occlusion are shown in Figures 1 and 2, respectively, using identical section locations. BOLD functional MR images for the event-related experiment showed robust activation in the visual cortex and the motor cortex contralateral to the stenosis in each patient, consistent with the normal blood flow in this region. However, the motor cortex ipsilateral to the lesion showed severely diminished or missing activation in all of the patients (Table). Hemodynamic response curves derived from both experimental paradigms for the same patient in Figures 1 and 2 are shown in Figure 3. The extent, amplitude, and time-to-peak parameters are shown in the Table for both the event-related and block experiments. Data are shown for all patients separately and for the control subjects as a group. In the Table, the extent of the functional map for both block and event-related experiments was evaluated qualitatively.

A and B, Functional maps generated from the event-related, visually cued bilateral motor task for a patient with occlusion of the right internal carotid artery. Two axial images are shown with a cross-correlation threshold of r > 0.3. Note that the motor cortex ipsilateral to the lesion (right side) shows minimal or absent activation as a result of the occluded right internal carotid artery (blue circle), a finding corroborated by the blood flow velocity results of the transcranial Doppler US examination.

A and B, Functional maps generated from the block motor task for a right internal carotid artery occlusion (same patients as in Figure 1). Two axial images are shown at the same anatomic level as that obtained for the event-related maps in Figure 1, but with a cross-correlation threshold of r > 0.45. Note the strong bilateral activation in the motor cortex.

The BOLD signal time courses for a representative patient with an occlusion of the right internal carotid artery (same patients as in Figures 1 and 2). Event-related paradigm curves show the hemodynamic response functions for the right motor cortex (black curve) and left motor cortex (gray curve). The black box denotes the timing of the stimulus (Stim). A decrease in amplitude and delay in onset of the hemodynamic response function exists in the hemisphere ipsilateral to the occlusion (black curve).
In the event-related experiments, the amplitude of the BOLD response was significantly greater in the primary motor cortex contralateral to the abnormality when compared with the side of the stenosis (Table, Fig 3). No differences were found in the control subject data. In all control subjects and patients, the rise and fall slopes of the hemodynamic response function were similar across motor cortices when the time courses were normalized to peak amplitude. However, the hemodynamic response function for patients showed marked differences in the timing of the hemodynamic response, with the affected hemisphere showing significant delay in the time-to-peak signal of the hemodynamic response function (Table). In contrast, functional maps generated from the block design experiment showed strong bilateral activation in the motor cortex in all subjects. The BOLD signal time courses derived from the block paradigm experiments were closely matched to each other and the modeled hemodynamic response. A statistically significant difference in the amplitude of the BOLD response existed in the contralateral (larger) hemisphere compared with that in the ipsilateral hemisphere (Table). However, this difference was not reflected in the activation maps, where no differences were observed.
Discussion
The signal change in BOLD functional MR imaging is due to local changes in blood flow, blood volume, and oxygen consumption, all of which affect the oxygen concentration in the capillaries, venules, and arterioles. Histologic studies of the cerebral microvasculature have showed considerable age- and disease-related variability in the organization of intracerebral arterioles, capillaries, and venules. For example, Fang (23) observed age-related increases in the winding, coiling, and number of “blind-ends” in the cerebral vascular microlattice, most significantly in the arteriole-capillary-venous bed. Because BOLD functional MR imaging is sensitive to contributions from the vascular bed (24), changes in this vasculature could conceivably produce characteristic temporal and spatial differences in BOLD functional MR imaging time course. The functional MR imaging results obtained in this study indicate a possible change in vessel properties and responsiveness in regions distal to significant vascular disease. In regions of poor perfusion pressure, arterioles are dilated and thus resistance is low; this results in impaired reactivity in these territories as measured by transcranial Doppler US and an increase in cerebral blood volume. BOLD contrast is also partially derived from the ability of relevant vessels to dilate in response to demands for oxygen. The inability to detect the BOLD signal change in the affected motor cortex by using the event-related paradigm may be explained by the possible structural and physiologic changes in the vasculature that alter its ability to adapt to local demands.
Vascular reserve capacity reflects changes in blood flow response to blood pressure alterations, carbon dioxide, neuronal activity, or exogenous agents. The response of cerebral blood flow to pharmacologic agents, such as acetazolamide, has been used to measure this reserve in concert with transcranial Doppler US, single photon emission CT, or xenon-enhanced CT (25). Typically, the middle cerebral artery velocity increases over 40% above baseline in response to a vasodilator such as acetazolamide. Alternatively, autoregulation, the ability to respond to a decrease in perfusion pressure, may be tested with transcranial Doppler US, using brief systemic hypotension. In all of our patients, the vascular reserve ipsilateral to the diseased vessel was markedly diminished. A poor blood flow response to a pharmacologic challenge correlates with inadequate collateral supply (26). Although local baseline cerebral blood flow may be maintained by maximal vasodilation, the compensatory mechanisms allowing adaptation to stresses such as arterial blood pressure change or pharmacologic manipulation may be exhausted. Thus, baseline blood flow studies are not indicative of hemodynamic compromise; a “stress” must be induced to accurately determine vascular reserve capacity. Our transcranial Doppler US and MR-based arterial spin labeling results document the decreased vascular reserve in territories distal to severely diseased vessels.
In the past, MR imaging techniques based on BOLD signal have been performed with a block paradigm. Recently, event-related functional MR imaging was developed to probe the transient hemodynamic response to a short stimulus (26–30). This long-trial-brief-stimulus design has the potential to examine the autoregulatory processes, such as collateral recruitment. Furthermore, because of the long-trial design, the hemodynamic response function is allowed to return to baseline, affording better detection of an altered response. As event-related functional MR imaging has evolved, the overlapping short-trial method has emerged as the experiment of choice because of the flexibility of the design. The analysis typically uses deconvolution of a modeled hemodynamic response function to remove the overlapping portions of the response (31). The disadvantage of this method is when the modeled response differs from the actual response. In healthy subjects, this effect is assumed to be negligible. However, in the population of patients studied herein, the effect is quite profound. It is not clear that current acquisition and analysis methods could overcome such an error. An alternate approach may use data analysis methods that are “model-free,” such as independent component analysis, singular value decomposition, or fuzzy clustering. However, these methods are usually sensitive to noise, which may preclude them from being used as the main method of analysis. Also, because these models are unstructured, they may focus on prominent aspects of noise and miss the small signal changes related to neuronal activity.
When a person performs a voluntary motor task, the relevant motor pathways are activated, including the motor cortex. Brain activation studies investigating handedness show differences between right- and left-handed subjects. Previous studies have shown that the left hemisphere had ipsilateral activation in both left- and right-handed subjects (32); the nondominant hand had more ipsilateral activation than that of the dominant hand (33); left-handers showed larger and more bilateral activations compared with right-handers during sequential movement (34); and the contralateral hemisphere of the dominant hand has greater activation (35). The handedness issue may explain some of the BOLD activation differences (magnitude and extent but not delay) seen in the bilateral complex finger-movement task used in this study, but the evidence of perfusion deficit (transcranial Doppler US and arterial spin labeling) points to vascular origins.
Neuronal activation creates a localized increase in demand for oxygen in relevant brain territories. Localized increases in oxygen demand due to any cause are compensated for by vasodilatation until no further dilatation is possible. At this stage, termed “misery perfusion,” the tissue extracts an increased amount of oxygen from the blood to meet its metabolic needs (36). In cerebrovascular disease, there may not be adequate reserve with which to respond to a stimulus, such as cortical activation. In this situation, the standard BOLD contrast of functional MR imaging cannot develop. As vessels may already be maximally dilated in states of hemodynamic compromise, increasing reliance on compensatory collateral recruitment can occur. Block experimental designs typically (but not a requirement) possess a long TR (> 3 seconds), which precludes probing of transient hemodynamic responses due to such recruitment. Using a short TR for a block design may allow one to visualize the transient signal change due to the stimulation onset but would not effect the activation map, since the transient period is short compared with the block duration. Thus, long-trial event-related paradigms may facilitate examination of the local blood flow response and collateral recruitment due to the short stimulus periods and long intertrial period. Alternatively, the delay in the hemodynamic response function in the event-related experiment could also be attributed to a “sluggish” vasodilatory response of the local vessels, as the vascular reserve capacity was diminished but not entirely absent. With the method used in this study, it is not possible to separate these two mechanisms.
Patients with an occlusion or a high-grade stenosis in one of the internal carotid arteries may undergo compensatory changes in local cerebrovasculature, resulting in a loss of autoregulation and subsequent alterations in the BOLD signal time course. Differences in the functional maps and time courses between the event-related and block paradigms described in this report may reflect disparity in the ability to resolve the temporal dynamics in the hemodynamic response function or in the ability of the neurovasculature to recruit collateral vessels as a function of stimulus duration.
The vascular disease inherent to our patient population may have curtailed the increase in blood flow to the expected area of activation that normally occurs subsequent to motor activity. A lack of increased blood flow to the expected area of activation would significantly limit the ability of BOLD functional MR imaging to detect activation. Cerebral blood flow may also be decreased due to lowered metabolic demand if tissue infarction has occurred. This was ruled out in our patient population with the performance of a standard brain examination. The concomitant decrease in amplitude and delay of peak BOLD signal shown for the event-related protocol, not seen for the sustained activation block design, may reflect these important intrasubject hemodynamic changes due to cerebrovascular disease, altering the utility of functional MR imaging in evaluating these patients.
Conclusion
Functional MR imaging remains a useful tool in the assessment of neuronal activity, but its results should be approached with caution when evaluating patients with altered hemodynamics. However, this report raises a number of fundamental questions regarding the utility of BOLD functional MR imaging in patients with cerebrovascular disease. Our findings may be attributed to permutations in vascular architecture, to neuronal and vascular recruitment, and perhaps to changes in the coupling of neuronal activity, blood flow, and blood volume. Because of the altered hemodynamics and its affect on the hemodynamic response function, the use of event-related experiments with fast overlapping trials should be approached with extreme care. Furthermore, longitudinal studies in populations suspected of cerebrovascular disease need to be cautious in the interpretation of the changes in the BOLD signal. Future studies will delineate a more complete understanding of these relationships and the underlying physiology of the BOLD signal to improve the utility of functional brain mapping for patients with cerebrovascular disease.
Footnotes
Presented in part at the 39th annual meeting of the American Society of Neuroradiology, Boston, April 2001.
References
- Received October 26, 2001.
- Accepted after revision February 19, 2002.
- Copyright © American Society of Neuroradiology
In this issue


Jump to section
Related Articles
Cited By...
- Exploring the neuronal and systemic physiological contributions to spontaneous cerebral fluctuations - Insights from functional MRI in The Maastricht Study
- Specificity of Quantitative Functional Brain Mapping with Arterial Spin-Labeling for Preoperative Assessment
- Measuring functional connectivity in stroke - approaches and considerations
- Functional MR Imaging in Patients with Carotid Artery Stenosis before and after Revascularization
- Unilateral Hemispheric Proliferation of Ivy Sign on Fluid-Attenuated Inversion Recovery Images in Moyamoya Disease Correlates Highly with Ipsilateral Hemispheric Decrease of Cerebrovascular Reserve
- Altered Hemodynamics and Regional Cerebral Blood Flow in Patients With Hemodynamically Significant Stenoses
- Activity in the Peri-Infarct Rim in Relation to Recovery From Stroke