
Abstract
BACKGROUND AND PURPOSE: Blood flow within the middle cerebral artery can be monitored by transcranial Doppler (TCD) ultrasonography. Arterial stenosis can produce turbulent flow, but controversy remains regarding the degree of stenosis needed to cause TCD-detectable turbulence. Furthermore, cerebral emboli and turbulent flow may coexist in the same patient. The current study was designed to study the relationship between stenotic degree and TCD-detectable turbulent flow and its differentiation from cerebral emboli.
METHODS: A stenotic middle cerebral artery model was constructed to allow the study of different degrees of stenosis. TCD was used to detect the turbulent flow and embolic materials in the circulation model, and signal intensities were analyzed.
RESULTS: Turbulent flow was generated with a series of short, asymmetric stenoses in this test. Transition of turbulence from laminar flow began to occur at a moderate degree of stenosis (55% reduction of cross-sectional area) but became dampened at the high degrees of stenoses (≥75%). Turbulence caused a notable increase in average Doppler signal intensity. However, the degree of stenosis was not associated with signal intensity at the region where turbulence existed, but rather was related to the mean flow velocity measured at the narrowed region. Embolic materials such as air bubbles (30 μm) and platelet-rich clots (100 μm) had notably higher Doppler signal intensity than that produced by turbulence.
CONCLUSION: TCD-detectable turbulence predominantly developed at a moderate arterial stenosis and its acoustic signature with TCD is different from that caused by air bubbles and platelet-rich clots.
Turbulent flow has been defined as the flow in which pressure and velocity change constantly and erratically. Common examples are wind and water swirling around obstruction (1). In the medical area, the phenomenon of turbulence is present with vessel stenosis (2–4) or kinking (5) regardless of whether it is a result or a cause of this vascular lesion. There are four typical patterns of flow in different zones distal to the stenosis (6). The zones were as follows: zone I, separation zone; zone II, reattachment point; zone III, turbulent profile; and zone IV, relamination.
Stenosis can produce turbulent flow, but controversy remains regarding the degree of stenosis needed to cause detectable turbulence at Doppler ultrasonography (US). Previous studies of turbulence involving the use of Doppler US have focused on establishing spectral parameters that can be correlated to extent of stenosis (3, 4). However, additional properties of the Doppler signal exist that are also influenced by the nature of the flow field, and these may aid in characterizing flow disturbances. It has been found that the backscattered intensity for normal hematocrit blood increases with the onset of turbulence (6–9). The effect was confirmed by recent experiments using Doppler devices with a higher transmitting frequency (10 MHz) in vitro (10, 11). However, the acoustic character of blood flow turbulence with low transmitting frequency Doppler US, such as transcranial Doppler (TCD), and its association with stenosis in intracranial vessels have not been well documented. The phenomenon of turbulence may occur in the cerebral arteries when severe cerebral artery stenosis exists or cerebral artery spasm occurs or, in rare occasions, in association with cerebral collateralization via the ipsilateral anterior or posterior cerebral communicating artery after carotid obstruction (12). Better understanding of the quantitative relationship between the turbulence and stenosis may offer a criterion for the early detection of atherosclerotic plaques within human brain.
TCD has also been proved useful in depicting cerebral emboli characterized by abnormal transient Doppler signals with changed frequency and velocity and harmonic chirps (13). Cerebral embolic signals, like turbulent flow signals, also show an increase in signal intensity (14, 15). Turbulent flow, which normally occurs when a stenotic lesion is present in intracranial arteries or when the collateral pathway through the anterior communicating artery is activated (16), may coexist with cerebral embolism in the same patient during TCD recording. This is particularly likely in the case of embolism into the intracranial circulation from a stenotic internal carotid artery or middle cerebral artery (MCA) caused by an ulcerated atheroma (17, 18). In additional, confusion between emboli and turbulence may arise in association with shunt placement during carotid endarterectomy (19). Such Doppler signals were suspected to arise from turbulent blood flow or air bubbles. Differentiation is needed in this situation, because prevention and outcomes depend on the pathologic mechanism underlying turbulence. To our knowledge, such a study has not been reported in either the intracranial or extracranial territory.
The present investigation aimed to determine the degree of stenosis at which TCD-detectable turbulence would be produced in a short asymmetric stenosis MCA model, to evaluate the effect of the stenosis degree on the average signal intensity of the backscattered Doppler US signal and mean velocity, and to compare embolic signals with turbulent flow signals by use of total Doppler signal intensity. For this purpose, we used a method of quantitative signal intensity analysis, which measured the change of total signal intensity caused by either embolic particles or turbulent flow, and we also conducted a visual observation.
Methods
Stenotic MCA Model
An asymmetrical stenotic MCA was prepared in an MCA circulating model, which has been previously described in detail (20). In brief, varying degrees of asymmetrical stenosis were made with a rabbit’s thoracic aorta with an internal diameter of 3.8 mm, which is thought to be in the normal range of the human MCA diameter (1.5–4 mm) (21). As illustrated in Figure 1, diluted red blood cell (RBC) suspension (RBC:saline = 1:4 in volume) was circulated in a pulsed fashion by a pulsed pump (HR Flow Inducer type-MHRE/72; Watson-Marlow, England). TCD monitoring and recording were performed with this MCA model by use of a 2-MHz transmitting probe, coupled with a piece of human temporal bone inlaid in one of the walls of the model. Outdated packed human RBC suspension with a hematocrit of 35% was used as circulating fluid in this study. The flow rate was monitored throughout the study, using a calibrated electromagnetic flow meter. The flow rate was maintained at 120 mL/min before narrowing the artery.

Schematic illustration of the stenotic MCA model and circuit. Diluted RBC suspension was circulated in a pulsed fashion by a pulsed pump, and the embolic materials were injected into the circuit via the side port. Turbulence and embolic signals as well as flow velocities were continuously recorded from a TCD probe, which was coupled with the outside of temporal bone.
Different Degrees of Stenosis at Reproduction of Flow Turbulence
In this study, degree of stenosis was expressed as percentage of reduction in cross-sectional area. To examine the quantitative relationship between degree of stenosis and production of flow turbulence signals, a range of stenosis (45%, 55%, 65%, 75%, 85%, and 90% reduced cross-sectional area) was prepared with a method to be described. Considering that the diameter reduction system is also used to describe the degree of artery stenosis, the conversion of percent diameter reduction from percent cross-sectional area is listed in the Table. The reason for the choice of an asymmetrical stenosis was influenced in that symmetrical stenosis problems would arise with refraction when attempting to obtain Doppler signals formed within the constricted region (6). Additionally, clinical observations (22) suggest that stenoses are generally asymmetrical in shape, especially in regions where the artery curves.
Conversion of cross-sectional area and diameter reductions
In preparation for different degrees of asymmetrical stenosis of the vessel, metal bars with different corresponding diameters were prepared. Then a 2–0 braided silk suture (Ethicon Ltd., England) was used to tie around the artery, enclosing the metal bar of a selected diameter, and the metal bar was then gently withdrawn. The remaining cross-sectional area of stenotic artery was thereby equal to the area of the metal bar withdrawn. As a result, a series of short asymmetrical stenoses (because they have a short length of the constricted region of stenosis) could be performed with bars of different diameters. To confirm the change in a cross-sectional area after saturation, the stenotic artery was filled with paraffin wax and subsequently sectioned at four different sample zones with a blade after the experiment.
Preparation of Embolic Materials
Three kinds of cerebral embolic materials that are frequently encountered clinically, including blood clots, platelet aggregate, and microscopic air bubbles (“microbubbles”), were prepared, injected, and compared with flow turbulence signals. The methods for preparation and sizing of the embolic materials have been detailed elsewhere (20). In brief, the methods were as follows. 1) Whole blood clots were prepared by mixing 1 mL of 0.2 M CaCl2 solution with 10 mL of whole blood obtained from a donor. The formed clot was then sliced into emboli with a volume of 1 × 1 × 1 mm3 by a McIlwain tissue chopper (Mickle Laboratory Engineering, England). Prepared clots were stored in 10 mL of Dulbecco’s phosphate buffer before injection. 2) Platelet aggregate-rich plasma was prepared by adding 1 mL of platelet-rich plasma into 2 mL of 10 U/mL bovine thrombus (Sigma Chemical Co., St. Louis, MO). Ten milliliters of whole blood from a donor was anticoagulated with 0.5 mL of 0.1 M citrate anticoagulant and centrifuged at 100 × g for 15 minutes to prepare platelet-rich plasma. The mean size (0.85 ± 0.32 mm) of the platelet aggregates was determined by a microscope. We assumed that whole blood and platelet clots used in this study were cubic. 3) Microbubbles were prepared in 15 mL of Ultravist 370, a nonionic contrast medium (Schering Health Care Ltd., Germany), by stirring with a polytron for 40 seconds with power set at 10 watts. With this setting, microbubbles with a diameter of approximately 30 μm were generated. A blood cell count chamber was used to estimate the microbubble number. The method to verify microbubble size was the same as that for blood clots.
TCD Recording and Off-Line Signal Intensity Analysis
A 2-MHz probe of TCD (Nicolet, Warwick, England) was used in this study. The gain (two units), power (75 watts), and other TCD settings were kept constant throughout the study. However, the insonation depth varied with focusing distance along the turbulent flow. In this study, Doppler signals were sampled from four zones along the stenosis. They comprised the following: 1) prestenosis zone, 1 cm before stenosis (equivalent to upstream velocity profile); 2) stenosis zone (equivalent to high jet velocity profile and separation zone); 3) poststenosis zone I, 0.5 cm distal to stenosis (equivalent to turbulence profile); and 4) poststenosis zone II, 2.5 cm distal to stenosis (equivalent to relaminarization). To avoid possible overlapping between two sample areas, the sample volume of TCD was properly minimized (5 mm). Coupled with acoustic gel, the probe of TCD was allowed to slide up and down to insonate different zones along turbulent flow without changing the angle of US beams.
The total or average intensities of signals recorded from flow turbulence and injection of embolic materials were calculated using the intensity analysis software reported in our previous study (20). The signal intensity in this study was expressed as relative intensity units. Doppler signal intensity in this study is the amplitude of reflected Doppler US signal obtained from the sample area. It is mostly influenced by the transmitting power, flow velocity and form, RBC concentration (scattering), probe angle, tissue impedance, and other factors. In current experimental settings, because the transmitting power, RBC concentration (scattering), probe angle, and tissue impedance were kept constant, only flow velocity and form affected the Doppler signal intensity. Doppler signal analysis used a 128-point fast Fourier transform. This mathematical approach can convert a complex waveform pulse wave into a series of sine waves characterized by amplitude (intensity), phase, and time period. In this study, the intensity of embolic signals as well as turbulence flow signals was calculated by analysis of digital spectral information. Total signal intensity for embolic Doppler signal is calculated by summing of the amplitude component per spectral line over a period of an embolus’s passage. The average signal intensity for turbulence flow was calculated by dividing the sum of total signal intensity over a given period.
In addition to signal intensity analysis, the changes in the shape of the velocity waveform with distance from the stenosis were also studied by simultaneous flow visualization, point velocity measurement, and audio characterization. The relationship between the transition of flow turbulence and the degree of arterial stenosis was examined visually from the image component of the Doppler velocity waveform. With the above methodology, we have studied the following objectives.
Comparison of Average Signal Intensity in Different Sample Positions.—First, we investigated the dynamic distribution of signal intensity along different zones of a typical stenosis of the artery. A 65% reduction cross-sectional area was chosen for this observation, because turbulent flow was most typical and reproducible at that degree of stenosis in the current experimental setting. The average signal intensity was calculated from six frames of Doppler flow velocity waveform, which were sequentially recorded at each of the following sample positions: prestenosis zone, stenosis zone, poststenosis zone I, and poststenosis zone II.
Correlating Degree of Stenosis with Average Signal Intensity.—To study the quantitative relationship between degree of stenosis and the Doppler signal intensity with flow turbulence, the average signal intensity sampled at the poststenosis zone I was correlated with the arterial stenosis severity ranging from 45–90%. The average signal intensities were calculated from six consecutively recorded frames at poststenosis zone I for each degree of stenosis.
Correlating Degree of Stenosis with Mean Doppler Flow Velocity.—To evaluate the effect of different degrees of arterial stenosis on flow velocity, the mean velocity was obtained at poststenosis zone I from six consecutively recorded frames at each degree of different stenosis (45–90%) and then correlated with the series of the stenosis.
Comparison of Signal Intensity of Turbulence with That of Emboli.—Differentiation of flow turbulence from embolic materials was performed by means of visual comparison and signal intensity analysis. Signal intensity for flow turbulence was calculated from a 65% degree of stenotic artery, because it reproduced the most typical flow turbulence at that degree of stenosis in this experiment. Total signal intensity of flow turbulence was randomly sampled and calculated during a 100-ms window, because that was the usual maximum duration of embolic signals we observed in this study. The mean total signal intensity was calculated from eight turbulence signals recorded at the position of poststenosis zone I. The signal intensity of flow turbulence was then compared with that obtained from the same position of the stenotic vessel from injections of embolic materials, including whole blood clots (n = 8), platelet-rich clots (n = 8), and air bubbles (n = 8), into the MCA model via a side port.
Statistical Analysis
All data in this study were expressed as mean ± 1 SD. One-way analysis of variance was used for comparison of the signal intensities generated from multiple settings, with subsequent individual comparisons made using Scheffe’s test. The relationship between degree of stenosis and total signal intensity increase caused by flow turbulence or Doppler flow velocity at the poststenosis zone I were evaluated by calculating the correlation coefficient. Logarithmic transformation was used to normalize distribution, when appropriate, before regression analysis. Results were considered significant if P < .05.
Results
Flow Turbulence in Different Stenotic Zones
The Doppler velocity waveform in different sample positions (zones) at a degree of stenosis of 65% are shown in Figure 2. The diluted RBC concentrate flow showed a normal Doppler velocity waveform in the prestenosis zone. At the stenosis zone, the flow showed a sharp increase in systolic velocity (so-called jet flow or flow acceleration) and the color-coded signal intensity started to intensify. In the poststenosis zone, the systolic velocity tended to drop, but a typical turbulence component was noted in the center of the waveform, accompanied by an apparent reversal of flow and loss of high frequency definition in the velocity waveform. Also, a floodlike noise could be heard over the systolic period in both the stenosis and poststenosis zones. The flow in poststenosis zone II tended to be normal but had lower flow velocity. The order of mean Doppler flow velocity from low to high was as follows: poststenosis zone II, prestenosis zone, poststenosis zone I, and stenosis zone.

Characterization of Doppler waveform at different zones along the stenotic artery (65% reduced area). Flow of RBC suspension displayed a normal Doppler velocity profile at the prestenosis zone. However, at the stenosis zone, the flow showed a sharp increase in systolic velocity and the signal intensity started to distribute unevenly; at poststenosis I zone, the velocity tended to decrease, but a high intensity turbulent signal in the central waveform and apparent reversal flow became notable. The flow profile at poststenosis zone II returned to normal but had a lower systolic velocity.
Analysis of average Doppler signal intensity showed that it started to increase at the stenosis zone (1004.0 ± 52.0 units) compared with that in the prestenosis zone (527.8 ± 12.3 units) (P < .0001). The average signal intensity reached a peak in the poststenosis I zone (1480.7 ± 61.1 units) and significantly decreased in the zone of poststenosis II (1204.00 ± 13.10 units) (P < .0001). The order of average signal intensity was different from the order of mean flow velocity, as follows: prestenosis zone, stenosis zone, poststenosis zone II, and poststenosis zone I.
Relationship between Degree of Stenosis of Artery and Turbulence
Turbulence and Degree of Stenosis.—Visual observation of the changes in flow pattern with the degree of stenosis was undertaken in this study. The transition of turbulence did not occur until the degree of stenosis increased to 55%, but it was still in an immature shape. A typical turbulence pattern became visible at a degree of stenosis of 65% and persisted at 75%. Reversed flow followed the same course. Turbulent flow became dampened at 85% and 90% degree of stenosis. However, the systolic velocity kept increasing from 65% to 90% degree of stenosis (Fig 3).

Dynamic profile of flow turbulence associated with different degrees of arterial stenosis. The transition of flow turbulence did not occur until the degree of stenosis of the artery increased to 55%. At stenoses of 66% and 75%, turbulence became most typical and was accompanied by reversed flow. Turbulence remained but decreased when degree of stenosis increased to 85% or 90%. Both systolic and diastolic velocities increased in association with the rising degree of stenosis, but systolic velocities changed more predominately.
Average Signal Intensity and Degree of Stenosis.—Figure 4 shows that the average signal intensity calculated in poststenosis zone I was related to degree of stenosis. Compared with the average Doppler signal intensity without stenosis, the signal intensity rose linearly with an increase in severity of stenosis, and the average signal intensity reached a peak at an artery stenosis of 75%. Afterward, the average signal intensity gradually decreased as stenosis increased. A poor correlation existed between the average signal intensity at the poststenosis region and degree of stenosis of the artery (r = 0.71, P = .07).

Correlation between degree of stenosis and average signal intensity of flow turbulence sampled at poststenosis zone I. Association between average Doppler signal intensities sampled at poststenosis zone I and degrees of stenosis of the artery looks like a tea spoon. Poor correlation existed between the two indices (r = 0.72, P = .07).
Relationship between Degree of Stenosis of Artery and Doppler Mean Flow Velocity
The relationship between the degree of stenosis and the mean Doppler flow velocities measured in the poststenosis region from all degrees of stenosis was evaluated. The mean flow velocity increased with the severity of the stenosis, but the relationship was nonlinear in the overall course. However, after a logarithmic transformation of the mean velocity readings from degree of stenosis of 45% to 90%, it was found that a linear relationship existed between the mean flow velocity obtained at the poststenosis zone and the degrees of stenosis selected in this study [y = −108.6 + 2.86x +34; r = 0.95; P < .05] (Fig 5).
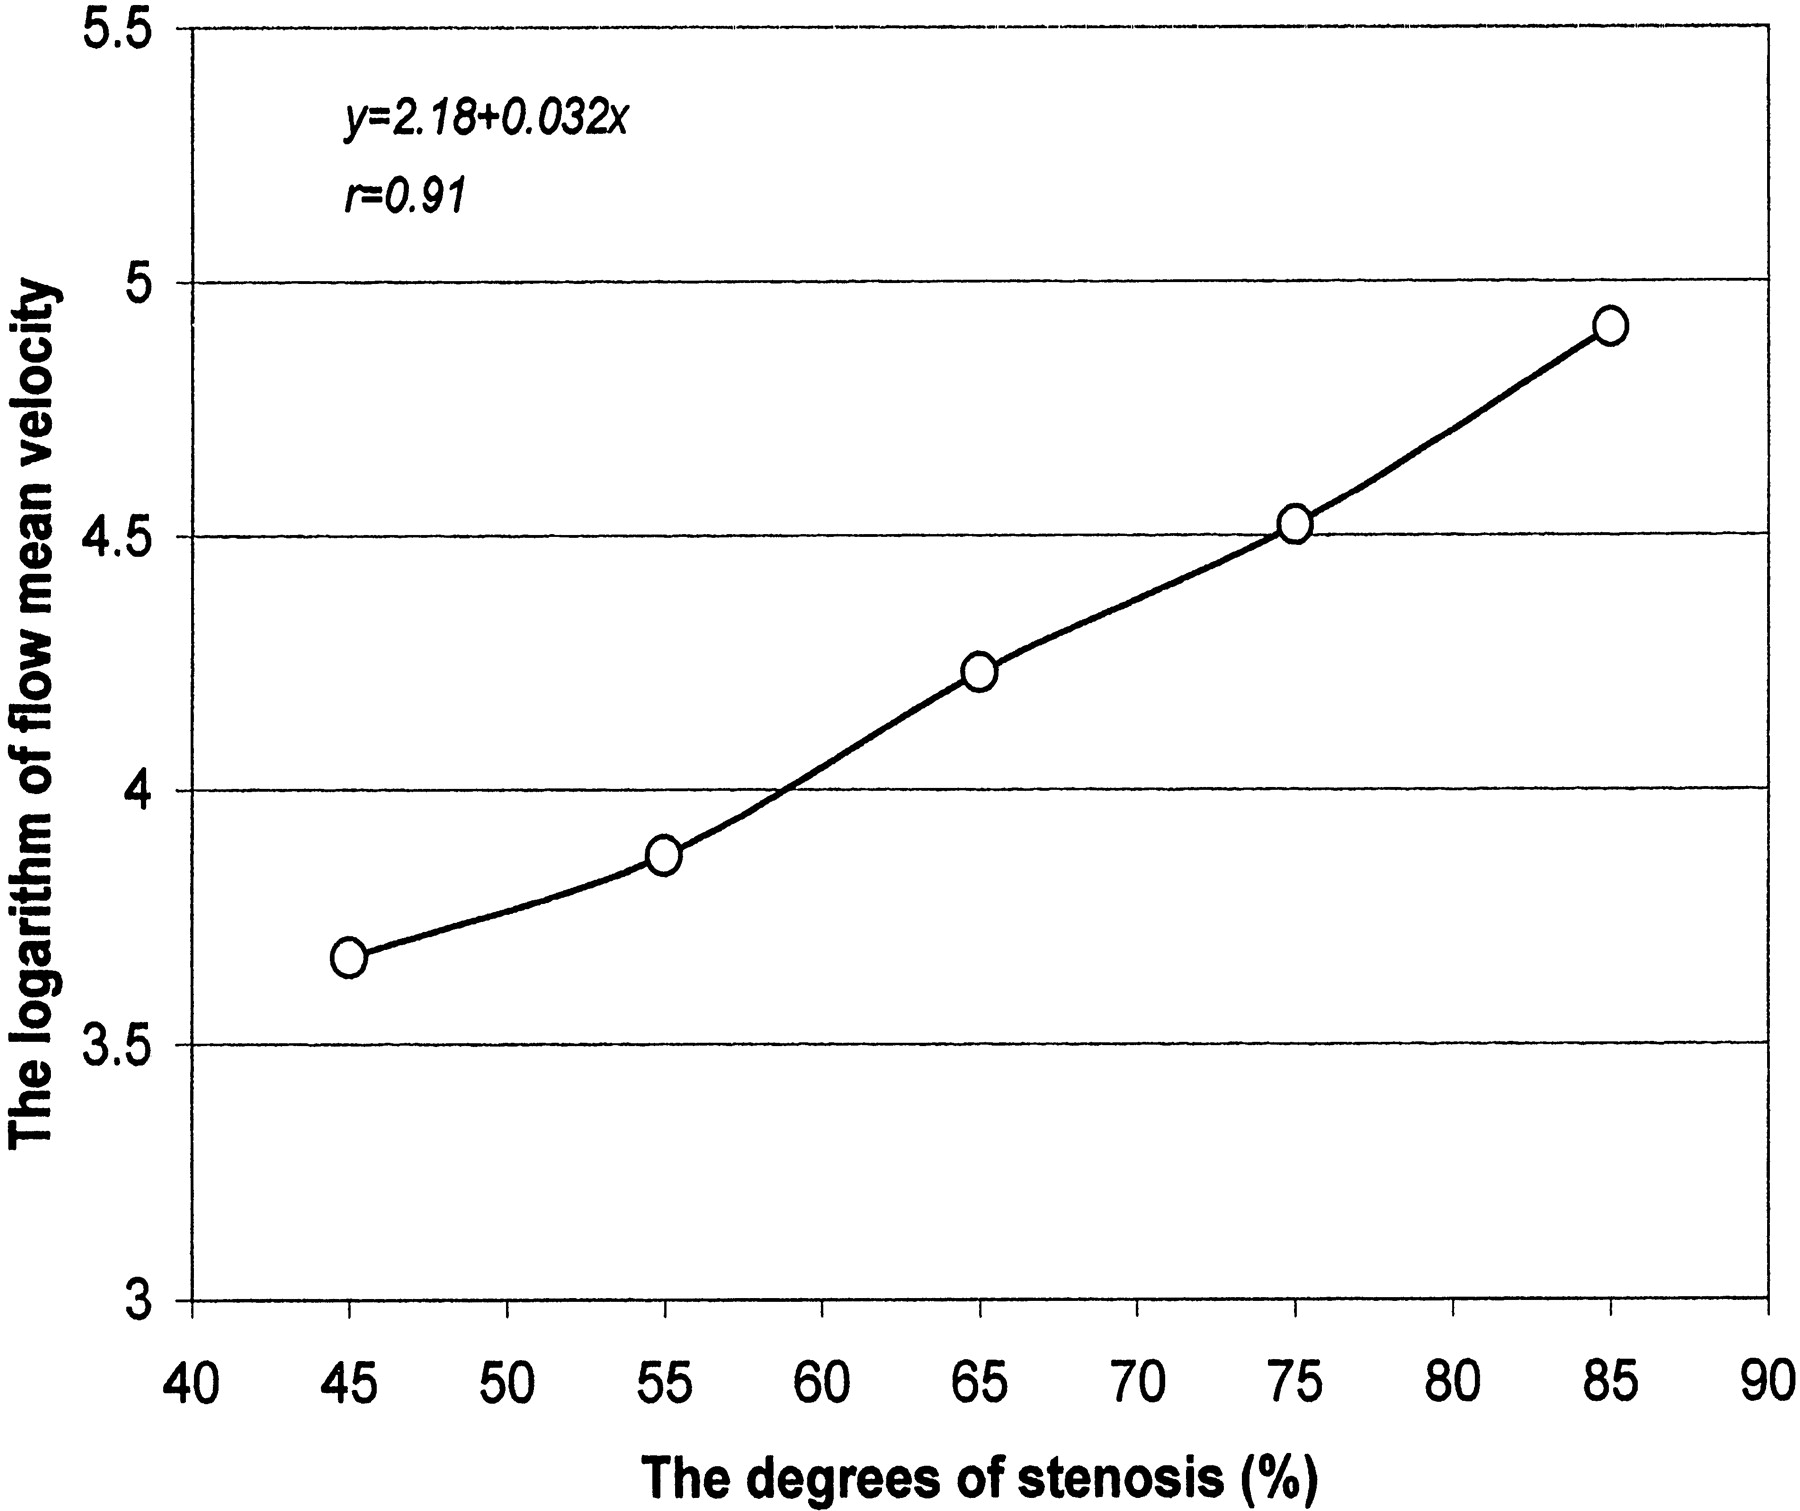
Correlation between degree of stenosis and Doppler mean flow velocity at poststenosis zone I. Mean velocities calculated at poststenosis zone I showed a linear relationship, with an increase in degree of stenosis after logarithmic transformation of mean flow velocity.
Comparison of Turbulence Signal with Embolic Signals
Visual Comparison.—Figure 6 compares turbulent flow signals and embolic signals induced by injection of commonly seen embolic materials. From the color-coded intensity spectrum, turbulence flow signals are characterized as having a high intensity core in the center of the systolic period of the velocity waveform, accompanied by jet flow velocity, a consistent harsh noise, and apparent reversed flow. But embolic signals were featured as high intensity component points that randomly occurred at any time in the pulse cycle, were brief in duration, and were accompanied by transient harmonic chirps. They were easily distinguished from each other according to these features.

Visual differentiation between turbulence signals and embolic signals. Turbulence signals showed a high intensity area in the center of the systolic phase of the Doppler flow waveform and were usually accompanied by jet flow velocity, harsh noise, and reversed flow. However, embolic signals were featured as high intensity points that randomly superimposed on the flow waveform of either the systolic or diastolic period, accompanied by harmonic chirps.
Comparison of Total Signal Intensity of Turbulence with That of Embolic Signals.—No significant difference existed between the total signal intensity of turbulence flow (3258 ± 900 units) and that of whole blood clots (2389.7 ± 1278.2 units) (P = .14). However, the total intensity of embolic signal increased by introduction of platelet-rich clots (23303.0 ± 9596.5 units) and air bubbles (39220.4 ± 14076.2 units) was significantly higher than that of the turbulence flow signal (turbulence versus platelet clot, P = .0003; turbulence versus microbubbles, P = .0001).
Discussion
Since Aaslid et al (23) initially recorded flow turbulence intracranially with TCD during compression maneuvers, this technology has been successfully applied to detect turbulent flow in patients with stenosis or spasm of the cerebral artery or under conditions of collateral circulation (12, 16). However, to our knowledge, quantitative TCD study of the relationship between the Doppler signal intensity and intracranial cerebral artery stenosis has not yet been documented. Turbulence has been successfully reproduced, detected, and compared in a stenotic MCA model in this study. This color Doppler imaging technique affords overall demonstration of flow turbulence on which signal intensity quantification and visual assessment are based. This suggests that qualitative and quantitative assessment of turbulent flow in an in vivo situation should be possible.
With constrictions in flow loops to mimic arterial stenosis, Bascom et al (6) and Cloutier et al (10) found higher Doppler power and US echogenicity beyond the stenosis at levels that varied with the distance from the measured site to the stenosis. This is in good agreement with our current observation in which the measured average signal intensities are different in the regions before or distal to stenosis. The reason for this turbulence-induced signal intensity increase is not fully understood, but a possible explanation has been presented by previous investigators (6, 24). As the flow changes from laminar to turbulent, fluctuations in the velocity field increase, resulting in an enhanced variance of the RBC distribution, which should cause the Doppler signal intensity to increase.
One of the purposes of the present study was to relate occurrence of turbulence to severity of stenosis. This observation was conducted in a series of short stenoses from 45–90%. It was shown that the transition to turbulence did not occur with 45% stenosis (a moderate degree of stenosis). The transition to immature turbulence was triggered with only 55% stenosis, and typical turbulence was present when increasing the severity of the stenosis to 65%. These results are similar to the previous findings by Ojha and Langille (25). They formed a short stenosis in an in vivo model by using the common carotid artery of the rabbit and found that turbulence did not occur at 55% stenosis, although such a severity of stenosis could cause poststenotic dilatation. The development of turbulence did not occur until increasing the severity of short stenosis to 70% on the rabbit carotid arteries. Other investigators concluded that mild stenosis can cause flow acceleration but not flow turbulence (26) and thereby defined the degree of carotid stenosis of approximately 50% to approximately 99% as being hemodynamically relevant (27). By contrast, it was reported that turbulent flow could be created by mild stenosis of 30% in the dog aorta (28) and 40% in the asymmetrically stenotic human carotid artery (29). No general agreement exists regarding degree of stenosis and generation of turbulence. This is probably because in addition to severity of stenosis, occurrence of turbulence is also affected by other factors, including flow rate, hematocrit of the flowing materials, compliance of the tube wall (2), and sample distance distal to stenosis. The difference in the sensitivity of Doppler devices used may be another source of disagreement (29). The limitation of US in enhancing the detection of a mild degree of stenosis through turbulence measurements has to be recognized on the basis of our current study and the reported literature. However, our results also show that the measurement of the change of flow velocity with the same device can compensate for the limitation. It has been noticed that Doppler signal intensity varies with distance along the stenosis and degree of stenotic severity, suggesting that different turbulence-associated conditions have different effects on the positional relationship of RBC in a vessel, which in turn results in different acoustic characters (echogenicity) of RBC.
We also found that the Doppler signals recorded in severe stenosis (85% and 90%) decreased compared with those recorded in moderate stenosis. This may be because at a high degree of stenosis, the stenotic throat is too narrow to allow enough RBC flow to reach the poststenotic regions. Consequently, fewer RBCs act as US scatters. This situation also has been reported in the intracranial circulation (the narrowed MCA) (12) and the extracranial circulation (the severely stenosed carotid artery) (29, 30). This phenomenon has clinical applications, because it is one of characteristics of stenosis.
We further investigated the effect of the degree of stenosis on average Doppler signal intensity and mean Doppler flow velocity to gain insight into the mechanisms of this phenomenon. The average intensity grows markedly in the zone of turbulence profile and then dissipates rapidly at the zone of relaminarization. This behavior is characteristic of poststenotic flow, as has been shown in both animal (31) and in vitro models (28). However, it was unexpectedly observed that this increase at poststenosis zone I seems to be independent of the change in degree of stenosis. This result is not in accord with the previous finding by Giddens and Khalifa (28). They reported that the intensity of turbulence was proportional to the reduction of cross-sectional area and therefore concluded that the signal intensity of turbulence could be used as a diagnostic indicator of assessment of the cross-sectional area of stenosis. However, the data from the present study seem to open this application to question. The additional influencing factors previously described herein, and possibly the use of temporal bone in this model, may explain the differences.
In contrast, mean flow velocity recorded at the zone of turbulence showed a different course. It showed a quantitative relationship with the gradient of stenosis degree. A similar result was reported by Vattyam et al (32) in an in vivo model. This result implies that pathologic increases in velocity facilitate TCD detection of luminal narrowing in the intracranial arteries, whether because of atherosclerotic stenosis, recanalization, or partial obstruction after embolization.
Stenotic abnormalities are not only obstructive but are also potentially emboligenic lesions (33). It is possible for turbulence and embolism to coexist in a clinical situation. In this study, we attempted to differentiate them not only by visual assessment but also by signal intensity analysis. It was found that turbulence and embolic signals are not difficult to distinguish by their own visual features and acoustic behavior in the Doppler waveform. In contrast, some difficulty of differentiation exists when using total signal intensity, because both turbulence and emboli cause a marked increase in total signal intensity. However, this is not such a problem if air bubble emboli are involved or if solid emboli are large. Signal intensity analysis may become more important when an embolic signal superimposes on a turbulence signal, because visual identification may be difficult in this situation; however, we did not address this in the current study.
Limitations of the proposed model used in this study exist. The hematocrit, as used in the model (35%), may be lower than in the average patient population. The hematocrit may play an important role in the generation of flow turbulence. The embolic signals were obtained from a poststenosis region. We did not test the embolic signals from a proximal source to the focal stenosis; therefore, attention is required when applying the findings from this study to another setting. Furthermore, although detection of “high intensity transient signals” with TCD is still used to identify patients at risk of cerebral embolism, the overall value of high intensity transient signals in patients with stroke has been of declining value in recent years. The long-term clinical implications of high intensity transient signals have yet to be determined.
Conclusion
We successfully reproduced TCD-detectable fluid dynamic turbulence in the in vivo MCA model. These findings may provide a more quantitative and reproducible method of interpreting flow patterns in the region of a stenosed cerebral artery. We found that turbulent flow was detectable only at moderate to high degrees of stenosis with the current experimental settings. Change in degree of stenosis more significantly affects mean flow velocity than average signal intensity, from measurement immediately distal to the stenosis, and this has a potential clinical application. Turbulence has a different Doppler acoustic signature and signal intensity from those of embolic signals. Signal intensity analysis may help in this differentiation if air bubble emboli or solid emboli with a relatively large size are involved.
Acknowledgments
The authors thank Professor John L. Reid for help and encouragement with this project and Dr. Andrew Kelman for technical consulting.
Footnotes
Supported by British Council and Postgraduate Research Funding of the University of Glasgow.
References
- Received November 20, 2001.
- Accepted after revision March 17, 2002.
- Copyright © American Society of Neuroradiology
In this issue


Jump to section
Related Articles
Cited By...
- No citing articles found.