
Abstract
BACKGROUND AND PURPOSE: Pick complex (PC) is the name given to a group of diseases comprising Pick disease and its variations, all of which have a large degree of pathologic and clinical overlap. Because of this overlap, the observation of neuropathologic changes in vivo is difficult, although these changes play important roles in the criteria used for classification. The purpose of this study was to evaluate changes in brain metabolism in PC with proton chemical shift imaging (1H-CSI).
METHODS: Nine patients with PC (three each with frontotemporal dementia, corticobasal degeneration [CBD], and primary progressive aphasia [PPA]) and five healthy subjects underwent 1H-CSI. Volumes of interest were selected at the level of the basal ganglia by using a spin-echo sequence (TR/TE, 2000/13). Peak areas and ratios of N-acetylaspartate (NAA), creatine (Cr), and choline (Cho) were calculated in voxels in the basal ganglia and perisylvian regions.
RESULTS: Reduced NAA/Cho ratios were observed in the right basal ganglia of the patients with PC. In patients with CBD or PPA, low NAA/Cr values were detected in the right perisylvian region.
CONCLUSION: In PC, 1H-CSI decreased NAA values in a wide area. Significantly reduced NAA levels in the right hemisphere in patients with PC suggests a neurodegenerative change and may reflect cases in which the right hemisphere is dominantly affected, compared with the left hemisphere. 1H-CSI provided information that could not be obtained with other imaging techniques. Thus, 1H-CSI may provide useful information for understanding the pathologic process underlying PC.
Remarkable advances in the understanding of Alzheimer disease (AD) have occurred since the cholinergic hypothesis of AD was proposed in the late 1970s (1, 2). In contrast, only limited progress has been made in the study of Pick disease (PiD), although AD and PiD used to be recognized as the two major causes of mental retardation in elderly people. This limitation may be related to the many proposed classification systems for PiD and other non-Alzheimer degenerative dementias (NADDs).
In PiD, frontotemporal atrophy with aphasia and personality changes, followed by generalized dementia, are the characteristic features. Argyrophilic neuronal inclusions called Pick bodies are indispensable in the neuropathologic classification of PiD (3, 4). Constantinidis et al (5) and Dickson (6) classified classic PiD into three types: A, B, and C. Type A PiD is classic PiD with Pick bodies. Type B PiD is characterized by superior frontal and parietal atrophy without Pick bodies. Extrapyramidal and pyramidal signs are often observed. These cases now are considered corticobasal degeneration (CBD). CBD was proposed for cases with an akinetic-rigid syndrome and frontoparietal atrophy (7). In PiD type C, atrophy affects anterior temporal and frontal lobes, without Pick bodies. Most of these cases are now classified as frontotemporal dementia (FTD).
The Lund and Manchester groups (8) proposed that FTD was NADD with frontotemporal cortical atrophy. Although language disturbance is included in the syndrome of FTD, some cases involve slowly progressive language disorder without additional intellectual or behavioral disturbances of dementia. Mesulam (9) first described this condition as slowly progressive aphasia without generalized dementia and later renamed it primary progressive aphasia (PPA). Cortical atrophy that selectively affects the left perisylvian region has been reported in PPA.
The clinical and pathologic features of these entities seem to overlap, and the diseases seem to be closely related (10–14). Because of this overlap in the clinicopathologic features of these diseases, the term Pick complex (PC) was proposed to describe neurodegenerative diseases characterized by focal cortical degeneration, including PiD, FTD, CBD, and PPA (10, 15). Also because of this overlap, observation of the neuropathologic changes in PC in vivo is difficult, although these changes, such as the presence of Pick bodies, play important roles in the criteria used for classification. Indeed, the neuropathologic changes in PC have been demonstrated by using brain imaging techniques such as MR imaging (16–19), single photon emission tomography (SPECT) (20), and positron emission tomography (PET) (21–23). However, the pathophysiology of PC remains unclear.
Proton chemical shift imaging (1H-CSI) has improved our understanding of the neuropathologic features in brain lesions, and it has revealed metabolite distributions in many such lesions (24–26). 1H-CSI has also been used in cases of FTD and CBD (27–31); however, few studies have used 1H-CSI to examine PC. The purpose of the present study was to analyze changes in brain metabolism in PC and to evaluate the role of 1H-CSI in assessing these diseases.
Methods
Subjects
Nine patients (four men, five women; age range, 37–80 years [mean, 65.4 y ± 13.0]) with PC (three with FTD, three with CBD, and three with PPA) and five healthy subjects (four men, one woman; age range, 24–49 years [mean, 32.2 y ± 11.3]) underwent 1H-CSI with a 1.5-T whole-body MR system (Magnetom H15 SP; Siemens, Erlangen, Germany). The cases of FTD were diagnosed by using the diagnostic criteria of the Lund and Manchester groups (8). The cases of CBD and PPA were diagnosed by means of the clinical symptoms and diagnostic images, including SPECT and MR images. All CBD cases involved frontotemporal atrophy with akinetic-rigid syndrome. The onset of the cases with PPA involved aphasia with selective atrophy that preferentially affected the left perisylvian region. Most of these patients did not have generalized dementia. The mean Mini-Mental State Examination score in those with PC was 21.3 (SD, 7.4).
MR Spectroscopy
On transverse and sagittal T1-weighted spin-echo images of the brain (TR/TE, 200/15; section thickness, 8 mm; intersection gap, 2 mm), a 15-mm-thick volume of interest (VOI) was selected near the basal ganglia. The anteroposterior and left-to-right dimensions of the VOI (mainly 100 × 80 mm) were adjusted for every subject according to his or her brain size. This rectangular VOI was selected to exclude contamination of signal intensity from the skull and subcutaneous fat.
The magnet was shimmed on the 1H water signal intensity of the localized VOI to a line width of 7–12 Hz full width at half maximum. 1H-CSI consisted of a double spin-echo sequence (TR/TE/NEX, 2000/135/4). Before the data were acquired, a chemical shift selective pulse with a dephasing gradient was applied for water suppression. Two directional 16 × 16 phase encoding steps were applied over a 160 × 160- or 180 × 180-mm field of view near the basal ganglia. This procedure resulted in a nominal in-plane resolution of 10–11 mm. The nominal voxel size was 1.5–1.9 cm3 before zero filling. The 1H-CSI data without water suppression were measured to correct for eddy currents. The entire duration required for the measurements was approximately 60 minutes.
Data Analysis
The 1H-CSI data sets were processed by using the custom spectroscopic imaging software on a SPARC 20 workstation (Sun Microsystems, Mountain View, CA). The spatial dimensions were zero filled to 32 points, and the time dimension was filtered with a gaussian filter. After a 2D Fourier transformation was performed, the baseline was corrected by subtracting the fitted five-dimensional polynomial curve. The phase was adjusted primarily by using a N-acetylaspartate (NAA) peak with a linear or constant phase angle.
The three major resonances in the spectra (NAA, choline [Cho], and creatine [Cr]) were curve fitted, and the peak areas were obtained in all voxels. The peak areas of NAA, Cho, and Cr were used to calculate metabolite signal-intensity ratios. Peak area calculations without volume correction were validated by using the MR images, which revealed that the chosen voxels contained approximately no CSF space.
Statistics
Mean values and standard errors of the three metabolite ratios (NAA/Cho, NAA/Cr, and Cho/Cr) were computed in each disease group for four brain regions (basal ganglia and perisylvian regions in each hemisphere). The Mann-Whitney U test was performed to examine the difference between groups. Statistical significance was established at the P < .05 level.
Results
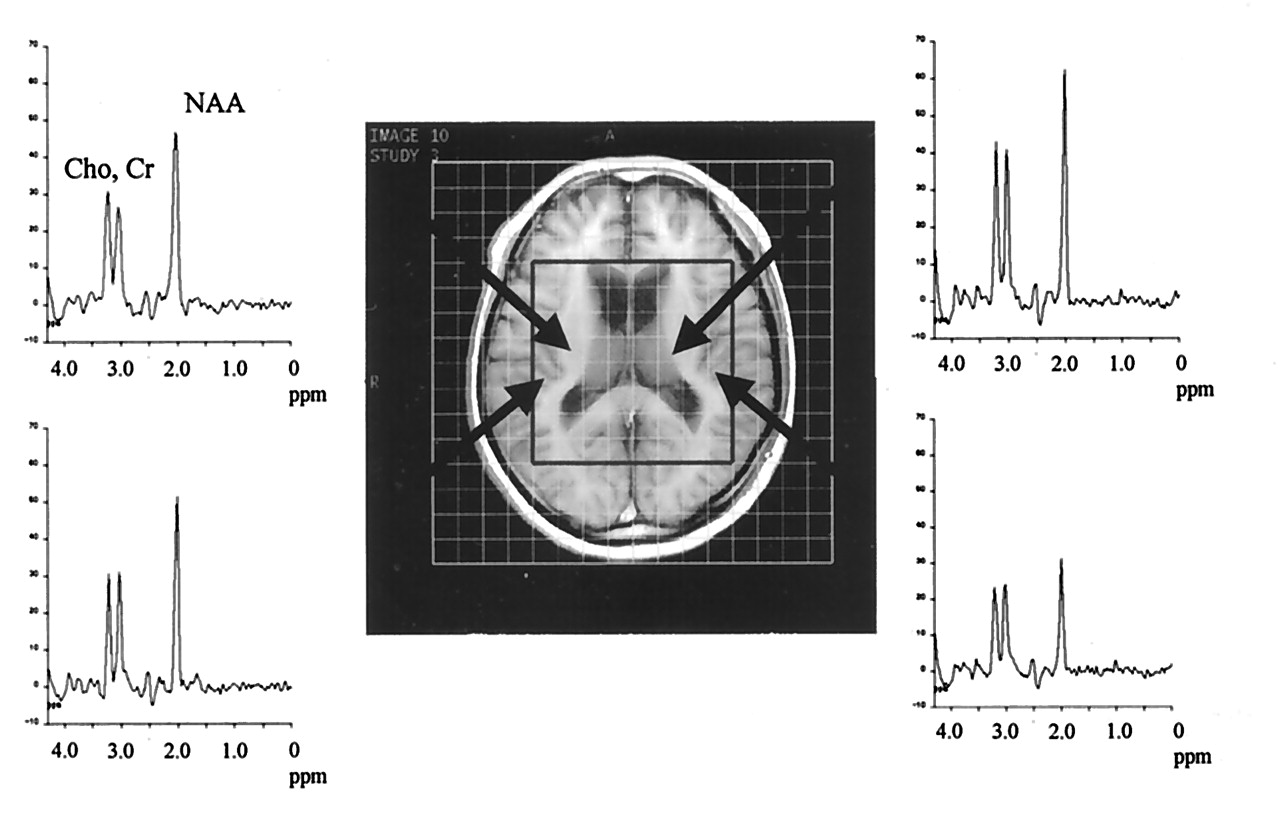
In the PC cases, 1H-CSI showed decreased NAA values in a wide area of the brain (Figs 1–3). The NAA/Cho ratio in the right basal ganglia (1.74 ± 0.21, P = .028) and the NAA/Cr ratio in the right perisylvian region (1.62 ± 0.42, P = .019) were significantly lower than those in the control subjects (2.18 ± 0.44, 1.98 ± 0.09) (Figs 4, Table). We observed no significant decreases in the NAA/Cho and NAA/Cr ratios in the left basal ganglia (respectively, 2.13 ± 0.59, P = .641 and 1.51 ± 0.40, P = .842) or in the left perisylvian fissure (respectively, 1.84 ± 0.37, P = .894 and 1.54 ± 0.46, P = .182). No statistically significant difference was found in Cho/Cr ratios in any region.

Proton MR spectra from bilateral basal ganglia and perisylvian regions in a case of FTD. Arrows indicate the chosen voxels. A T1-weighted MR image with VOI, which is outlined by a box, can be seen as a reference. In this case, NAA at 2.0 ppm was observed in the left basal ganglia.

Proton MR spectra from the bilateral basal ganglia and perisylvian regions in a case of CBD. Arrows indicate the chosen voxels. In this case, reduced NAA was observed in bilateral basal ganglia.

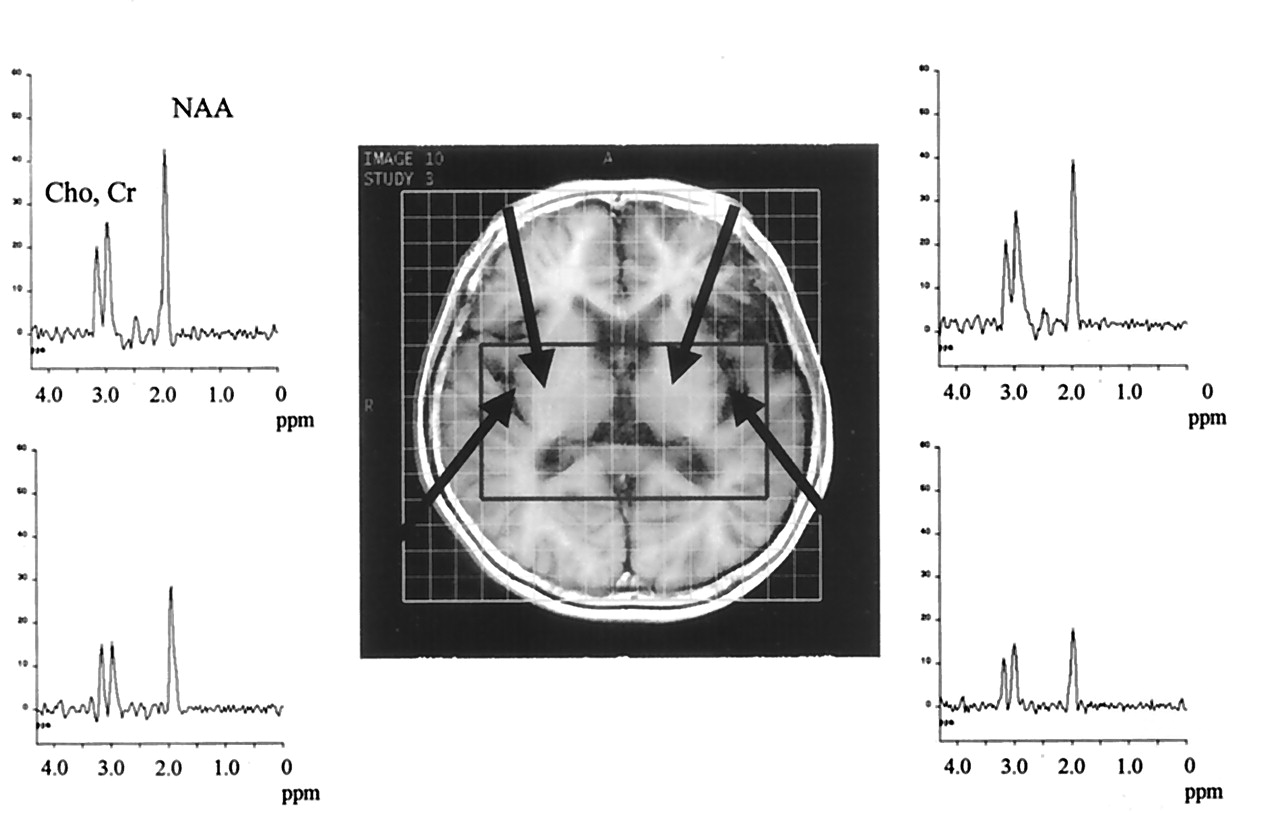
Proton MR spectra from bilateral basal ganglia and perisylvian regions in a case of PPA. Arrows indicate the chosen voxels. Note reduced NAA in the left basal ganglia and left perisylvian region.

Box plots of peak ratios (NAA/Cho, NAA/Cr, and Cho/Cr) among controls subjects and patients with PC, FTD, CBD, and PPA. The box stretches from the lower hinge (defined as the 25th percentile) to the upper hinge (defined as the 75th percentile), and the median is shown as a line across the box. Outside the box, 10th and 90th percentile lines are shown. A statistically significant decrease in NAA/Cho was found in the right basal ganglia among patients with PC (P = .028). NAA/Cr ratio from the right perisylvian regions in patients with PPA and CBD were lower than that in control subjects (P = .025 and P = .025, respectively). No statistically significant difference in peak ratio was found in the left perisylvian regions or the left basal ganglia.
Summary of peak ratios in proton chemical shift imaging
Exploratory subgroup analysis was performed. In the FTD cases, low NAA values were observed in the perisylvian region (Fig 1); however, no significant difference in peak area ratios between FTD and control subjects was observed. In the CBD cases, low NAA values were observed not only in the perisylvian region but also in the basal ganglia (Fig 2). NAA/Cr ratios were significantly lower in the right perisylvian region in CBD patients than in the same region in the control subjects (1.42 ± 0.10 versus 1.97 ± 0.09, P = .025). In PPA patients, decreased NAA values were observed not only in the left perisylvian region but also in the right perisylvian region (Fig 3). Only the NAA/Cr peak ratio (1.56 ± 0.13, P = .025) in the right perisylvian region was significantly different from the control ratio.
Discussion
PiD and its variations have a large degree of pathologic and clinical overlap, and this overlap has caused some confusion in the classification of these diseases (10–14). To avoid this confusion, the term Pick complex was proposed to describe neurodegenerative disease characterized by focal cortical degeneration, including PiD, FTD, CBD, and PPA (10, 15). The confusion is caused by the difficulty in observing the pathophysiologic changes in PC in vivo, although neuropathologic changes in PC have been demonstrated by means of brain imaging. A need to observe the metabolic changes in vivo still exists. The purpose of the present study was to analyze the metabolic changes and to evaluate the role of 1H-CSI in the assessment of PC.
The major finding demonstrated in this study was the reduction in NAA values in the right hemisphere of patients with PC. A low NAA/Cho ratio was detected in the right basal ganglia, and a low NAA/Cr ratio was observed in the right perisylvian region in patients with CBD or PPA. Although the peak ratios in patients with FTD and healthy subjects were not significantly different, a relative decrease in NAA, compared with Cho and Cr, was observed in the spectra of those with FTD. NAA is a neuronal marker, and reduced NAA levels reflect neuronal damage. A Cho peak contains Cho and Cho-containing compounds such as phosphorylcholine and glycerylphosphorylcholine. Cho represents one of the membrane constituents and is thought to indicate cell density. Neuronal death in PC may cause reduce NAA levels and increase Cho level (or result in a low NAA/Cho ratio) as a result of cellular breakdown. The Cr peak represents the sum of Cr and phosphocreatine, and Cr is a marker of cerebral energy metabolism. Cr has the most stable concentration in intact brain and is often used as the denomination of metabolite ratios. Thus, the reduced NAA/Cr ratio in the right perisylvian region indicates a neuronal degenerative change.
Although focal atrophy dominant in the left hemisphere is a common image finding in PC, reduced NAA values in the right hemisphere may reflect the existence of cases in which the right hemisphere is dominantly affected, compared with the left hemisphere.
PiD is characterized by atrophy in the pars orbitalis of the frontal lobe and temporal lobe without the posterior part of the superior temporal gyrus (6), and the atrophy may be worse in the left hemisphere. MR imaging in FTD has revealed greater anterior brain atrophy than in AD (16). Widespread and asymmetric frontotemporal atrophy is reported to be a characteristic feature of FTD (17). A low regional metabolic rate for glucose in FTD was predominant in the frontal and anterior temporal lobes, as opposed to AD (21). In FTD, the frontal lobe has been shown to have reduced NAA and glutamate-glutamine levels and increased myoinositol levels (28). In the present study, no significant difference in peak area ratios was observed between patients with FTD and control subjects, although reduced NAA values were detected in some cases. The limitation in number of cases and in the reproducibility of 1H-CSI may have been responsible for this finding; however, the variety in the affected brain areas in the cases of FTD may also have contributed to this observation. By using the criteria that primarily consist of clinical symptoms, cases with various brain atrophy types are diagnosed as FTD. The voxels in the present study, which were selected to exclude CSF, may have been located in areas of the brain that were relatively disease-free.
The low NAA/Cr ratio in the right perisylvian region in patients with CBD or PPA in the present study appears to be inconsistent with results of previous reports. For instance, in CBD, MR findings of asymmetric paracentral cortical and basal ganglia atrophy with curvilinear T2 prolongation in the posterolateral putamen were reported to be characteristic of this condition (18). Furthermore, decreased regional cerebral glucose metabolism in these regions has been observed by using fluorodeoxyglucose PET (22). In CBD, reduced NAA/Cr ratios have been reported in the parietal and frontal cortices, as well as in the centrum semiovale and basal ganglia (29, 30). None of these reports indicated the presence of right hemisphere-dominated atrophy. In PPA, atrophy localized primarily to the superior and middle temporal gyri has been visualized on MR images (19). Moreover, PET has revealed profound hypometabolism in the left temporal regions in cases of PPA (23). Predominant left frontal and perisylvian atrophy has been observed on MR images in nonfluent PPA. SPECT images obtained with technetium-99m hexamethyl propyleneamine oxime (99mTc HMPAO) has shown reduced uptake in the same region. In addition, MR images have shown left temporal atrophy involving the superior, middle, and inferior temporal gyri; hippocampus; and parahippocampal gyrus in cases with fluent PPA, and SPECT images have shown reduced uptake in the same regions (20). Because the NAA/Cr peak ratio in the right perisylvian region was the only peak ratio that was significantly different in CBD and PPA, NAA may have decreased more in the right perisylvian fissure, although NAA in the other regions also seemed to have decreased. This low NAA/Cr ratio suggests right perisylvian neuronal degeneration without left perisylvian change.
At the least, the findings in the present study demonstrate the existence of patients in whom right perisylvian degeneration is more prominent than left perisylvian change. This observation indicates that 1H-CSI has the potential to depict pathophysiologic changes without morphologic alternation in vivo. 1H-CSI may also become a useful clinical tool in detecting PC in the early stages and in monitoring disease progression. However, our preliminary results suggest that further 1H-CSI studies of PC are needed to determine its usefulness a diagnostic tool.
Conclusion
Reduced NAA values in the right hemisphere of patients with PC suggest the presence of neurodegenerative change, and this observation may reflect the existence of patients in whom the right hemisphere is dominantly affected, compared with the left hemisphere. The use of 1H-CSI to examine PC provided information that could not be obtained by using other imaging techniques. Thus, 1H-CSI may provide useful information for understanding the pathologic process underlying PC.
References
- Received January 29, 2001.
- Accepted after revision April 12, 2002.
- Copyright © American Society of Neuroradiology
In this issue


Jump to section
Related Articles
Cited By...
- No citing articles found.