
Abstract
BACKGROUND AND PURPOSE: Responses of the auditory cortex to sound during sleep have been explored with somewhat discrepant results. The purpose of this study was to investigate the effect of stage 1 sleep on signal intensity changes in the auditory cortex in response to pure tone stimulus measured by functional MR imaging.
METHODS: Six sleep-deprived subjects were exposed to a series of echo-planar images for 30–40 minutes. No medication was used to help the subjects go to sleep. A long repetition time of 12 seconds and a 1.9-second clustered multisection acquisition were used to minimize the effect of imager acoustic noise from the preceding acquisition and to make it possible to obtain electroencephalographs between image acquisitions. A pure tone stimulus (beep, 1,000-Hz sine waves, 30-millisecond duration, five beeps per second) was alternated with the baseline every 36 seconds.
RESULTS: All subjects fell asleep. The effect of habituation evaluated by comparing the percentage of signal intensity change between the first and second half was not significant. The percentage of signal intensity changes in the right and left transverse temporal gyri were 0.49% and 0.43% during wakefulness and 0.05% and 0.07% during stage 1 sleep. The differences between wakefulness and stage 1 sleep were significant.
CONCLUSION: Transition to stage 1 sleep coincides with a decrease in functional MR imaging-determined signal intensity changes in the auditory cortex in response to pure tone stimulus. The limited response of the brain at this stage may protect the brain from sound and facilitate deepening of the sleep stage.
Sleep, once regarded as a passive process reflecting a decreased excitation of the ascending reticular activating system, is now thought to be induced by an active mechanism that inhibits the system. During this active procedure, how does the brain respond to outside stimuli that may interfere with sleep? For instance, relay neurons in the lateral geniculate nucleus switch to a different mode when sleep begins (1, 2). How the brain responds to auditory stimuli during sleep is part of this problem; however, to the best of our knowledge, only two neuroimaging reports dealing with this problem have been published (3, 4). Both of these studies used functional MR imaging (fMRI) and showed somewhat discrepant results for responses of the auditory cortex to auditory stimuli during sleep.
To obtain additional data, we also used fMRI to measure responses of the auditory cortex to auditory stimuli during sleep. Our study, however, differed from the two previous studies in several respects. We used pure tones as stimuli, because text reading used in one of the previous studies may be differently processed in different languages and the cognitive components of the text reading may interfere with analysis of the effects of sound components on the auditory cortex during wakefulness and sleep. Another difference was that we obtained 16 sections at one time, which encompassed the whole area of the auditory cortex. In contrast to the study by Portas et al (3), we used a long repetition time of 12 seconds and clustered multisection acquisition. Noise-free intervals with this strategy is thought to lessen the adverse effects of MR system acoustic noise, such as masking sound stimuli and saturation of auditory neuronal or hemodynamic responses. Finally, we concentrated on stage 1 sleep or drowsiness, because this stage of sleep is the entry to deep sleep and we were interested in how the brain copes with sound, which is one of the impediments to sleep, at the beginning of sleep.
The purpose of this study was therefore to investigate the effect of stage 1 sleep on signal intensity changes in the auditory cortex in response to pure tone stimuli measured by means of fMRI.
Methods
Subjects
This study followed the declaration of Helsinki principles (5). Informed consent was obtained from all subjects after the procedure and potential risks and discomfort had been explained. Subjects were six sleep-deprived, right-handed men (32 ± 7 years [mean ± SD]) with no history of hearing disorders, neurologic disease, or sleep problems, including sleep apnea. The subjects were in the supine position in the MR system with their eyes closed, with scalp disk electrodes attached for EEG recordings, and with headphones for auditory stimulation. Subjects’ heads were immobilized with pads to minimize motion. No medication was used to help subjects go to sleep.
Auditory Stimulation, Scanning Protocol, and EEG Recording
A pure tone (beep, 1000-Hz sine waves, 30-millisecond duration) was used for the auditory stimulus. The stimulus presentation rate was 5 Hz, which corresponded to 180 beeps per stimulus interval (36 seconds). The tone was generated by a dedicated system (STIM, Neuroscan, Sterling, VA) and delivered binaurally via an air conduction system with a pair of 1.8-meter-long plastic tubes. The stimulus amplitude was 87 dB sound pressure level at the distal end of the pneumatic system as verified by sound pressure measurements (NA-29, Rion, Tokyo, Japan).
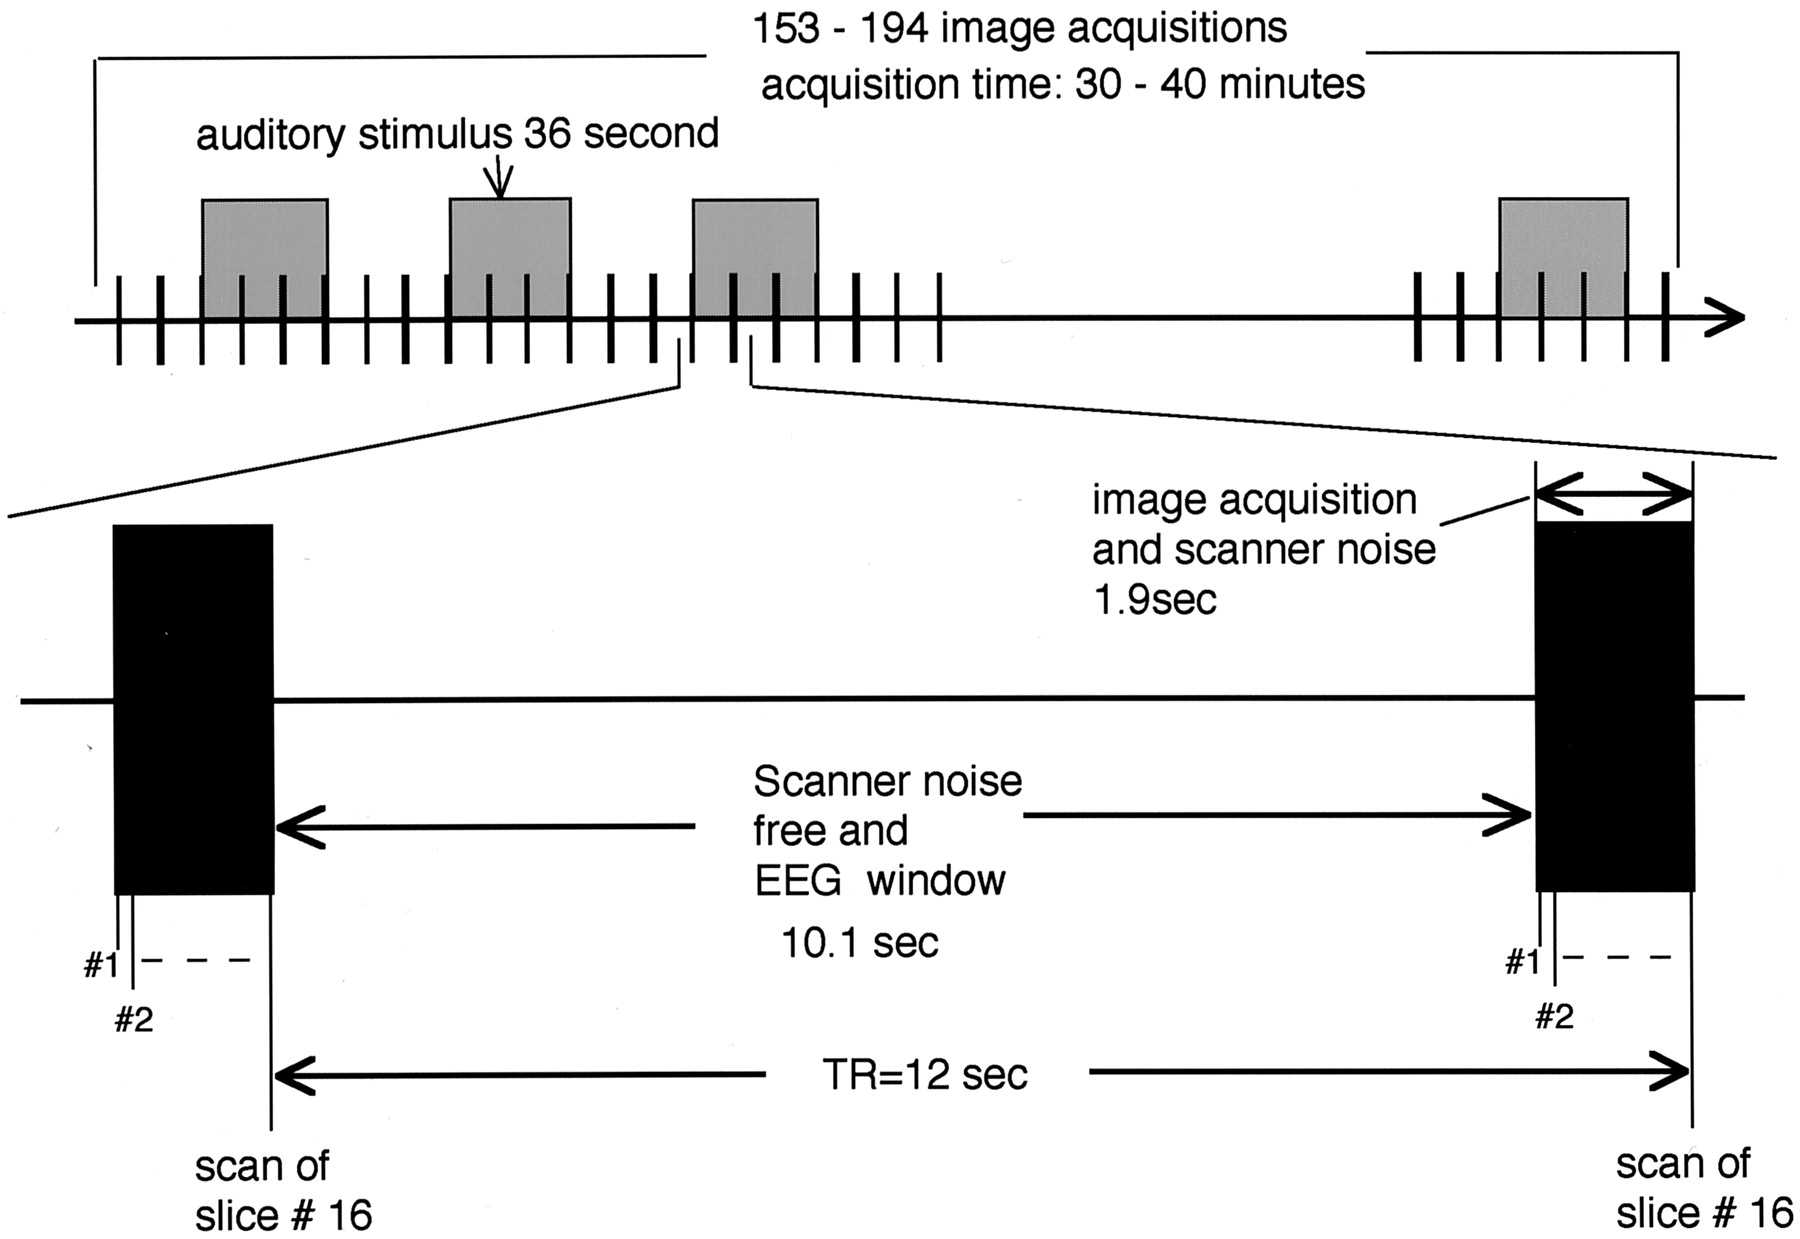
For MR, a superconductive 1.5-T system (Vision, Siemens, Erlangen, Germany) with a CP-head coil was used. Sixteen oblique axial sections were obtained, with the ninth section (counting from the top) positioned so as to cut through the anterior and posterior commissure. Single-shot gradient-echo echo-planar imaging (TR = 12 seconds; TE = 70 milliseconds; flip angle = 90°; matrix = 64 × 64; field of view [FOV] = 200 × 200 mm; section thickness = 3 mm; gap = 1 mm) permitted the acquisition of a set of 16 sections in 1.9 seconds (Fig 1). The acquisition was continued for at least 153 images per section or 30 minutes. When EEG of a subject indicated a sleeping stage at the acquisition of the 153rd image, measurements were continued up to 194 images. The auditory stimulus alternated with the baseline every 36 seconds. The long TR of 12 seconds was chosen to minimize the effect of the imager acoustic noise from the preceding acquisition and to allow for EEG recording between image acquisitions. Three-dimensional anatomic T1-weighted images (TR = 11.4 ms; TE = 4.4 ms; flip angle = 15°; matrix = 200 × 256; FOV = 230 × 230 mm; effective section thickness = 1.14 mm) were also obtained at the end of experiment.

Timing of auditory stimulation, functional MR imaging, and EEG measurements. Black vertical bars indicate echo-planar imaging measurements of 16 sections within 1.9 seconds followed by a noise-free and EEG measurement period of 10.1 seconds. Auditory stimulus was alternated with the baseline every 36 seconds. Acquisition time was 30–40 minutes, or 153–194 image acquisitions.
EEGs were recorded with MR imaging-compatible electrodes (AAA-15203, Nihon-Kohden, Tokyo, Japan) and an EEG recorder (Neurofax, EEG8314, Nihon-Kohden). Six bipolar channels (Fz-Cz, Cz-Pz, C3-P3, P3-O1, C4-P4, P4-O2) were obtained in accordance with 10/20 system (6). EEG leads were disconnected for 2 seconds each time echo-planar images were acquired. For the rest of the time, the EEG leads were connected, thus allowing for EEG recordings lasting around 10 seconds between image acquisitions.
Image Processing and Regions of Interest Definition
MR images were transferred to a PC equipped with SPM99 (http://www.fil.ion.ucl.ac.uk/spm/spm99.html). First, motion was calculated by treating all the echo-planar images (range, 153–194 images) as one session. If the motion of a subject during a session was more than 2 mm, the data for that subject were discarded. If the motion was within the limits, the images were coregistered and resliced to correct the motion (7, 8) and then transferred to another computer (Macintosh G3, Apple Computer, Cupertino, CA) equipped with our software. Before further analysis, regions of interest were defined on the basis of anatomic landmarks. The regions were chosen so as to include the transverse temporal gyrus (Heschl’s gyrus) and its adjacent sulci. The transverse temporal gyrus was selected because it contains the primary auditory cortex. First, five contiguous sections were selected starting with the section showing the upper end of the insular cortex and the four contiguous sections below it. We used Pfeifer’s definition of the transverse temporal gyrus and transverse temporal sulcus, which are defined by a deep, medial commencement from the immediate retroinsular region (9). Of the five sections, the third (counting from the top) was used for defining the region of interest at first, after which regions of interest on contiguous sections were determined with the aid of anatomic landmarks and the previously determined region of interest as references, while 3D T1-weighted images were also used as anatomic references. Figure 2 shows the region of interest for one subject. Region of interest areas were 344 ± 22 pixels (mean ± SD) on the right side and 356 ± 19 pixels on the left, corresponding to 3361 ± 215 mm2 and 3478 ± 186 mm2, respectively.

Regions of interest in one subject. The region of interest were chosen so as to include the transverse temporal gyrus and its adjacent sulci in five contiguous sections.
EEG Evaluation and Grouping of Images
With a different approach, the EEGs recorded between image acquisitions were assessed by a neurologist (M.T.) as wakefulness (presence of alpha wave), stage 1 sleep (a relatively low voltage mixed frequency EEG without alpha waves), stage 2 sleep (presence of sleep spindles and/or K complexes and the absence of high amplitude, slow activity), stage 3 sleep, and stage 4 sleep according to established criteria (10). When a subject showed a state transition, the corresponding image was omitted from evaluation. Because the purpose of this study was to measure the effect of stage 1 sleep on signal intensity change, MR images corresponding to stage 2, 3, and 4 sleep were also discarded.
The question of whether an MR image should be matched to its preceding or following EEG evaluation was decided as follows. The intravascular contribution of venules and veins is the most important factor for defining signal intensity contrast on gradient-echo fMRI (11), and it takes about 1–2 seconds for blood to flow to venules and veins from the capillary bed where oxygen exchange takes place (12). Thus, fMRI contrast could be assumed to reflect the deoxyhemoglobin concentration in the capillary bed about 1–2 seconds before image acquisition. The MR images were therefore matched to their preceding EEG evaluation. Eventually, the images were divided into a wakefulness group and a stage 1 sleep group and then further divided into auditory stimulus on and off subgroups. In other words, the images were divided into “wakefulness and auditory stimulus on” subgroup, “wakefulness and auditory stimulus off” subgroup, “stage 1 sleep and auditory stimulus on” subgroup, and “stage 1 sleep and auditory stimulus off” subgroup. If either of the subgroups contained less than nine images, the group containing that subgroup was excluded from further analysis because reliable results might not be obtained from so few images. The number of images was determined on the basis of our experience. We routinely use an fMRI protocol with nine “auditory stimulus on” images and nine “auditory stimulus off” images and obtained robust results. Because we were not sure whether eight or seven images would be enough to obtain reliable results, we took the conservative approach and set nine images as the minimum.
Evaluation of the Effect of Habituation
Habituation during fMRI, or a decreased fMRI response to the same stimulus presented a number of times, is a well-known phenomenon. We obtained echo-planar images for 30–40 minutes, alternating the same auditory stimulus and baseline every 36 seconds. If habituation is predominant in the fMRI response, the percentage of signal intensity change should show a gradual decline during the measurements. On the other hand, the ratio of wakefulness to sleep is not thought to be uniform during the measurements, with sleep likely to be found more frequently during the latter part of the measurements. In this situation, the effect of habituation may inhibit precise assessment of the effect of sleep. For an extreme example, assuming that sleep versus wakefulness has no effect on fMRI response and that habituation is predominant in the response instead, a reduction in the fMRI response during the latter part of the measurements due to habituation may be erroneously correlated to sleep, which is likely to be more frequently observed during the same period.
The effect of habituation and the effect of the state of consciousness must therefore be measured separately. To attain this goal, the percentage of signal intensity change in each subject was calculated separately for the first and the second half. If habituation is predominant in the fMRI response, the percentage of signal intensity change from the second half should be lower than that from the first half for both wakefulness and stage 1 sleep. If the difference in the state of consciousness is predominant, the percentage of signal intensity change will be determined by the level of consciousness and should not be substantially different between the first and second half. If the effect of habituation determined with this method proves to be insignificant, further analysis would be performed.
Data Analysis
To cancel out signal intensity change trends, the sum total of signal intensities from all pixels was adjusted to the same value for each image at the same location, after which the percentage of signal intensity change between auditory stimulus on and off was calculated for wakefulness and stage 1 sleep. Next, the images were spatially smoothed with the Gaussian kernel (full-width half-maximum = 6 mm). After the correlation coefficients had been determined, pixels showing t > 3.5 were identified, and only clusters of 4 or more pixels were retained. As a result, the calculated significance level in the brain, or corrected P value, was <.05 (13). Both positively and negatively correlating pixels were counted.
As described previously, we first calculated the percentage of signal intensity change for the first and second half separately to determine the effect of habituation. We used two-factor factorial analysis of variance (ANOVA) with the timing of data acquisition (first half versus second half) and state of consciousness (wakefulness versus stage 1 sleep) as the two factors. Right and left cerebral hemispheres were analyzed separately for this study. If the effect of habituation evaluated with this method proves to be insignificant, further analysis would be performed to evaluate the effect of state of consciousness without dividing the data into two halves. We used two-way repeated-measure ANOVA with the state of consciousness (wakefulness versus stage 1 sleep) and the hemisphere as the two factors for the percentage of signal intensity change and correlated pixels. If an effect was detected, the Tukey-Kramer post hoc test was performed. Statistical significance was set at P = .05.
Results
Wakefulness and stage 1 sleep were observed in all subjects and stage 2 sleep in two subjects. Stage 3 and 4 sleep were not observed in our experiments. The number of transitions from sleep to wakefulness was 11 ± 9 (mean ± SD). Although cardiac pulse artifacts had migrated into the EEG recording, EEG interpretation was possible in all cases. Motion during the measurements fell within the predetermined value for all subjects.
Evaluation of the Effect of Habituation
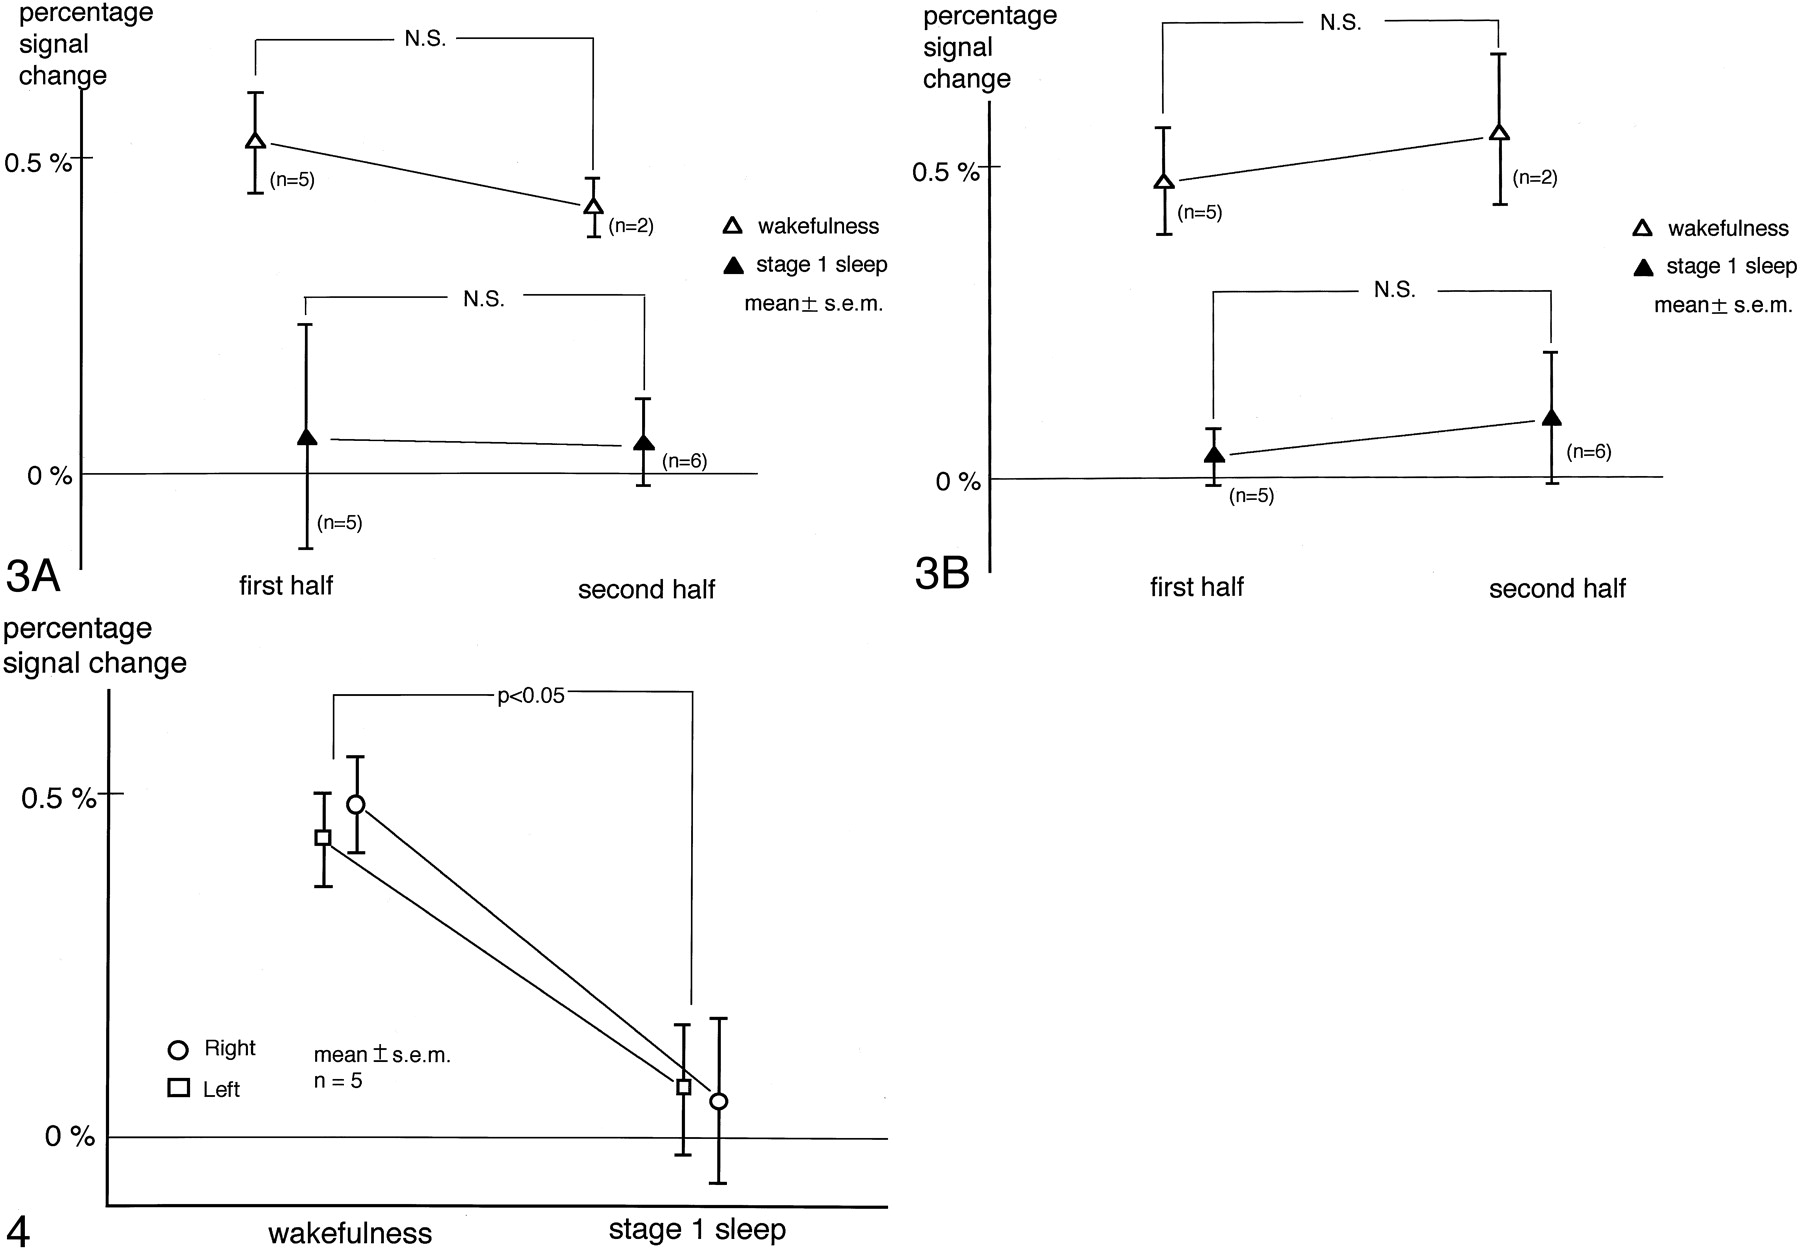
Percentage of signal intensity changes were obtained separately for the first and second half of the measurements. The number of image acquisitions for one subject in the wakefulness subgroup was less than nine for the first half, so these data were not analyzed. Similarly, one subject was excluded from the calculation of stage 1 sleep in the first half and four from that of wakefulness in the second half. Results are shown in Fig 3 (A for the right and B for the left hemisphere). Two-factor factorial ANOVA demonstrated that the effect of the timing of data acquisition was not significant in the right (P = .68) or the left (P = .51) hemisphere. On the other hand, a significant effect of state of consciousness was found in both the right (P = .006) and left (P = .0006) hemispheres. Because the effect of habituation as determined with this method was not significant, further analysis was performed without dividing the data into two halves.

Evaluation of the effect of habituation. Percentage signal intensity changes during the first and second half of the measurements are shown. Panels A and B correspond to the right and left hemispheres, respectively. Two-factor factorial ANOVA demonstrated the effect of the timing of data acquisition was not significant, which implied that the effect of habituation measured with this method was insignificant. On the other hand, the effect of state of consciousness was found to be significant.
Effect of State of Consciousness
In one subject, the number of image acquisitions was less than nine in the wakefulness subgroup, so this state was not analyzed. The percentage of signal intensity change for this subject during stage 1 sleep was 0.07% on either side, and the number of correlated pixels was 0 (positively or negatively correlated on either side). For the other five subjects, the number of image acquisitions in each subgroup was greater than nine, so the percentage of signal intensity change and the number of correlated pixels were measured and compared between states of consciousness, with the results described below.
Percentage of Signal Intensity Change
While the subjects were awake, the percentage of signal intensity change was positive in each hemisphere. When they were in stage 1 sleep, however, the percentage of signal intensity change decreased in nine of the 10 hemispheres and became negative in six of them. The respective percentage of signal intensity changes for the right and left transverse temporal gyri were 0.49 ± 0.07 (mean ± SEM) and 0.43% ± 0.07% during wakefulness and 0.05% ± 0.12% and 0.07% ± 0.10% during stage 1 sleep. Two-way repeated-measure ANOVA revealed a significant effect of state of consciousness, whereas neither the hemisphere (P = .87) nor the interaction between the hemisphere and the state of consciousness (P = .65) had a significant effect. The Tukey-Kramer post hoc test showed that the percentage of signal intensity change during stage 1 sleep was significantly smaller than during wakefulness (Fig 4).

Percentage signal intensity change in the transverse temporal gyri. A significant effect of state of consciousness was revealed by two-way repeated-measure ANOVA. The Tukey-Kramer post hoc test showed that the percentage signal intensity change during stage 1 sleep was significantly smaller than during wakefulness. The overall effect of the hemisphere was not significant.
Correlated Pixels
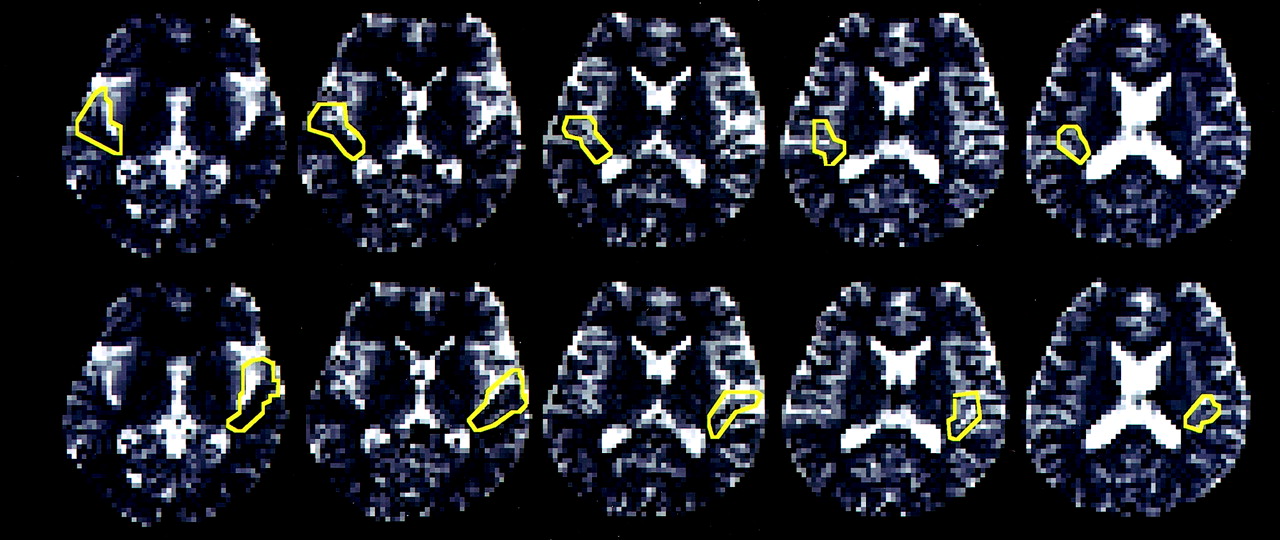
During wakefulness, clusters of positively correlated pixels in the transverse temporal gyri were found in seven of 10 hemispheres of five subjects. During stage 1 sleep, however, such clusters were observed in three of the 10 hemispheres. Clusters of negatively correlated pixels in the transverse temporal gyri were not observed during wakefulness or stage 1 sleep. A representative case is shown in Figure 5. The number of positively correlated pixels in the transverse temporal gyri was 3.8 ± 2.5 (mean ± SEM.) in the right and 10.8 ± 5.3 in the left hemisphere during wakefulness, and 0.6 ± 0.6 in the right and 2.4 ± 1.5 in the left hemisphere during stage 1 sleep. That of negatively correlated pixels was 0.0 ± 0.0 in both hemispheres during both wakefulness and stage 1 sleep. Two-way repeated-measure ANOVA revealed a significant effect of the state of consciousness on activated pixels. Neither the effect of the hemisphere (P = .27) nor the interaction between the hemisphere and the state of consciousness (P = .26) was significant. The Tukey-Kramer post hoc test revealed that the number of positively correlated pixels during wakefulness was significantly larger than the number associated with the other conditions (Fig 6).

Positively or negatively correlated pixels (t >3.5; cluster > = 4 pixels; corrected P value < .05) during wakefulness and stage 1 sleep in one subject. Clusters of positively correlated pixels are seen in the bilateral transverse temporal gyri during wakefulness. No cluster is found during the other conditions.
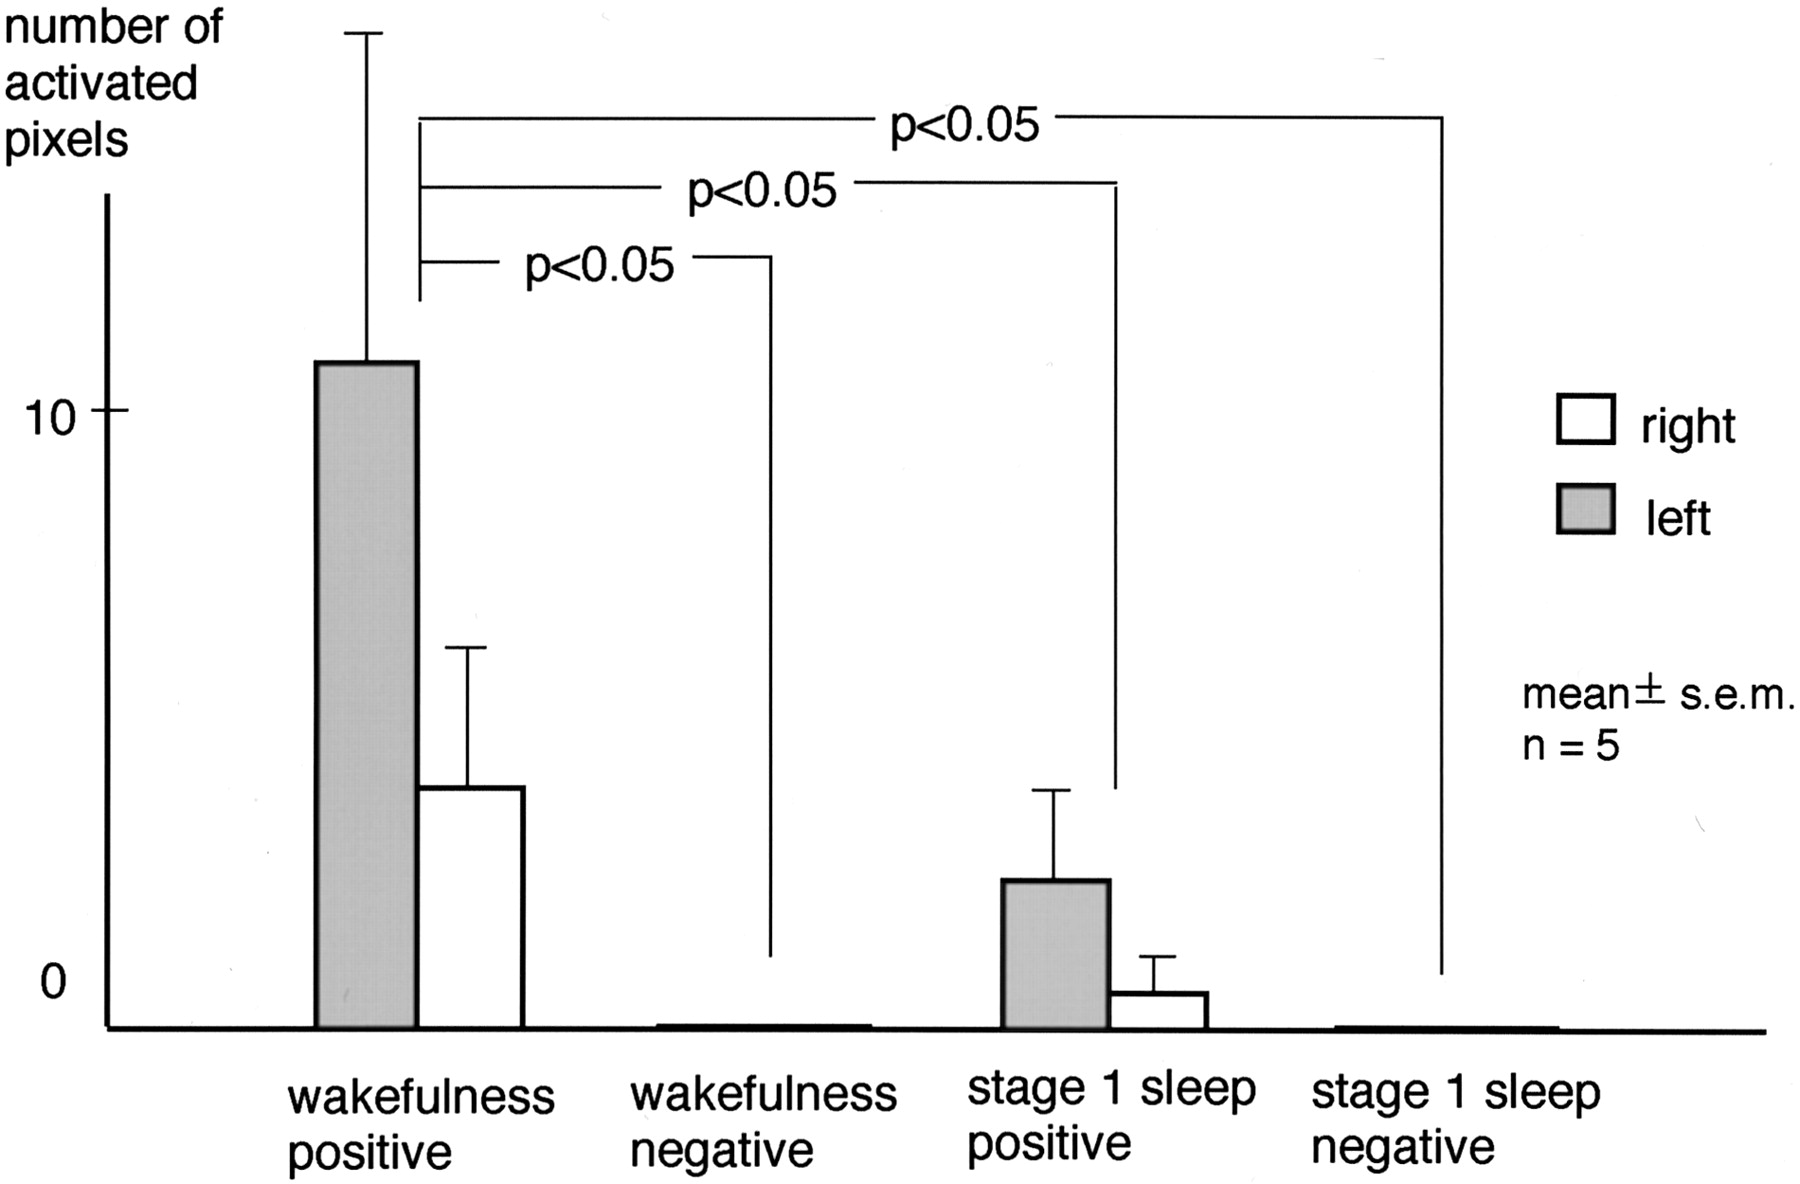
Number of activated pixels in the transverse temporal gyrus. A significant effect of state of consciousness was revealed by two-way repeated-measure ANOVA. The Tukey-Kramer post hoc test showed the number of positively correlated pixels during wakefulness was significantly larger than that under other conditions. The overall effect of the hemisphere was not significant.
Discussion
Brain responses to auditory stimuli during sleep have recently been measured by fMRI with somewhat discrepant results. Portas et al used beeps and the subject’s own first name as auditory stimuli, six-“burst” MR measurements in approximately 17 seconds, and found that “the pattern of brain activation associated with auditory stimulation was strikingly similar in wakefulness and sleep” (3). Their table shows that the maximal Z score at the superior temporal gyrus in response to beeping was almost the same during wakefulness and sleep (3). Subjects in their study spent most of the sleeping time in stages 2 and 3 (3). In contrast, Czisch et al used text reading as auditory stimuli, single-section “silent” gradient echo fast imaging, and showed reduced activation in the auditory cortex during sleep stages 1 and 2 and during slow-wave sleep (4).
This study found that the fMRI response to auditory stimulus in the auditory cortex decreases during stage 1 sleep. To the best of our knowledge, the effect of stage 1 sleep or drowsiness on the auditory cortex has not been previously reported. The decrease in fMRI response in the auditory cortex at this stage may protect the sleeping brain from sound. This finding may also be important for establishing an fMRI protocol. For example, when a subject becomes drowsy during an experiment involving a passive listening paradigm, it is difficult to determine whether the decrease in fMRI response is due to state of consciousness or other parameters in the experiment. In such a situation, it may be necessary to monitor the vigilance of subject or to take steps to keep the subject alert.
Our finding is consistent with that reported by Czisch et al, but not with that reported by Portas et al (3, 4). The reason for this discrepancy is not known, but it may be due to differences in acoustic noise. Portas et al used six-“burst” echo-planar imaging in approximately 17 seconds and replayed MR system noise between MR measurements (3), so the subjects heard continuous MR system noise. On the other hand, Czisch et al used single-section “silent” gradient echo fast imaging, which resulted in a noise reduction around 30 dB at 1.5 kHz compared with echo-planar imaging (4). We used a long TR of 12 seconds and clustered multisection acquisition to create noise-free intervals between scans. Continuous and loud acoustic scanner noise with echo-planar imaging as used by Portas et al (3) may increase resting activation and signal intensity change during sleep. In other words, such noise might make auditory cortex as “wakefulness” even when EEG, A1, A2, C3, and C4 in their study (3) showed sleep stage.
The reduction in fMRI response during stage 1 sleep can be accounted for as follows. Auditory stimuli as well as those of other senses are relayed by the thalamus. Input to the thalamic neurons is not altered by state of consciousness (14). There are, however, two modes by which thalamic neurons relay sensory input, the tonic mode and the burst mode (1, 2). The former mode is activated during wakefulness and sensory input is relayed faithfully to the cortex, whereas the latter mode is observed during sleep and sensory input is only partially transmitted. This obliteration of synaptic transmission occurs at the first EEG signs of drowsiness (14). The transfer ratio in the lateral geniculate body of the cat was found to decline to about 0.7 during drowsiness from 1 during wakefulness (1). Presumably, the same obliteration occurs in the medial geniculate body of human, thus reducing neuronal activity and fMRI response in the auditory cortex during stage 1 sleep.
There are several limitations to our study. One is the relatively small sample size. Statistical significance was obtained, however, so this limitation did not seem to severely affect the results. Another limitation is that pulse artifacts due to pulsatile blood flow migrated into the EEG (15). Nevertheless, EEG interpretation was possible despite the presence of these artifacts. Alpha waves are most prominent in the occipital lobes, where the pulse artifact is weaker than in the frontal area (15). This favored the EEG interpretation in our experiment. Another limitation is the method of defining the region of interest, which in our study consisted of drawing the region of interest for each subject. Although anatomic landmarks were used, this procedure was operator dependent. Another way to analyze data is to normalize every subject’s brain into a standardized brain and then measure signal intensity change or other parameters; however, transverse temporal gyri show major intersubject variations—for example, the number of transverse temporal gyri varies from 1 to 3 (16). Because we were not sure this intersubject variability could be expressed properly in a standardized brain, we did not adopt this approach.
Conclusion
Transition to stage 1 sleep coincides with a decrease in fMRI-determined signal intensity changes in the auditory cortex in response to pure tone stimulus. Limited response of the brain at this stage may protect the brain from arousing effect of sound and facilitate deepening sleep stages.
Footnotes
This study was supported by grants-in-aid for scientific research from the Ministry of Education, Science, Sports and Culture of Japan (12670870).
References
- Received April 13, 2003.
- Accepted after revision June 26, 2003.
- Copyright © American Society of Neuroradiology
In this issue


Jump to section
Related Articles
Cited By...
- No citing articles found.