
Abstract
BACKGROUND AND PURPOSE: Metastasis to the regional cervical lymph nodes may be associated with alterations in water diffusivity and microcirculation of the node. We tested whether diffusion-weighted MR imaging could discriminate metastatic nodes.
METHODS: Diffusion-weighted echo-planar and T1- and T2-weighted MR imaging sequences were performed on histologically proved metastatic cervical lymph nodes (25 nodes), benign lymphadenopathy (25 nodes), and nodal lymphomas (five nodes). The apparent diffusion coefficient (ADC) was calculated by using two b factors (500 and 1000 s/mm2).
RESULTS: The ADC was significantly greater in metastatic lymph nodes (0.410 ± 0.105 × 10⁻³ mm2/s, P < .01) than in benign lymphadenopathy (0.302 ± 0.062 × 10⁻³ mm2/s). Nodal lymphomas showed even lower levels of the ADC (0.223 ± 0.056 × 10⁻³ mm2/s). ADC criteria for metastatic nodes (≥ 0.400 × 10⁻³ mm2/s) yielded a moderate negative predictive value (71%) and high positive predictive value (93%). Receiver operating characteristic analysis demonstrated that the criteria of abnormal signal intensity on T1- or T2-weighted images (Az = 0.8437 ± 0.0230) and ADC (Az = 0.8440 ± 0.0538) provided similar levels of diagnostic ability in differentiating metastatic nodes. The ADC from metastatic nodes from highly or moderately differentiated cancers (0.440 ± 0.020 × 10⁻³ mm2/s, P < .01) was significantly greater than that from poorly differentiated cancers (0.356 ± 0.042 × 10⁻³ mm2/s).
CONCLUSION: Diffusion-weighted imaging is useful in discriminating metastatic nodes.
For detection of metastatic nodes in the neck, cross-sectional imaging techniques such as MR imaging, CT, and sonography provide, in part, satisfactory outcomes (1). To further overcome the many problems associated with each of these imaging techniques for detecting metastatic nodes in the neck of patients with head and neck cancer, several attempts have been performed, including combinations of imaging techniques (2), use of a contrast medium (3), and the combination of imaging and surgical procedure (4).
Lymph node size is one of the most frequently used criteria for discriminating metastatic from nonmetastatic (benign reactive) nodes in the neck (5–7). Furthermore, in CT and sonography, internal architectural evaluation was found to be beneficial for the detection of metastatic nodes (2, 5, 8). In MR imaging, the use of conventional imaging sequences does not seem to significantly exceed that of CT (9). However, the use of specific techniques, such as diffusion-weighted imaging (10) and magnetization transfer imaging (11), may improve the performance of MR imaging in discriminating metastatic nodes in the neck.
Diffusion-weighted imaging is based on intravoxel incoherent motion imaging, which allows visualization of molecular diffusion and microcirculation of the blood in the capillary network (perfusion) of biologic tissues. Cancer metastasis to the regional lymph nodes may be associated with alterations in water diffusivity and microcirculation of the node. The purpose of this study was to determine whether the apparent diffusion coefficient (ADC) could discriminate metastatic nodes in the neck.
Methods
Patients
MR imaging was performed on consecutive patients with head and neck squamous cell carcinoma or with enlarged neck nodes clinically suggestive of malignancy such as nodal lymphomas. We first performed T1- and T2-weighted imaging and then diffusion-weighted imaging on these consecutive patients. Of these patients, we removed from the study cohort those whose MR images were poor in quality because of low signal-to-noise ratios particularly in small nodes or because of artifacts. Thus, the population comprised 17 patients (38–80 years of age) with head and neck squamous cell carcinoma, 11 patients (24–80 years of age) with benign lymphadenopathy, and three patients (53–73 years of age) with nodal lymphoma. Consequently, we imaged 25 metastatic nodes, 25 benign lymphadenopathy, and five lymphomas in the neck. All these nodes were surgically removed or underwent biopsy and were histopathologically proved. The nodes with benign lymphadenopathy were therefore imaged because they were clinically very suggestive of malignancy mainly due to their large sizes. Of the squamous cell carcinomas in 17 patients, nine were well differentiated (14 nodes), two moderately differentiated (two nodes), and six poorly differentiated (nine nodes) carcinomas. The primary cancers arose in the oropharynx (five patients), gingiva (five patients), oral floor (three patients), tongue (two patients), buccal mucosa (one patient), and external auditory canal (one patient). The histologic types of the lymphomas were four diffuse B cell lymphomas and one anaplastic large cell lymphoma. The maximum diameters of the nodes on MR images were 2.4 ± 0.9 cm (1.0–4.9 cm, metastatic nodes), 1.5 ± 0.5 cm (1.0–2.5 cm, inflammatory nodes), and 2.4 ± 0.8 cm (1.6–3.4 cm, nodal lymphomas). We obtained institutional review board approval from our hospital and informed consent from the participants.
MR Imaging
Axial T1-weighted images (TR/TE/excitations = 500 or 550/14/2 or 3) of the cervical lymph nodes were obtained with a 1.5-T MR imager (Signa Horizon LX 1.5T CV/NV, GE Medical Systems, Milwaukee, WI) by using a conventional spin-echo sequence and a neurovascular array coil. Axial, with or without fat suppression, T2-weighted (3000–3400/104/2) images were obtained by using a fast spin-echo sequence. Gadolinium-enhanced (gadopentetate dimeglumine; Magnevist, Nihon Schering, Osaka, Japan), with or without fat suppression, T1-weighted (400 or 500/14/2 or 3) images were obtained by using a conventional spin-echo sequence. For all of these sequences, the section thickness was 5 mm. MR imaging was performed with a matrix of 256 × 224, field of view of 24 × 24 or 20 × 20 cm2, and an intersection gap of 1 mm.
Axial diffusion-weighted images of the cervical lymph nodes were obtained with a single-shot, spin-echo type of echo-planar imaging sequence (GE Yokogawa Medical Systems, Tokyo, Japan) by using a neurovascular array coil. The sequence was repeated for two values of the motion-probing gradients (b = 500 and 1000 s/mm2). Imaging was performed with the following parameters: TR/TE = 10,000/64 for b = 500 s/mm2 and 10,000/74 for b = 1000 s/mm2. The motion-probing gradients were placed on the three directions with the same strength. To increase the signal-to-noise ratio, the sequence was repeated four times for each imaging (number of excitations = 4). The section thickness was 5 mm. Diffusion-weighted MR imaging was performed with a matrix of 128 × 128, field of view of 24 cm2, and an intersection gap of 1 mm.
Topographic correlation between excised or biopsied nodes and MR images was performed per node by using a reporting system in which data concerning the approximate location relative to the surrounding anatomic structures, such as vessels and muscles, and the size of the nodes on MR images were described. At surgery, the lymph nodes were excised en bloc along with the adjacent reference structures to easily ascertain the spatial relationship between the excised nodes and the surrounding structures. Surgeons compared and identified the excised nodes with MR images by using this report as a reference. Biopsy was performed with reference of MR images and reports, and it was not difficult to identify the nodes for biopsy with MR images.
MR Image Analysis
MR studies were performed before any surgical intervention including biopsy without knowledge of hiostopathologic diagnosis, and the ADC value was determined by a single radiologist (M.S.).
ADC was calculated by the following formula: 
where b1 and b2 are gradient factors of sequences S1 and S2, and SI1 and SI2 are signal intensities by sequence S1 and S2, respectively. Analysis was performed in regions of interest (ROIs) placed in each of the lymph nodes. Each ROI was placed manually in the lymph node on one to four sections that contained the maximal area of the node. Each ROI was variable so that it included as much of the nodal parenchyma as possible. The ADCs were expressed as means ± standard deviations. We chose the optimum ADC threshold that yielded the highest accuracy among varying ADC values.
Receiver Operating Characteristic Curve Analysis
We performed averaged receiver operating characteristic (ROC) curve analysis for the presence or absence of abnormal signal intensity in the nodes and for the ADC values. A hypointense area on the T1-weighted image that did not enhance after injection of contrast material and a focal heterointense or hyperintense area on the T2-weighted image were considered to indicate abnormal signal intensity of the node, as described previously (9). MR images were presented to four radiologists who were experienced in MR imaging in the head and neck region and who had not previously seen these cases and were not aware of any information about the patients. The four observers were asked to score the abnormal signal intensity of the nodes on MR images by using a five-point rating scale: 1 = definitely not present, 2 = probably not present, 3 = unclear if the abnormal signal intensity is present or not, 4 = probably present, 5 = definitely present.
A binormal ROC curve was fitted to each observer’s rating data on abnormal signal intensity in the node and to the ADC values calculated by the single, separate radiologist, by using ROCKIT software (12). The diagnostic performance of each imaging technique was determined by calculating the area under each observer-specific ROC curve (Az value) (13). Az values were expressed as means ± standard errors, and the significance of difference in Az value between the imaging criteria (abnormal signal intensity in the node on T1- or T2-weighted images and the ADC values) was tested by Student’s t test for each observer.
Sensitivity and specificity and positive and negative predictive values for abnormal signal intensity in the node and ADCs in diagnosing metastatic nodes were calculated.
We calculated the sensitivity (number of nodes positive at both imaging and histology divided by number of nodes positive at histology) and specificity (number of nodes negative at both imaging and histology divided by number of nodes negative at histology) after placing varying thresholds of ADC value for discrimination of metastatic from nonmetastatic nodes, or after placing tentative criteria that probable or definite (ratings of 4 or 5) presence of abnormal signal intensity in the node on T1- or T2-weighted images means nodal metastasis. The accuracy was calculated by the following formula: (number of nodes positive at both imaging and histology plus number of nodes negative at both imaging and histology) divided by total number of nodes.
Negative predictive values and positive predictive values were also used to assess the performance of the MR imaging criteria in the detection of metastatic nodes. The negative predictive value is the percentage of nodes interpreted by using the MR imaging criteria as negative for metastasis that were positive histopathologically. The positive predictive value is the percentage of nodes interpreted as positive for metastasis that were histopathologically proved to be metastasized.
Multivariate Logistic Regression Analysis
Logistic analysis was performed to identify MR imaging characteristics that could be used as predictive indicators for differentiating metastatic from nonmetastatic cervical lymph nodes. MR images that were found to be important at univariate analysis were entered into multivariate models to determine their independent predictive value. Analysis was performed with the statistical software package SPSS for Macintosh, version 6.1 (SPSS, Chicago, IL).
Data Analysis
Significance in the ADCs between the different patient groups and between the nodes metastatic from highly or moderately differentiated and poorly differentiated carcinomas was determined with the Mann-Whitney U test, by using a commercially available statistical software (StatView 4.51; Abacus Concepts, Inc., Berkeley, CA).
Results
Internal Architectures in the Nodes on T1- and T2-Weighted Images
Abnormal MR signal intensity in the nodes was typically shown as an area of low signal intensity on the T1-weighted image that did not enhance after injection of contrast material (Fig 1A and C) and a focal inhomogeneous or high-signal-intensity area on the T2-weighted image (Fig 1B). These internal architectural abnormalities appeared in 17 (68%) of the 25 metastatic nodes, two (8%) of the 25 nodes with benign lymphadenopathy (Fig 2), and none (0%) of the five nodal lymphomas.

66-year-old woman with well-differentiated squamous cell carcinoma of lower gingiva.
A, Axial T1-weighted MR image of metastatic submandibular node (arrow) shows homogeneous intermediate signal intensity.
B, Axial T2-weighted, fat-suppressed MR image of the same metastatic node shows focal hyperintensity in the node (arrow).
C, Axial fat-suppressed, gadolinium-enhanced T1-weighted MR image shows a nonenhanced area in the node (arrow).

34-year-old man with benign lymphadenopathy (lymphoid hyperplasia) of the bilateral jugulodigastric nodes.
A, Axial T1-weighted MR image shows homogeneous (except for hilum signal intensity) nodes (arrows).
B, Axial T2-weighted MR image shows homogeneous nodes (arrows).
C, Axial fat-suppressed, gadolinium-enhanced T1-weighted MR image shows homogeneously enhanced (except for hilum signal intensity) nodes (arrows).
Diffusion-Weighted MR Imaging of Cervical Lymph Nodes
Diffusion-weighted echo-planar imaging successfully depicted the metastatic nodes (Fig 3), benign lymphadenopathy (Fig 4), and nodal lymphomas (Fig 5); with increases in b factors, the signal intensity from the nodes gradually decreased, while the node contour was readily detectable even at the b factor of 1000 s/mm2. Given satisfactory diffusion images of the nodes, we calculated the ADCs of the nodes on these images, by using two b factors of 500 and 1000 s/mm2 (Fig 6). The ADC of the metastatic nodes (0.410 ± 0.105 × 10⁻³ mm2/s) was significantly (P < .01, Mann-Whitney U test) higher than that of the inflammatory nodes (0.302 ± 0.062 × 10⁻³ mm2/s). Nodal lymphomas showed even lower levels of ADCs (0.223 ± 0.056 × 10⁻³ mm2/s) relative to those of benign lymphadenopathy (P < .05).

71-year-old woman with well-differentiated squamous cell carcinoma of maxilla.
A, Axial T2-weighted MR image of metastatic buccinator node (arrow) shows a large, hyperintense necrotic area.
B, Axial diffusion-weighted echo-planar MR image, at b factor of 500 s/mm2, of metastatic node (arrow) shows hyperintensity of the node.
C, Axial diffusion-weighted echo-planar MR image, at b factor of 1000 s/mm2, of metastatic node (arrow) shows nodal signal intensity with a central hypointense area. A large reduction in signal intensity on the image at b 1000 s/mm2 compared with the image at b 500 s/mm2 results in an elevated ADC (0.410 × 10⁻³ mm2/s).

20-year-old man with benign lymphadenopathy in neck.
A, Axial T2-weighted MR image shows an inflammatory jugulodigastric node (arrow) with homogeneous signal intensity.
B, Axial diffusion-weighted MR image at b factor of 500 s/mm2 of benign lymphadenopathy (arrow) shows homogeneous hyperintensity.
C, Axial diffusion-weighted echo-planar MR image at b factor of 1000 s/mm2 of benign lymphadenopathy (arrow) shows a defined area of hyperintensity. An intermediate reduction in signal intensity on the image at b 1000 s/mm2 compared with the image at b 500 s/mm2 results in a moderate ADC (0.335 × 10⁻³ mm2/s).

56-year-old woman with diffuse large B cell lymphoma.
A, Axial T2-weighted MR image shows lymphoma in jugulodigastric node (arrow) with homogeneous signal intensity.
B, Axial diffusion-weighted echo-planar MR image at b factor of 500 s/mm2 of nodal lymphoma (arrow) shows hyperintensity.
C, Axial diffusion-weighted echo-planar MR image at b factor of 1000 s/mm2 of nodal lymphoma (arrow) shows a defined area of hyperintensity. A small reduction in signal intensity on the image at b 1000 s/mm2 compared with the image at b 500 s/mm2 results in a low ADC (0.258 × 10⁻³ mm2/s).

Graph (box plots) shows ADCs of metastatic nodes, nodal lymphomas, and nodes with benign lymphadenopathy. The horizontal line is a median (50th percentile) of the measured values, the top and bottom of the box represent 25th and 75th percentiles, respectively, and whiskers indicate the range from the largest to smallest observed data points within 1.5 interquartile range presented by the box. Note that ADCs of metastatic nodes are significantly higher than those of nodes with benign lymphadenopathy (P < .01, Mann-Whitney U test).
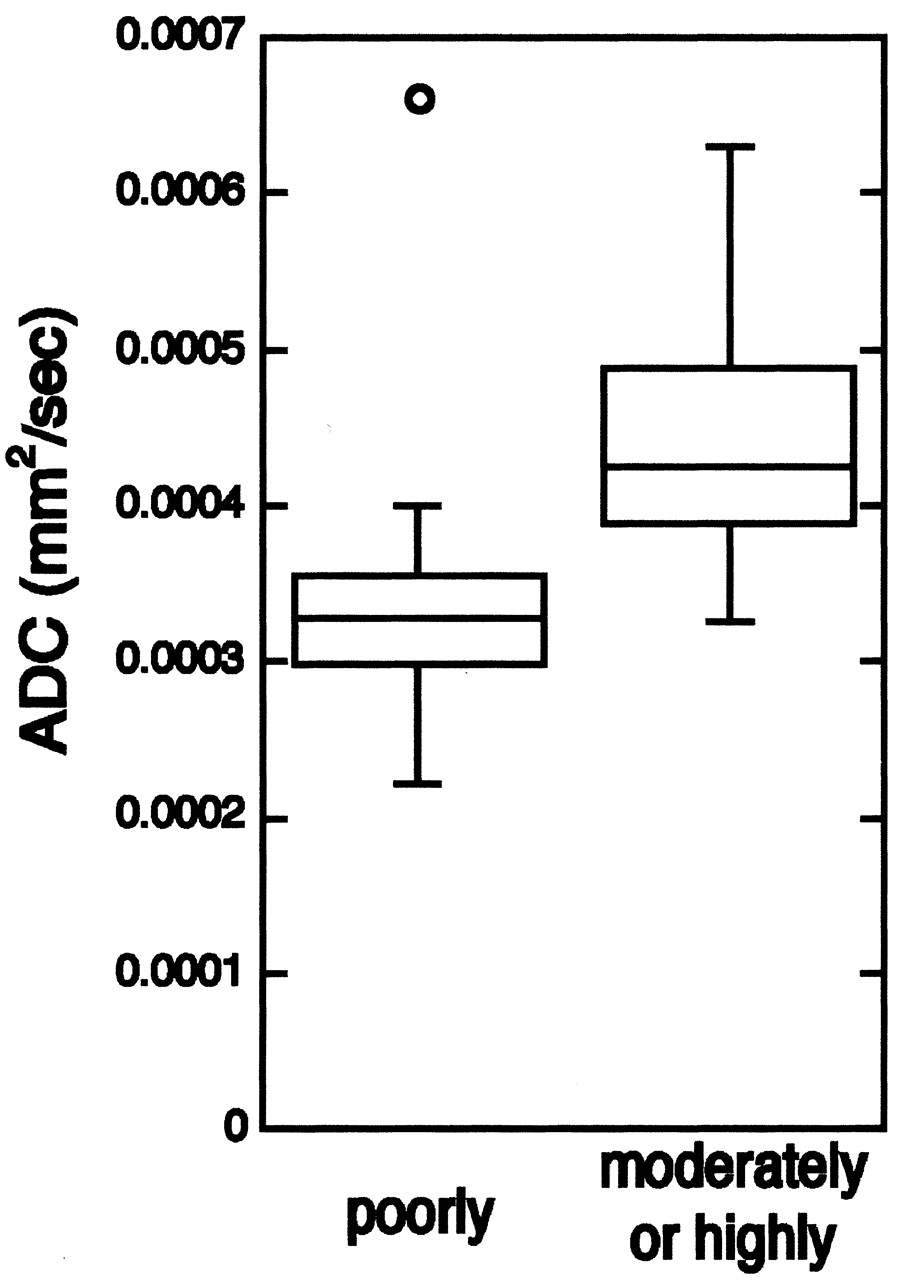
A previous report showed that highly differentiated carcinomas exhibit higher ADCs than poorly differentiated carcinomas (10). Therefore, we argued that metastatic nodes from highly differentiated carcinomas may display higher ADCs than those from poorly differentiated carcinomas. We found that highly or moderately differentiated carcinomas demonstrated significantly higher ADCs (0.440 ± 0.020 × 10⁻³ mm2/s) than those of poorly differentiated carcinomas (0.356 ± 0.042 × 10⁻³ mm2/s) (Mann-Whitney U test, P < .01) (Figs 7 and 8).

Graph (box plots) shows ADCs of poorly differentiated and of moderately or highly differentiated squamous cell carcinomas metastasized to cervical lymph nodes. Note that ADCs of metastatic nodes from poorly differentiated cancers are significantly lower than those from moderately or highly differentiated cancers (P < .01, Mann-Whitney U test).

Photomicrographs show metastatic lymph nodes from poorly (A) and highly (B) differentiated squamous cell carcinomas.
A, Poorly differentiated cancer cells with high nuclear-to-cytoplasmic ratios are densely packed in metastatic node.
B, Highly differentiated cancer cells are loosely packed, and amorphous materials (*), probably produced by cancer cells, and fibrous tissues (**) are frequently observed. (Hematoxylin and eosin, original magnification ×200)
Diagnostic Ability of the MR Imaging Criteria in Discriminating Metastatic Nodes
To assess diagnostic ability of the MR imaging criteria in discriminating metastatic nodes in the neck, we first performed multivariate analysis to test significance of the contribution of size criteria (short and long axis diameters), ADC values, and abnormal signal intensity on T1- and T2-weighted images. Univariate analysis demonstrated that all these criteria were significantly correlated to metastatic nodes (Table 1). However, multivariate analysis demonstrated that only ADC values and abnormal signal intensity on T1- and T2-weighted images were significantly correlated to metastatic nodes. These findings suggest that if these MR imaging criteria were used in combination, the criteria other than ADC values and abnormal nodal signal intensity may not significantly contribute to the diagnosis of metastatic nodes.
Univariate and multivariate logistic regression analysis of MR imaging features of metastatic nodes, benign lymphadenopathy, and nodal lymphomas in the neck
We next assessed the diagnostic ability of the MR imaging criteria in discriminating metastatic nodes on the basis of internal architecture of the nodes as assessed by abnormal signal intensity in the nodes on T1- and T2-weighted images, and on the basis of ADC values. To this end, we first calculated sensitivity, specificity, and positive and negative predictive values. When a node was diagnosed as metastatic if it exhibited abnormal signal intensity on T1- or T2-weighted images, we obtained moderate sensitivity (68.0%) and negative (77.8%) and positive (89.5%) predictive values, and high specificity (93.3%). However, when an ADC value greater than 0.400 × 10⁻³ mm2/s was used as the threshold for metastatic nodes (this threshold was chosen because it yielded the highest accuracy in discriminating metastatic nodes), we obtained low to moderate sensitivity (52.0%) and negative predictive value (70.7%), and high specificity (96.7%) and positive predictive value (92.9%). Lowering the ADC threshold to 0.350 and 0.300 × 10⁻³ mm2/s resulted in higher sensitivity (68.0% and 88.0%, respectively), lower specificity (83.3% and 60.0%, respectively), lower positive predictive value (77.3% and 64.7%, respectively), and higher negative predictive value (75.8% and 85.7%, respectively).
The nodes exhibiting abnormal signal intensity on T1- and/or T2-weighted images were associated with significantly higher ADC values (ADC = 0.438 ± 0.023 × 10⁻³ mm2/s; P < .001, Mann-Whitney U test) than those of the nodes without abnormal signal intensity on the MR images (ADC = 0.294 ± 0.011 × 10⁻³ mm2/s).
We further tested the diagnostic ability of the MR imaging criteria for detection of metastatic nodes by performing ROC analysis. The MR imaging criteria of abnormal signal intensity in the nodes on T1- or T2-weighted images and the ADC values on diffusion-weighted images provided equivalent levels of Az values: 0.8437 for the abnormal signal intensity in the node and 0.8440 for the ADC value (Student’s t test, P = .99) (Fig 9).
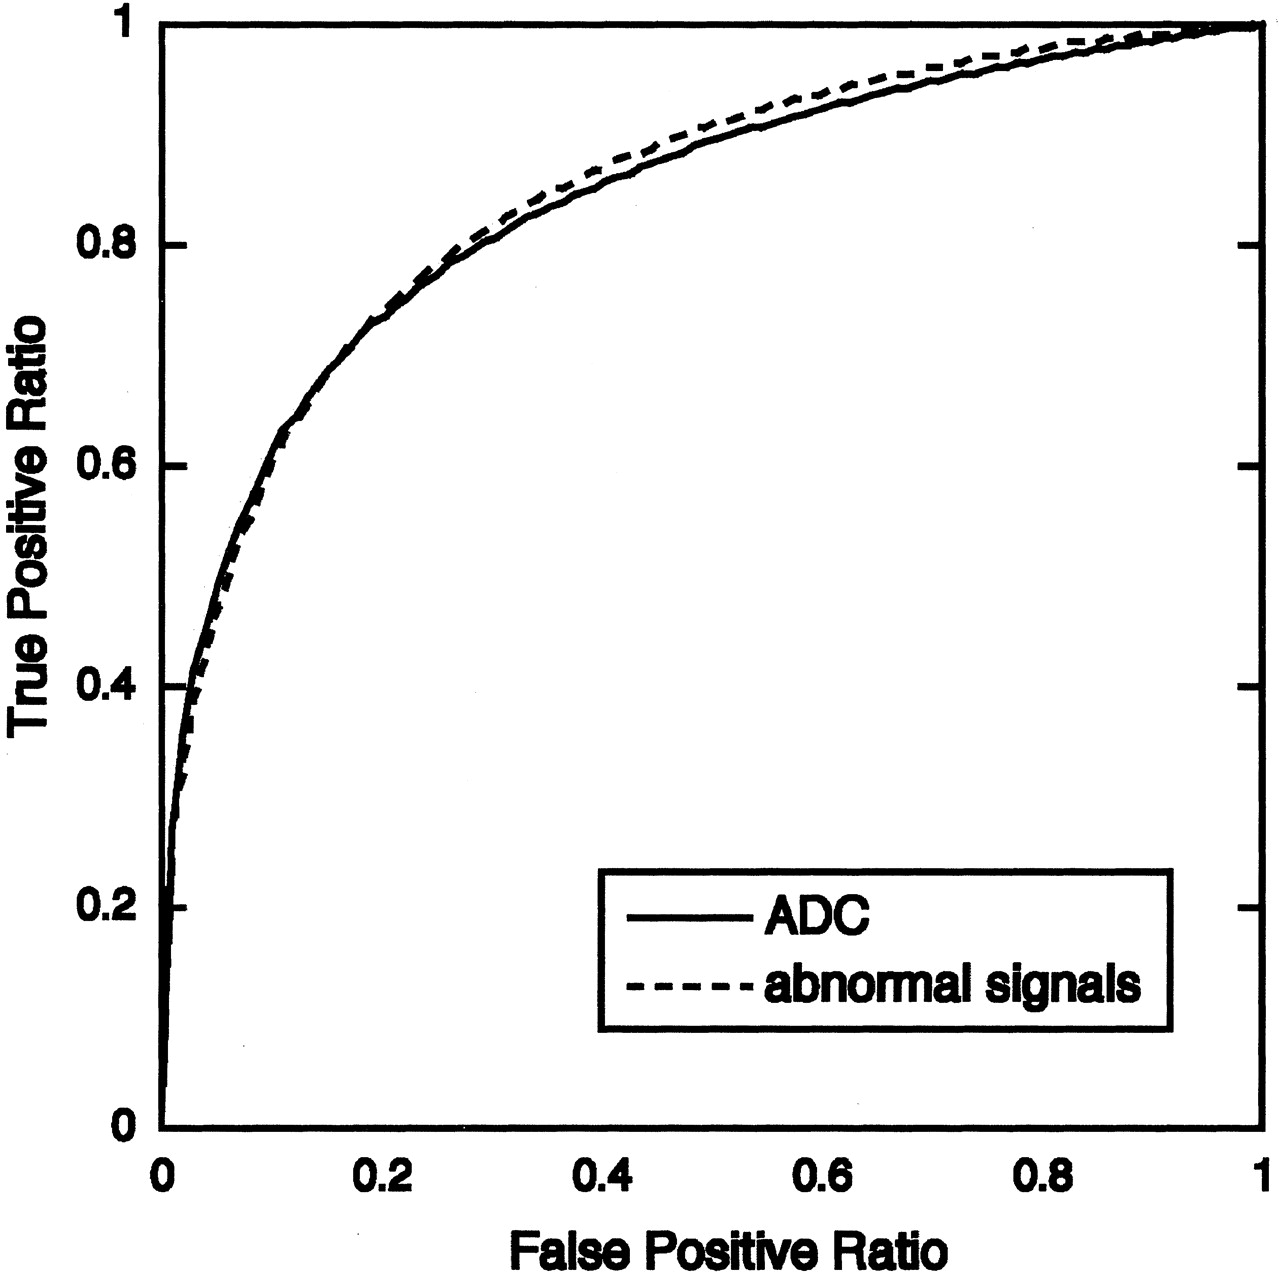
Graph shows averaged ROC curves for MR diagnostic criteria by using ADC or internal architectural abnormality (abnormal signal intensity) of nodes. Az values calculated from ROC curves indicate that diagnostic ability using either of these criteria are at similar levels: Az value (ADC) = 0.8440 ± 0.0538, and Az value (abnormal signal intensity) = 0.8437 ± 0.0230.
Discussion
We have shown in this preliminary report that the ADC calculated on diffusion-weighted MR images discriminated successfully the metastatic lymph nodes in the neck. The ADC criterion performed as efficiently as the criterion based on the internal architecture of the nodes on T1- and T2-weighted images in discriminating the disease.
Internal architectural abnormality on MR images may be an important hallmark suggestive of metastatic nodes in patients with head and neck cancer. In this context, Curtin et al (9) reported that internal abnormality of the node as judged by the presence of a low-signal-intensity area on T1-weighted images or an area of high or heterogeneous signal intensity on T2-weighted images improved the diagnostic ability in detecting metastatic nodes in the neck, compared with the diagnostic ability using the size criterion alone. Consistent with this preceding finding, we have shown here that the architectural criterion on T1- and T2-weighted images provides satisfactory results, yielding a 77.8% negative predictive value and an 89.5% positive predictive value. Multivariate analysis also showed that the signal intensity on T1- and T2-weighted images significantly contributed to the diagnosis of metastatic nodes in our study cohort (Table 1). Importantly, however, our results should be carefully interpreted relative to the preceding results (9, 14, 15), since we examined relatively large nodes (maximum diameter of 10 mm or more). Curtin et al (9) also stated that the significance of information on internal abnormalities in detecting metastatic nodes is dependent on the nodal size.
Heterogeneity of metastatic nodes may be at least in part due to the presence of necrotic areas in the node (16). Central nodal necrosis is one of the nodal features characteristic of metastatic nodes from head and neck cancers. Indeed, in our study cohort, 12 (48%) of 25 metastatic nodes were associated with necrotic areas, as evidenced by histology. The presence of necrotic areas greatly affected the ADCs of metastatic nodes (Fig 3), resulting in large variability in ADC values in the affected node.
Wang et al (10) applied diffusion-weighted MR imaging to head and neck lesions and found that the mean ADC of carcinomas was less than that of benign solid masses. The cohort used in that study contained a very small population of metastatic nodes. However, it is plausible that the cellularity of metastatic cancers in the nodes might not differ greatly from that of the primary lesions. The present study has extended these preceding findings to show that the ADC assessment can also characterize metastatic carcinomas in the node relative to benign lymphadenopathy. This notion was substantiated by the ROC analysis on the diagnostic ability of ADC in discriminating metastatic from benign lymphadenopathy, which yielded an Az value of 0.8440. The evaluation of ADCs in the primary lesions may be beneficial in discriminating the metastatic nodes in the neck.
Intriguing is our finding that the ADC of highly or moderately differentiated carcinomas was greater than that of poorly differentiated carcinomas. As a result, the ADC of poorly differentiated carcinomas approximated that of malignant lymphomas. In general, the increased nuclear-to-cytoplasmic ratio and hypercellularity, which are both frequently observed in poorly differentiated tumors (Fig 8), reduce the extracellular matrix and the diffusion space of water protons in the extracellular and intracellular dimensions, with a resultant decrease in ADCs (10). A significant correlation between the ADC and cell density was reportedly found in human melanoma xenografts (17). Furthermore, an inverse correlation between tumor grading for malignancy and ADCs was noted in other types of primary tumors, such as head and neck carcinomas (10), gliomas (18), and astrocytomas (19).
One of the major deficits of our study is, as described above, that we used a small study cohort containing metastatic nodes with a maximum diameter of 10 mm or greater. The ADC assessment requires relatively large target areas to obtain reliable ADC values with high signal-to-noise ratios. However, the diagnostic test may be biased by the fact that only severely involved lymph nodes were used. ADC measurements on smaller nodes would be hampered by low signal-to-noise ratios. It should also be noted that, in the present study, the statistical tests were run based on the number of involved lymph nodes rather than the number of patients. Therefore, confounding effects on the analysis cannot be denied.
In a previous report that used a larger study cohort, when the node size of 10 mm was used as a threshold indicative of metastatic nodes in combination with the criteria of abnormal signal intensity in the nodes, the authors obtained 79% negative and 52% positive predictive values, 82% sensitivity, and 48% specificity (9). The ADC criterion (≥ 0.400 × 10⁻³ mm2/s) used in the present study yielded higher specificity (97%) and positive predictive value (93%), and lower sensitivity (52%) and negative predictive value (71%), compared with the previous report (9). Partly consistent with this, multivariate analysis demonstrated that only the ADC value was significantly correlated to metastatic nodes (Table 1). However, we must await a further improvement of signal-to-noise ratio in diffusion-weighted imaging for assessment of smaller metastatic nodes.
Conclusion
ADC determination on diffusion-weighted MR imaging may be supportive for discriminating metastatic nodes in the neck.
References
- Received March 10, 2003.
- Accepted after revision April 6, 2003.
- Copyright © American Society of Neuroradiology
In this issue


Jump to section
Related Articles
Cited By...
- Quantitative Diffusion-Weighted MRI Parameters and Human Papillomavirus Status in Oropharyngeal Squamous Cell Carcinoma
- Diffusion-Weighted Imaging with Dual-Echo Echo-Planar Imaging for Better Sensitivity to Acute Stroke
- Differentiation of Recurrent Tumor and Posttreatment Changes in Head and Neck Squamous Cell Carcinoma: Application of High b-Value Diffusion-Weighted Imaging
- Prediction of Nodal Metastasis in Head and Neck Cancer Using a 3T MRI ADC Map
- Efficacy of Diffusion-Weighted Imaging for the Differentiation between Lymphomas and Carcinomas of the Nasopharynx and Oropharynx: Correlations of Apparent Diffusion Coefficients and Histologic Features
- Multiparametric MR Imaging of Sinonasal Diseases: Time-Signal Intensity Curve- and Apparent Diffusion Coefficient-Based Differentiation between Benign and Malignant Lesions
- Correlation of 18F-FDG Uptake with Apparent Diffusion Coefficient Ratio Measured on Standard and High b Value Diffusion MRI in Head and Neck Cancer
- Apparent Diffusion Coefficient Mapping for Sinonasal Diseases: Differentiation of Benign and Malignant Lesions
- Complementary Roles of Whole-Body Diffusion-Weighted MRI and 18F-FDG PET: The State of the Art and Potential Applications
- Can diffusion-weighted imaging distinguish between normal and squamous cell carcinoma of the palatine tonsil?
- Non-Gaussian Analysis of Diffusion-Weighted MR Imaging in Head and Neck Squamous Cell Carcinoma: A Feasibility Study
- Diffusion-Weighted Magnetic Resonance Imaging for Predicting and Detecting Early Response to Chemoradiation Therapy of Squamous Cell Carcinomas of the Head and Neck