
Article Figures & Data
Figures
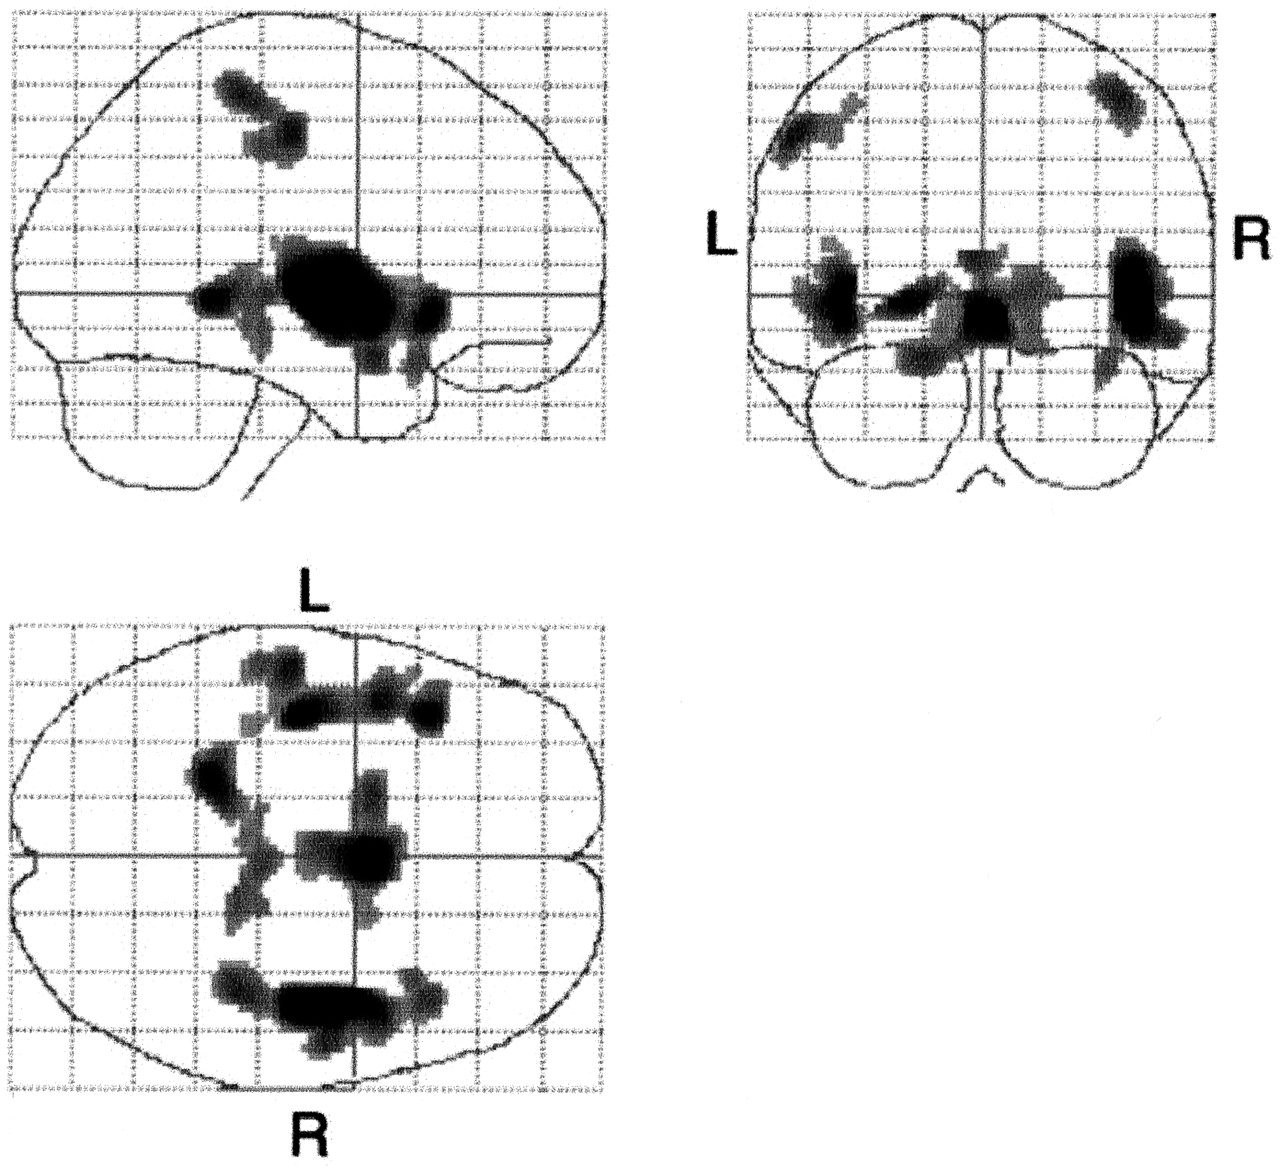
- Fig 1.
Statistical parametric maps show specific pixels that indicate a negative correlation between aging and gray matter loss in healthy subjects. The gray matter loss in the hypothalamic region, perisylvian cortices, parahippocampal gyri, and pre- and postcentral gyri are significantly and negatively correlated with age (P < .05, corrected). L indicates left; R, right.
- Fig 2.
A, Statistical parametric maps show comparison of patients with early-onset AD with age-matched healthy volunteers (the younger control subjects). Highlighted areas are regions of significant gray matter loss in the patients with early-onset AD compared with age-matched control subjects at a threshold of P < .001, uncorrected. Bilateral medial temporal lobes, inferior parietal lobules, precuneus, and perisylvian cortices and the right inferior frontal gyrus and bilateral cingulate cortex are highlighted. L indicates left; R, right.
B, Statistical parametric maps show comparison of patients with late-onset AD and age-matched healthy volunteers (the older control subjects). Highlighted areas are regions of significant gray matter loss in patients with late-onset AD compared with age-matched control subjects at a threshold of P < .001, uncorrected. Bilateral medial temporal cortices are highlighted. L indicates left; R, right.
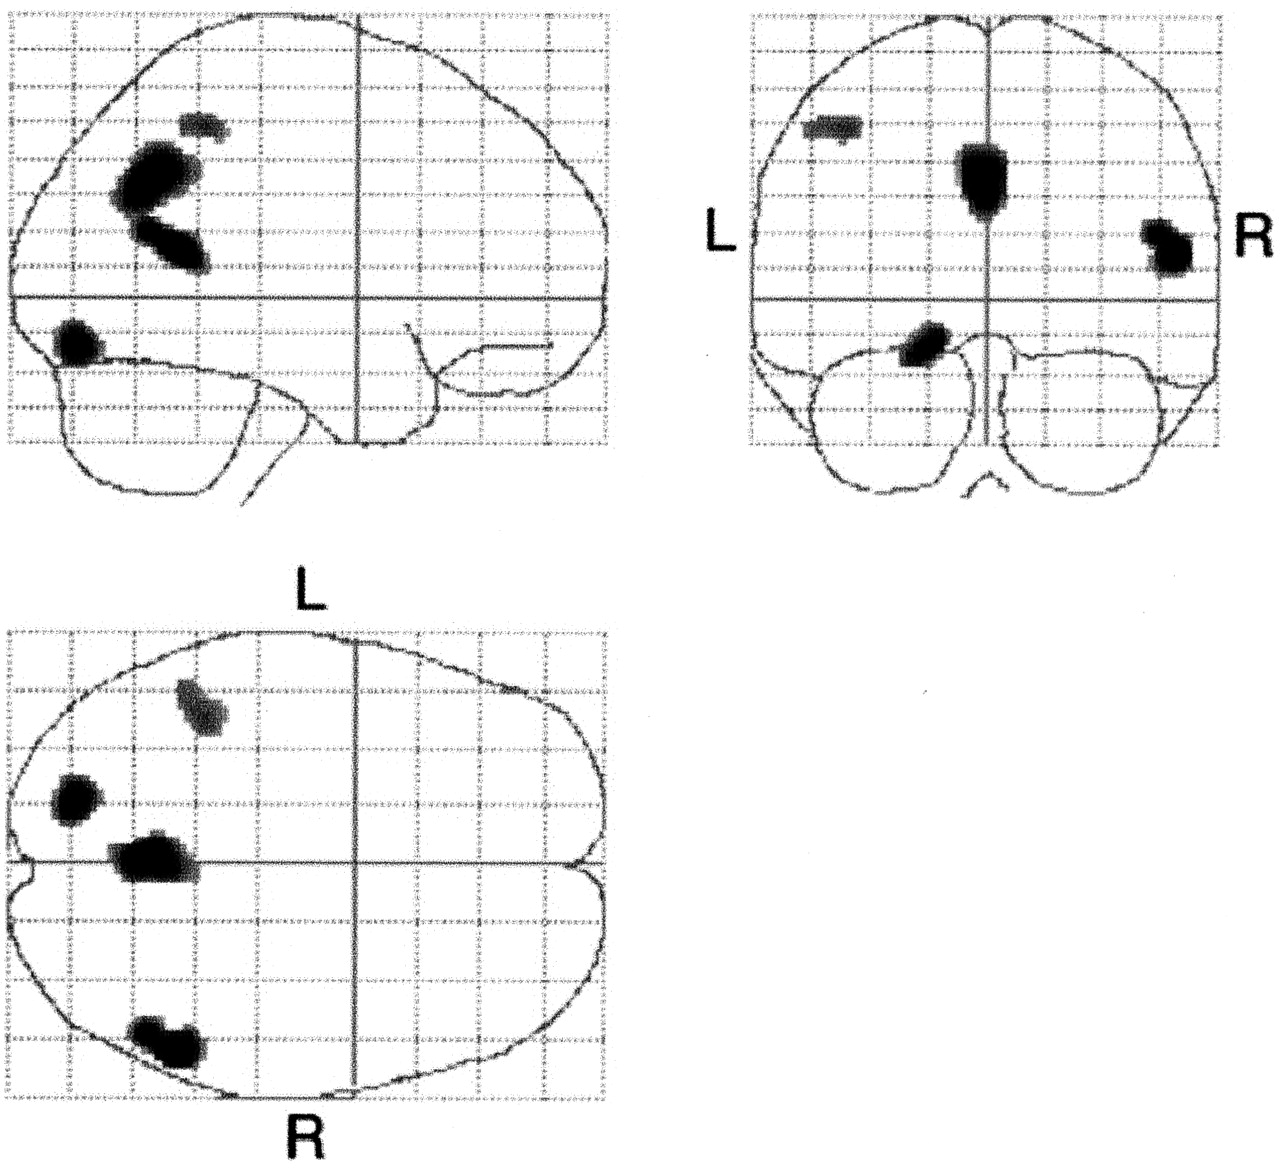
- Fig 3.
Statistical parametric maps show comparison of patients with early-onset AD and those with late-onset AD. Highlighted areas are regions of significant decreased density in patients with early-onset AD compared with those with late-onset AD at a threshold of P < .001, uncorrected. The gray matter densities in the bilateral precuneus, left parietal cortex, right middle temporal gyrus, and left fusiform gyrus were lower in the early-onset group than in the late-onset group. L indicates left; R, right.
- Fig 4.
ROC curves for patients with AD versus healthy subjects in the younger and older groups. Note the great differences in diagnostic performance between the younger and older groups. The Az value (0.94359) for early-onset AD was larger than that for late-onset AD (Az = 0.9018). True-positive fraction indicates sensitivity; false-positive fraction, 1 − specificity.
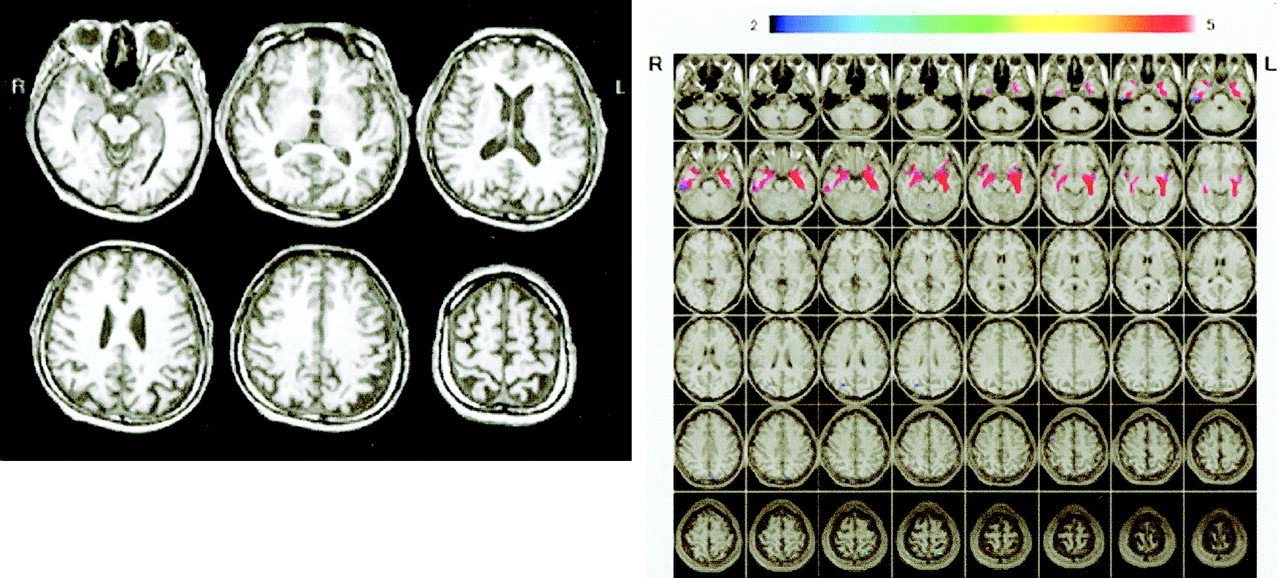
- Fig 5.
A and B, Conventional MR images (A) and Z score images (B) obtained in a 54-year-old patient with early-onset AD (MMSE score = 23). Mild right parietal lobular atrophy can be detected by visual inspection of the conventional T1-weighted images; however, the degree of atrophy was not estimated. By using the Z score map, the region and degree of atrophy can be detected easily, enabling this case to be diagnosed as AD. Areas with Z scores greater than 2 (indicated by rainbow color scale) in this subject were overlaid on the prototypic early-onset AD template map (overlaid on normal MR images with red area). L indicates left; R, right.
- Fig 6.
A and B, Conventional MR images (A) and Z score images (B) obtained in a 57-year-old healthy subject (MMSE score = 30). No atrophy is apparent on the MR images, and there are no areas with Z score greater than 2 overlaid on the prototypic early-onset AD template map. L indicates left; R, right.
- Fig 7.
A and B, Conventional MR images (A) and Z score images (B) obtained in a 73-year-old patient with late-onset AD (MMSE score = 23). Medial temporal atrophy can be detected by visual inspection of the conventional T1-weighted images. By using the Z score map, the region and degree of atrophy can be detected easily; note that the left hippocampal atrophy is stronger than the right. L indicates left; R, right.
- Fig 8.
A and B, Conventional MR images (A) and Z score images (B) in a 73-year-old healthy control subject (MMSE score = 30). The left parietal lobe seems to be atrophied on the conventional T1-weighted images, although the Z score map demonstrates that there is no significantly atrophied area


Tables
Group Sex (F:M) Age (y)* MMSE Score* First Early-onset AD 22:8 60.2 ± 5.2 23.0 ± 2.1 Younger controls 20:10 59.6 ± 3.8 29.9 ± 0.3 Late-onset AD 22:8 71.5 ± 2.6 22.3 ± 1.8 Older controls 20:10 71.4 ± 3.5 29.4 ± 0.9 Second Early-onset AD 14:6 60.8 ± 4.6 23.5 ± 1.9 Younger controls 17:3 59.1 ± 2.7 29.8 ± 0.5 Late-onset AD 17:3 72.2 ± 3.2 23.4 ± 2.0 Older controls 11:9 70.3 ± 4.2 29.5 ± 0.8 * Data are mean ± SD.
- TABLE 2:
Locaiton of greatest gray matter reduction in healthy control subjects in relation to age
Location Z Value x y z Right perisylvian cortices 7.12 40 −13 −3 Right hypothalamus 6.19 3 1 −6 Left perisylvian cortices 6.06 −34 −19 −1 Left parahippocampal gyrus 5.77 −19 −44 −4 Left postcentral gyrus 5.47 −47 −23 41 Right postcentral gyrus 5.41 36 −36 49 - TABLE 3:
Location of the greatest gray matter reduction in the cluster regions of significant gray matter density reduction in early-onset and late-onset AD groups compared with age-, sex-, and severity-matched control subjects
Group and Location Z Value x y z YHC > EO Right parahippocampal gyrus 5.79 17 −36 0 Left inferior parietal lobule 5.06 −45 −50 41 Right inferior parietal lobule 4.77 38 −62 41 Left operculum 4.72 −41 −13 −6 Right inferior frontal gyrus 4.50 41 8 30 Right precuneus 4.25 15 −65 14 Left inferior parietal lobule 3.96 −47 −58 23 OHC > LO Left hippocampus 5.13 −26 −7 −16 Right hippocampus 4.35 25 −38 −4 Note.—YHC indicates younger healthy controls; EO, early-onset AD; OHC, older healthy controls; LO, late-onset AD. Threshold is P < .001, uncorrected.
- TABLE 4:
Coordinates of regions of statistically signifiacnt decrease in gray matter density in the early-onset AD group compared with the late-onset AD group
Group and Location Z Value x y z LO > EO Right middle temporal gyrus 4.28 48 −54 9 Left precuneus 3.88 −1 −62 28 Left fusiform gyrus 2.85 −15 −81 −17 Left inferior parietal lobule 3.55 −36 −46 41 Note.—LO indicates late-onset AD; EO, early-onset AD. P < .001, uncorrected.
In this issue


Jump to section
Related Articles
Cited By...
- Impaired Speaking-Induced Suppression in Alzheimers Disease
- Clinical Neurology and Epidemiology of the Major Neurodegenerative Diseases
- Automatic Voxel-Based Morphometry of Structural MRI by SPM8 plus Diffeomorphic Anatomic Registration Through Exponentiated Lie Algebra Improves the Diagnosis of Probable Alzheimer Disease
- Clinical syndromes associated with posterior atrophy: Early age at onset AD spectrum
- Role of Neuroimaging in Alzheimer's Disease, with Emphasis on Brain Perfusion SPECT