
Abstract
BACKGROUND AND PURPOSE: Ameloblastomas and keratocystic odontogenic tumors are major aggressive odontogenic tumors in the maxillomandibular regions, but the differentiation between these 2 tumors is frequently ineffective based on only conventional CT and MR imaging findings. Here, we evaluated diffusion-weighted MR imaging for the differentiation of these 2 odontogenic tumors.
MATERIALS AND METHODS: We prospectively studied 9 patients with ameloblastoma and 7 patients with keratocystic odontogenic tumor using diffusion-weighted MR imaging. Apparent diffusion coefficients (ADCs) of the nonenhancing and solid lesions in these tumors were determined with use of 2 b factors (500 and 1000).
RESULTS: Two types of nonenhancing lesions were identified; one with high signal intensity on fat-suppressed T2-weighted images (type A) and the other with low or intermediate intensity (type B). The type A nonenhancing lesions were observed in all the ameloblastomas, but they were evident in only 2 keratocystic odontogenic tumors. It is interesting to note that the ADCs of the nonenhancing lesions in the ameloblastomas were significantly higher than those of the nonenhancing lesions in the keratocystic odontogenic tumors (2.48 ± 0.20 × 10⁻³ mm2/s vs 1.13 ± 0.56 × 10⁻³ mm2/s; P < .001). The ADCs of the solid lesions in the ameloblastomas (1.39 ± 0.15 × 10⁻³ mm2/s) were significantly lower than those of the nonenhancing lesions in the ameloblastomas and were similar to those of the nonenhancing lesions in the keratocystic odontogenic tumors.
CONCLUSION: ADC determination may be used as an adjunct tool for differentiation between ameloblastomas and keratocystic odontogenic tumors.
A meloblastomas and keratocystic odontogenic tumors are major aggressive odontogenic tumors in the maxillomandibular regions. Both tumors display common radiologic features such as unicystic or multicystic lesions with extensive thinning and expansion of the overlying cortex. They are locally invasive and prone to recur after inappropriate surgical excision.1 Furthermore, the effective preoperative differential diagnosis between these 2 tumors could help surgeons plan treatment because ameloblastomas require resection and keratocystic odontogenic tumors can be treated with enucleation.
Radiologic differentiation between these tumors is not difficult if the ameloblastoma is of the solid and multicystic type and the keratocystic odontogenic tumor is of the unilocular type. However, substantial ameloblastomas are unicystic, and some keratocystic odontogenic tumors are multicystic or multilobular with scalloped margins, thereby resembling ameloblastomas.
Several attempts have been investigated to differentiate between ameloblastomas and keratocystic odontogenic tumors with use of CT and MR imaging.2–5 In this study, we further characterize these 2 aggressive benign tumors in the maxillomandibular regions on the basis of the diffusion-weighted MR imaging features, with particular emphasis on the apparent diffusion coefficients (ADCs) of the nonenhancing lesions of these tumors.
Materials and Methods
Patients
We prospectively studied consecutive patients with ameloblastomas (n = 9) or keratocystic odontogenic tumors (n = 7) who received MR imaging examinations at our hospital from 2003 to 2006. The study protocol was accepted by the Ethics Committee of our hospital, and informed consent was obtained from each of these patients.
Conventional MR Imaging
We performed MR imaging using a 1.5T MR scanner (Gyroscan Intera 1.5T Master; Philips Medical Systems, Best, the Netherlands) with a surface coil (11-cm Synergy Flex S or 4.7-cm microscopy coil; Philips Medical Systems). Axial and coronal T1-weighted images (TR, 500 ms; TE, 15 ms; numbers of signal intensity acquisition, 4 for S coil and TR, 550 ms; TE, 10 ms; numbers of signal intensity acquisition, 3 for microscopy coil) and axial fat-suppressed (spectral presaturation with inverted recovery [SPIR] or spectral-attenuated inversion recovery [SPAIR]) T2-weighted images (TR, 3741 ms; TE, 80 ms; numbers of signal intensity acquisition, 4 [SPIR] or TR, 5118 ms; TE, 80 ms; numbers of signal intensity acquisition, 4 [SPAIR] for S coil and TR, 3000 ms; TE, 90 ms; numbers of signal intensity acquisition, 6 for microscopy) were obtained for all the patients with use of a conventional spin-echo sequence and a turbo spin-echo sequence, respectively. The section thickness was 3 mm for the S coil and 2 mm for the microscopy coil. MR imaging was performed with a 204 × 256 matrix for S coil and 160 × 128 matrix for microscopy coil, a 18-cm FOV for the S coil, a 7-cm FOV for the microscopy coil, and a 0.3-mm intersection gap for the S coil and 0.2 mm for the microscopy coil.
For the contrast-enhanced study, gadolinium was injected at a rate of 1.5 mL/s and at a dose of 0.1 mmol gadolinium/kg body weight. Enhanced and nonenhanced areas were referred to as solid and nonenhancing lesions, respectively.
On T1-weighted images, the signal intensity of a tumor was designated as high (signal intensity level similar to that of fat), low (similar to that of muscle), or intermediate (signal intensity level between that of fat and muscle); on fat-suppressed T2-weighted images, the signal intensity of a tumor was designated as high (similar to that of CSF), low (similar to that of muscle), or intermediate (intensity between that of CSF and muscle).4
Diffusion-Weighted MR Imaging
Diffusion-weighted axial images (TR, 4285 ms; TE, 87 ms; number of signal intensity acquisitions, 4) were obtained by the single-shot spin-echo, echo-planar imaging technique with an FOV of 200-mm and matrix size of 112 × 90. The section thickness and section gap were 3 mm and 0.3 mm, respectively. We used the sensitivity encoding (SENSE) technique (SENSE factor, 2) to prevent susceptibility artifacts with a reduction in the echo-train length during the diffusion-weighted imaging. In some tumors, diffusion-weighted axial images (TR, 2973 ms; TE, 121 ms; number of signal intensity acquisitions, 6) were obtained with use of the microscopy coil. The section thickness was 2 mm. The diffusion-weighted MR imaging was performed with a matrix of 80 × 56, an FOV of 70 mm, and an intersection gap of 0.2 mm.
We determined the ADCs using 2 b factors (500 and 1000 s/mm2) and the following formula:  where b1 (= 500 s/mm2) and b2 (= 1000 s/mm2) are the gradient factors of sequences S1 and S2, respectively, and SI1 and SI2 are the signal intensities by sequences S1 and S2, respectively. In general, when b factors greater than 300 are used, the resultant ADC contains negligible amounts, if any, of the perfusion factor. Therefore, we obtained ADC maps using the 2 abovementioned b factors. We obtained isotropic diffusion images by applying the 2 b factors along the 3 orthogonal directions. This procedure is more time-consuming; however, the simultaneous use of the SENSE technique can compensate for the excess time required. The total image acquisition time was 2 minutes 8 seconds per 25 sections with the SENSE technique. This rapid imaging allowed us to obtain ADC maps without significant motion artifacts.
In this study, we assessed ADCs of the nonenhancing and solid lesions within the tumors by averaging all of the ADCs determined on all the axial tumor images that contained the nonenhancing and solid areas. We calculated the ADCs by semiautomatically placing an irregular region of interest onto a nonenhancing or solid area; the region of interest was placed manually on a contrast-enhanced T1-weighted image so that it encompassed the entire area of the solid or nonenhancing lesions. Subsequently, the region of interest was automatically copied and pasted onto the corresponding ADC map.
Image Analysis
We converted DICOM gray-scale ADC map images to color ADC map images using Photoshop 7.0 software (Adobe, San Jose, Calif), after setting the window level of the gray-scale ADC map images at 1.5 × 10⁻³ mm2/s and the window width at 3.0 × 10⁻³ mm2/s using OsiriX software (http://www.osirix-viewer.com). As a result, tumor areas having high ADCs are displayed as color areas of shorter wavelengths such as red and tumor areas having low ADCs, as color areas of longer wavelengths such as blue. The conventional MR images and ADC maps correlated with the histologic findings of the excised tumors.
Statistical Analysis
We assessed the significance of the differences in the ADCs between the 2 tumors by using Mann-Whitney U test with software (Version 13 for Windows; SPSS, Chicago, Ill).
Results
Conventional MR Imaging
Contrast-enhanced MR imaging demonstrated that the ameloblastomas were composed of varying proportions of solid and nonenhancing lesions. However, the keratocystic odontogenic tumors exhibited thin, enhanced rims corresponding to the cyst walls. All of the ameloblastomas contained solid enhancing tissue, and none of the keratocystic odontogenic tumors exhibited such imaging features (Table). The nonenhancing lesions of the ameloblastomas and keratocystic odontogenic tumors exhibited low to intermediate signal intensities on T1-weighted images (Figs 1A and 2A; Table). On the other hand, the nonenhancing lesions were of low to high signal intensity on fat-suppressed T2-weighted images (Figs 1B and 2B).

A 47-year-old man with ameloblastoma at the mandible. A, Axial T1-weighted image (TR, 500 ms; TE, 15 ms) shows the tumor (arrowhead) with low to intermediate signal intensity. B, Axial fat-suppressed (SPIR) T2-weighted image (TR, 3741 ms; TE, 80 ms) shows large, multiloculated cystic lesion with high signal intensity (arrowhead) indicative of cystic cavity. C, Axial color ADC map shows cystic tumor (arrowhead) with high ADC (2.50 × 10⁻³ mm2/s). Broken line indicates an irregular region of interest placed in the nonenhancing lesion. D, Photomicrograph shows solid tumor lesion associated with multiple small cysts, exhibiting a follicular pattern of tumor cell proliferation with peripheral palisading. Original magnification ×10.

A 23-year-old man with ameloblastoma at the right mandible. A, Axial fat-suppressed (SPIR) T2-weighted image (TR, 3000 ms; TE, 90 ms) obtained by a 4.7-cm microscopy coil shows the tumor (arrowheads) with high signal intensity in the mandibular ramus. A solid lesion (arrow) is also observed. B, Axial contrast-enhanced T1-weighted image (TR, 550 ms; TE, 10 ms) shows the tumor (arrowheads) with clear definition between solid (arrow) and nonenhancing lesions. C, Axial color ADC map shows the tumor (arrowheads) consisted of nonenhancing lesion with high ADC (2.67 × 10⁻³ mm2/s) and a solid lesion (arrow) with intermediate ADC (1.50 × 10⁻³ mm2/s). Two broken lines indicate irregular regions of interest placed in solid (small) and nonenhancing (large) lesions. D, Photomicrograph shows large nonenhancing lesion (*) associated with solid lesion containing follicular pattern of tumor cell proliferation with varying degrees of cystic degeneration in tumor islands. Original magnification ×1.
Conventional MR imaging features of ameloblastomas and keratocystic odontogenic tumors
On the basis of the findings of the fat-suppressed T2-weighted images, 2 types of nonenhancing lesions were identified in the tumors: one with high signal intensity (type A) and the other with low to intermediate signal intensity (type B) (Table). The type A nonenhancing lesions were observed in all the ameloblastomas, but they were evident in only 2 cases of keratocystic odontogenic tumors. The solid lesions in the ameloblastomas were of intermediate signal intensity on fat-suppressed T2-weighted images (Table).
Diffusion-Weighted MR Imaging
The color ADC maps clearly delineated the nonenhancing and solid lesions of the ameloblastomas and keratocystic odontogenic tumors (Figs 1C, 1D, 2C, 2D, 3C, and 3D). Therefore, we compared the ADCs of the nonenhancing lesions in the ameloblastomas and keratocystic odontogenic tumors. The ADCs of the nonenhancing lesions in the ameloblastomas (2.48 ± 0.20 × 10⁻³ mm2/s) were significantly higher (P < .001, Mann-Whitney U test) than those of the nonenhancing lesions in the keratocystic odontogenic tumors (1.13 ± 0.56 × 10⁻³ mm2/s) (Fig 4).

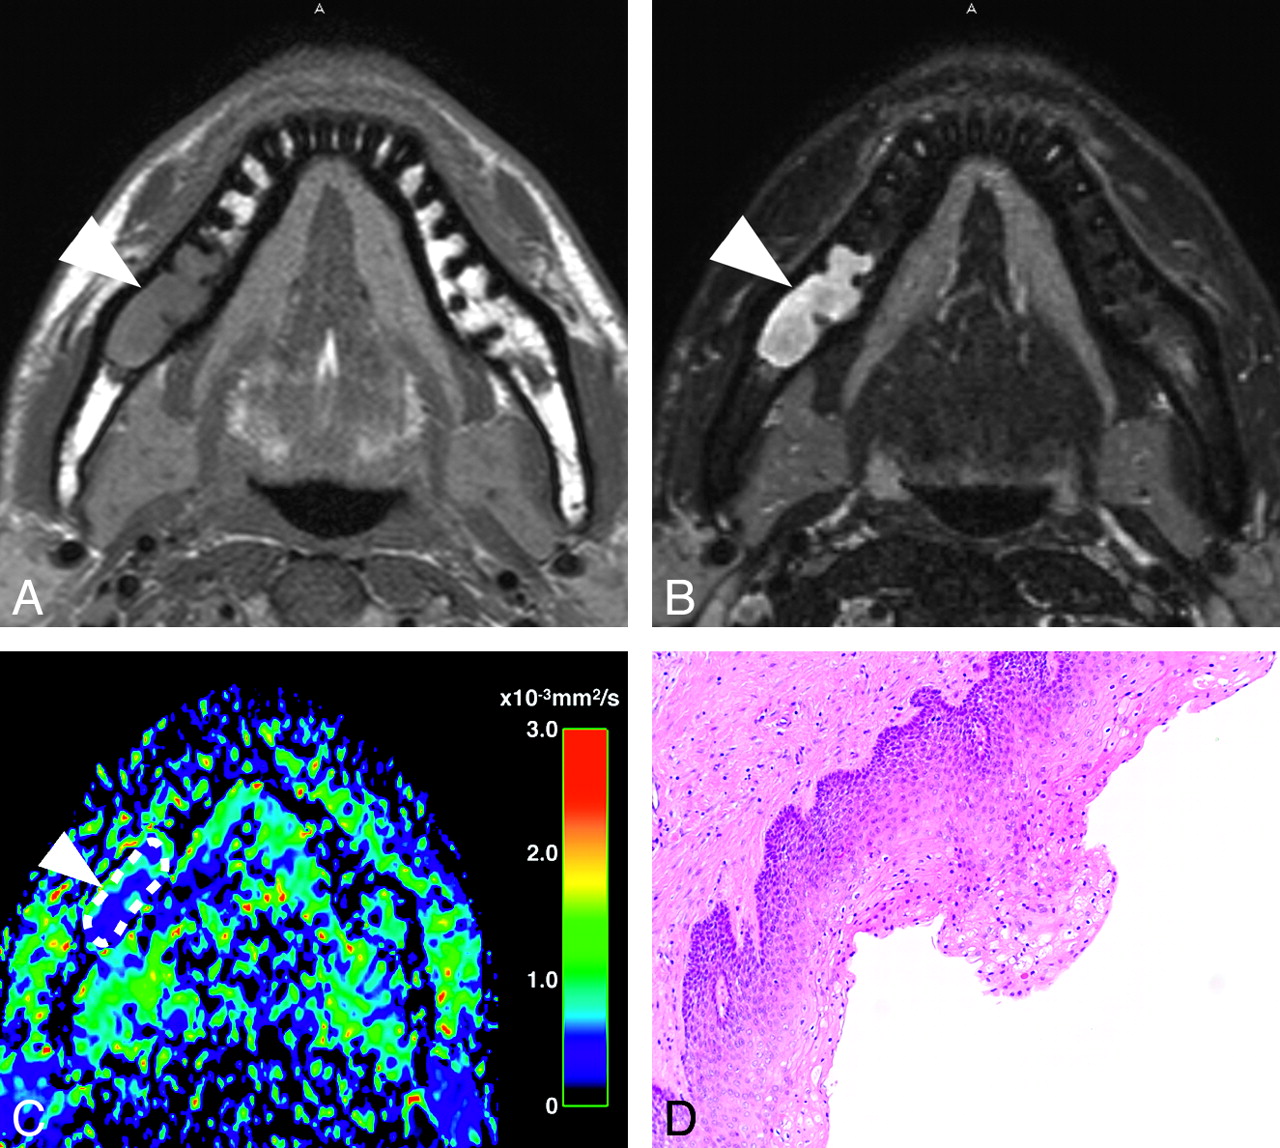
A 33-year-old man with a keratocystic odontogenic tumor at the right mandible. A, Axial T1-weighted image (TR, 500 ms; TE, 15 ms) shows a multilobulated cystic lesion with intermediate signal intensity (arrowhead). B, Axial fat-suppressed (SPAIR) T2-weighted image (TR, 5118 ms; TE, 80 ms) shows tumor (arrowhead) composed mainly of nonenhancing lesion with intermediate signal intensity. C, Axial color ADC map shows nonenhancing lesion (arrowhead) with low ADC (0.67 × 10⁻³ mm2/s). Broken line indicates an irregular region of interest placed in nonenhancing lesion. D, Photomicrograph shows cyst wall consisting of parakeratinized stratified squamous epithelium. Original magnification ×10.

Scatterplot shows ADCs of nonenhancing and solid lesions of ameloblastomas and keratocystic odontogenic tumors. Horizontal lines indicate means of respective groups. P, Mann-Whitney U test.
When ADC of 2.0 × 10⁻³ mm2/s was used as a threshold for the differentiation between ameloblastomas and keratocystic odontogenic tumors, we obtained 100% sensitivity, 86% specificity, 94% accuracy, and 90% positive and 100% negative predictive values.
The ADCs of the solid lesions in the ameloblastomas (1.39 ± 0.16 × 10⁻³ mm2/s) were significantly lower (P < .001, Mann-Whitney U test) than those of the nonenhancing lesions in the ameloblastomas and were similar to those of the nonenhancing lesions in the keratocystic odontogenic tumors (Fig 4). The solid lesions of the keratocystic odontogenic tumors were so thin that precise ADC measurements were not achieved.
Discussion
Our study showed that ameloblastomas and keratocystic odontogenic tumors could be effectively differentiated on the basis of the ADC measurements of the nonenhancing lesions.
Diffusion seems to be influenced by “physical” parameters such as temperature, pressure, and viscosity. Furthermore, physiologic parameters can also influence diffusion; these are most significant because extracellular matrices and fluids are of great importance in the clinical context. The physiologic parameters include cellularity, amount and ratio of intracellular and extracellular water, nucleus-to-cytoplasm ratio, and vascularity. Significant changes in any of these parameters may result in changes in the pixel intensity of the diffusion-weighted sequence. If we use adequately high b values to eliminate signals from the vascular space (eg, b = 500 and 1000), then the signal intensity would originate solely from intracellular and extracellular water.
Our finding that ADCs of the nonenhancing lesions differ significantly between the ameloblastomas and keratocystic odontogenic tumors indicates that the nonenhancing components vary between these 2 odontogenic tumors. Cystic spaces in the ameloblastomas usually contain slightly proteinaceous fluids, occasionally associated with colloidal materials.1,6 The cyst lumen of keratocystic odontogenic tumors often contains desquamated keratin.1,6 This desquamated keratin accumulates in such large quantities that it influences the attenuations on CT images.7 Therefore, it is plausible that such desquamated keratin increased the viscosity of fluids in the lumen, thereby decreasing the ADC levels of the nonenhancing lesions in keratocystic odontogenic tumors compared with those of ameloblastomas, in which increases in viscosity may be minimal.
Conventional MR imaging could also provide useful information about the differentiation of ameloblastomas and keratocystic odontogenic tumors.2,4 In our study, we found that nonenhancing lesions were of high signal intensity on fat-suppressed T2-weighted images in all the ameloblastomas but in only 2 of the 7 keratocystic odontogenic tumors (Table). Therefore, the differentiation on the basis of T2-weighted images or T2 map would be useful. A previous study has reported that the cyst walls of the ameloblastomas were thicker than those of the keratocystic odontogenic tumors and were occasionally projecting into the cyst lumen; it is more interesting to note that the T2 relaxation time of the nonenhancing components was significantly shorter in the keratocystic odontogenic tumors than in the ameloblastomas.4 The latter findings were consistent with our present results regarding the ADC measurement.
In the present study cohort, the discrimination of ameloblastomas from keratocystic odontogenic tumors on the basis of the presence of solid enhancing lesions was quite effective (Table). However, previous studies have shown that ameloblastomas exhibited a wide spectrum of T1-weighted and T2-weighted MR imaging features2,4; therefore, a significant overlap in the conventional MR imaging features may exist between ameloblastomas and keratocystic odontogenic tumors. A dynamic contrast-enhanced CT study showed a positive correlation between the enhancement ratio and microvessel attenuation in the ameloblastomas and keratocystic odontogenic tumors and further demonstrated that the enhancement ratios of the ameloblastomas were significantly higher than those of the keratocystic odontogenic tumors.5 In the collective sense, these findings suggest that the discrimination of ameloblastomas from keratocystic odontogenic tumors on the basis of the ADC of nonenhancing lesions may be as effective as the differentiation between these tumors on the basis of contrast-enhanced study of solid lesions.
In addition to the ADCs of the ameloblastomas and keratocystic odontogenic tumors, we determined ADCs of the nonenhancing components of 6 dentigerous cysts; the ADCs of the dentigerous cysts were lower (1.56 ± 0.78 × 10⁻³ mm2/s) than those of the ameloblastomas, though the difference was not significant because of broad SDs of the ADCs of the dentigerous cysts. The wide range of ADCs of the dentigerous cysts suggests that their nonenhancing components were considerably more heterogeneous than those of the ameloblastomas and keratocystic odontogenic tumors.
ADC measurement after placing volumetric regions of interest is time consuming. However, we found that ADCs of nonenhancing lesions in the 2 tumors were fairly uniform. Therefore, ADC measurement can be simplified by measuring ADC of a single representative nonenhancing lesion from each tumor.
Conclusion
We demonstrated that ADCs of nonenhancing lesions in ameloblastomas were significantly higher than those of nonenhancing lesions in keratocystic odontogenic tumors. Although conventional MR imaging findings regarding the solid lesions in ameloblastomas were distinct from those in the case of keratocystic odontogenic tumors, the ADC measurement of the nonenhancing lesions may be useful as an adjunct tool for differentiation between these 2 locally aggressive tumors in the maxillomandibular region. The effective preoperative differential diagnosis between these 2 tumors would help surgeons plan treatment (resection or enucleation).
- Received March 14, 2008.
- Accepted after revision June 21, 2008.
- Copyright © American Society of Neuroradiology
In this issue


Jump to section
Related Articles
Cited By...
- Cross-Sectional Imaging of Third Molar-Related Abnormalities
- Diagnostic value of MRI for odontogenic tumours
- Diffusion-weighted imaging in the evaluation of odontogenic cysts and tumours
- Efficacy of Diffusion-Weighted Imaging for the Differentiation between Lymphomas and Carcinomas of the Nasopharynx and Oropharynx: Correlations of Apparent Diffusion Coefficients and Histologic Features
- Imaging features contributing to the diagnosis of ameloblastomas and keratocystic odontogenic tumours: logistic regression analysis