
Abstract
SUMMARY: Arterial spin-labeling (ASL) is a relatively new and noninvasive MR imaging technique, used to measure cerebral blood flow (CBF). Scanning time and reproducibility remain important issues in the clinical applicability of ASL. We expected both to benefit from higher field strengths. We describe that when performing ASL at 3T, 20 averages suffice to obtain steady and reproducible CBF values. Scanning time can be as short as 3 minutes.
Arterial spin labeling (ASL) is a noninvasive MR imaging technique, used for visualization and quantification of cerebral perfusion. Cerebral blood flow (CBF) values measured by ASL are comparable with CBF values measured by conventional techniques (eg, positron-emission tomography or susceptibility-weighted MR imaging). ASL is based on magnetic labeling of arterial blood water protons, which are used as an endogenous tracer of flow. Magnetic inversion takes place in a plane proximal to the brain. The decay rate of the labeled spins is sufficiently long to visualize perfusion of brain vasculature and microvasculature. Perfusion images are obtained by subtraction of successively acquired labeled and nonlabeled control images. In general, 40 to 60 paired acquisitions are averaged to improve perfusion signal intensity. ASL sequences differ in the way magnetic labeling is applied and are commonly classified as continuous or pulsed ASL (CASL or PASL, respectively). In CASL, continuous adiabatic inversion of spins is applied. In PASL, labeling is performed at once over a wide spatial range. Pseudocontinuous ASL (pCASL) has been introduced recently and uses a series of discrete labeling pulses.1–8
Despite its advantages, scanning time and reproducibility remain important issues in the clinical applicability of ASL. The use of higher-field strengths could overcome these issues because of increased signal-to-noise ratio, prolonged T1-weighted relaxation time of labeled blood, and better spatial and temporal resolution.7,9
We hypothesized that scanning time of the CASL sequence can be reduced at 3T because fewer averages might suffice to obtain steady and reproducible CBF values. Our primary objective was to assess the number of averages needed to obtain steady and reproducible CBF values with use of 3T CASL.
Also, we hypothesized that acquisition-related reproducibility of ASL will improve at higher-field strengths, whereas physiology-related reproducibility will not change. Previous CASL reproducibility studies were performed at 1.5T with test-retest timeframes of at least 1 hour.4,6,10 Measurement of reproducibility within scans would be more valuable to assess physiologic variations. Our secondary objective was to assess 3T CASL reproducibility within scans (intrascan ≈ 4 minutes), within sessions (intrasession ≈ 10 minutes), and between sessions (intersession ≈ 1 to 3 weeks).
Technique
After approval of the local ethics committee and written informed consent from all volunteers, we scanned 10 volunteers (5 men; age range, 25–33 years) without known cerebrovascular disease during 3 different sessions within 3 weeks. Each session protocol consisted of 2 CASL sequences preceded by MR angiography. All scans were performed on a 3T Intera MR scanner with a transmit-receive head coil from the manufacturer (Philips Medical Systems, Best, the Netherlands).
The 3D time-of-flight MR angiography was obtained to allow for careful planning of the labeling plane perpendicular to the distal ascending portion of the internal carotid and basilar arteries, 10–20 mm below the circle of Willis.
For the ASL sequences, we implemented the amplitude-modulated CASL approach described by Alsop and Detre5, without compromising clinical specific absorption rate levels. We used spin-echo single-shot echo-planar imaging. The imaging volume was positioned parallel to the labeling plane with its center 60 mm above the labeling plane. ASL parameters were TR, 4500 ms; TE, 32ms; flip angle, 90°; FOV, 210 × 210; section thickness, 7 mm with 1-mm gap; matrix size, 64 × 45 (reconstructed to 64 × 64); 50 averages; labeling duration, 2.0 s; radiofrequency pulse amplitude, 3.5 μT; gradient strength, 2.5 mT/m; modulation frequency, 250 Hz; and postlabeling delay, 1.2 to 2.2 s.
FSL (FMRIB-Software-Library, Functional Magnetic Resonance Imaging of the Brain Centre, Department of Clinical Neurology, University of Oxford, Oxford, UK) was used for off-line data processing.11 We subtracted 50 pairs of labeled and control images after 2D motion correction and calculated CBF by averaging across all brain voxels in the image series. This calculation step was repeated for increasing numbers of averages. For CBF-quantification, we used the equation described by Wang et al7 and Buxton et al12:  in which f is CBF (mL/g/s), α is the labeling efficiency at 3T (0.68),7 λ is the blood-brain partition coefficient (0.98 mL/g), ΔM is the difference between labeled image and control image intensity, R1a is the longitudinal relaxation time of blood (0.67 s−1), Mcon is the average control image intensity, Τ is the labeling duration (2 s), and w is the postlabeling delay (1.2–2.2 s).
On the basis of published templates, we manually outlined flow territories of the right and left anterior, middle, and posterior cerebral arteries.13 Perfusion images and flow territories were transformed into standard space with Harvard-Oxford atlases (Harvard Center for Morphometric Analysis, FSL). We segmented perfusion images into flow territories and calculated CBF in all vascular regions by automated region-of-interest analysis. Statistical analyses were performed using SPSS statistical software, version 14.0 (SPSS, Chicago, Ill). P values of less than .05 were regarded as significant.
A summary of the results of all measurements is presented in Table 1. Mean whole brain (WB) CBF for all subjects was 56.1 ± 11.1 mL/100 g/min. Although we consequently measured lower male than female WB-CBF values, an unpaired t test indicated that this difference was not statistically significant (54.2 ± 9.2 and 58.1 ± 12.6 mL/100 g/min; P = .07).
WB and vascular region CBF means and SDs
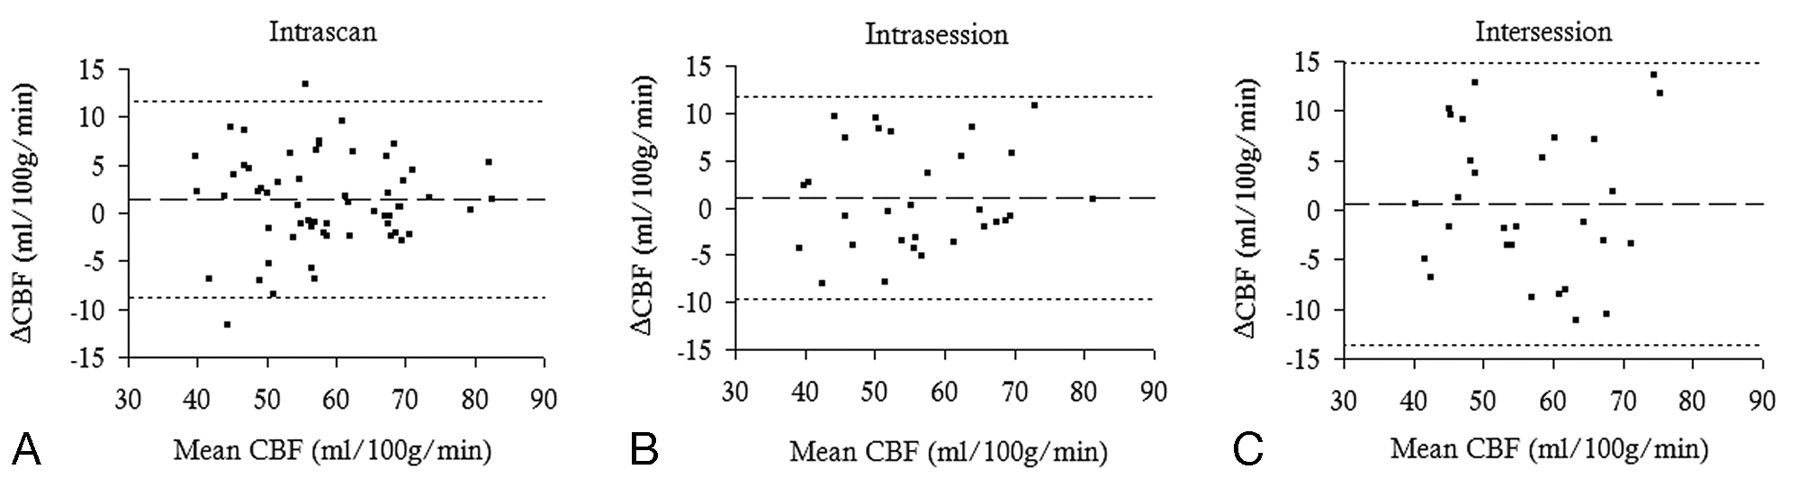
We used boxplots and histograms to examine the distribution of CBF data obtained from different scans. Distributions were comparable. Only data for the left posterior cerebral artery were abnormally distributed and log10 transformed for calculation of intraclass correlation coefficients (ICCs). The intrascan and intrasession and intersession differences of WB-CBF plotted against mean WB-CBF were randomly distributed and showed no dependency on mean WB-CBF, as is shown in Fig 1.14

Bland Altman plot of intrascan (A), intrasession (B), and intersession (C) WB-CBF differences plotted against mean WB-CBF. WB intrascan, intrasession, and intersession CBF differences are randomly distributed and are not dependent on mean WB-CBF. Dotted lines indicate that the mean WB-CBF difference ± 1.96 SD. 95% of the differences between repeated measurements are within 1.96 SD of the mean difference.
To evaluate the number of averages needed to obtain steady WB-CBF values, we plotted the absolute WB-CBF difference after adding an average, against the number of averages (Fig 2). We defined the number of averages needed to obtain steady WB-CBF values, as the number of averages needed to obtain values deviating less than 0.50 mL/100 g/min from the difference induced by adding the last average. Steady CBF values were reached after 20 averages.

Absolute WB-CBF difference, as a function of the number of averages. Steady CBF values are reached after 20 averages.
We compared CBF values on the basis of the first and last 25 averages within scans to define intrascan reproducibility. To assess intrasession reproducibility, we compared CBF values obtained from the first and the second scan. To assess intersession reproducibility, we compared mean CBF values of the first, second, and third sessions. We performed reproducibility analyses for 20 and 50 averages by calculating the following values15:
The repeatability index (RI) defined as the 95% confidence interval (CI) for repeated measurements was given by: RI = 1.96 × SDΔcbf, with SDΔcbf the SD of the CBF difference (Δcbf) between repeated measurements.
We calculated the ICC by performing a reliability analysis using SPSS, ICCs of 1.0 indicating perfect reliability and 0.5 or lower indicating randomness of results.
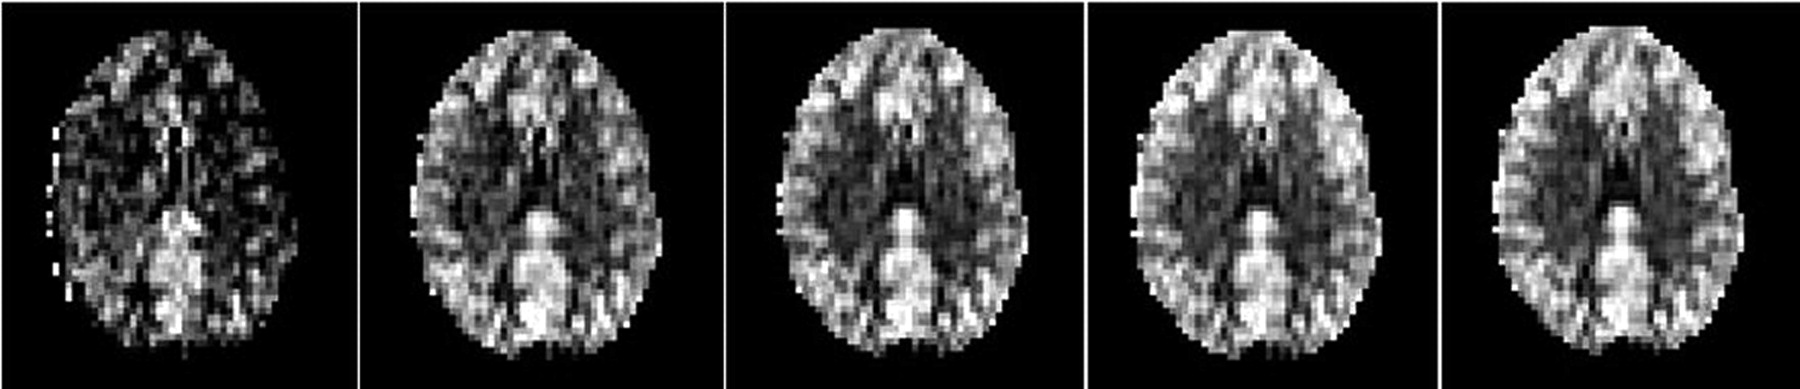
The intrascan RI was 10.2 mL/100 g/min for WB-CBF and 12.6 mL/100 g/min for vascular region (VR) CBF (Table 2). For 20 averages, the intrasession and intersession RIs were 10.7 and 16.8 mL/100 g/min for WB-CBF and 13.6 and 18.9 mL/100 g/min for VR-CBF (Table 3). For 50 averages, the intrasession and intersession RIs were 10.7 and 14.2 mL/100 g/min for WB-CBF and 13.1 and 15.6 mL/100 g/min for VR-CBF (Table 4). In Fig 3, WB-CBF ICCs are plotted against the number of averages. The ICC based on 20 averages did not differ significantly from ICCs based on more than 20 averages, as confidence intervals were overlapping. Finally, Fig 4 shows that no clear perfusion differences are visible between images on the basis of 20, 30, 40, or 50 averages.

Intrasession and intersession ICC as a function of the number of averages.

CASL sections obtained at 3T with 10, 20, 30, 40, and 50 averages, respectively (left to right); no clear differences are visible between perfusion images on the basis of 20 and 50 averages.
Intrascan reproducibility on the basis of the measurement differences between the first 25 and the last 25 averages
Intrasession and intersession reproducibility on the basis of 20 averages
Intrasession and intersession reproducibility based on 50 averages
Discussion
In this 3T CASL study, we assessed CBF and reproducibility of CBF measurements for different numbers of averages. WB-CBF and VR-CBF data and reproducibility are in good agreement with those reported in the literature.4,6,10 Ye et al2 reported WB-CBF values of 55 ± 10 and 59 ± 10 mL/100 g/min in their comparison of ASL with positron-emission tomography. Parkes et al, 4 Floyd et al,6 and Hermes et al10 assessed the reproducibility of CASL at 1.5 T. Perfusion values that they have presented are similar to our perfusion values. Reproducibility values are similar to or slightly worse than our reproducibility values. Also, the CBF difference between men and women has been previously described and has been attributed to differences in brain volume, heart rate, hematocrit level, estrogen level, or T1-weighted relaxation time.4,6,10
As can be concluded from Fig 2, CBF measurements reached steady values after acquisition of approximately 20 averages. RIs on the basis of 20 averages showed that we can be 95% confident that WB-CBF test-retest differences are less than 10.2 within scans, 10.7 within sessions, and 16.8 during a 3-week timeframe. Both RIs and ICCs on the basis of 50 averages were not significantly better. CASL scanning time could thus be halved and reduced to 3 minutes, which greatly improves the usefulness of CASL in daily clinical routine.
Because we carried out CASL measurements at 3T instead of 1.5T, we had the advantage of longer T1-weighted relaxation times, higher signal-to-noise ratio, and improved spatial and temporal resolution and expected at least acquisition-related variability to be reduced. However, comparison with the literature showed that 3T CASL reproducibility is similar or only slightly better than 1.5T CASL reproducibility.6,10 By calculating intrascan reproducibility, we attempted to minimize acquisition-related variability and to approach reproducibility values that are completely physiology dependent. However, intrascan and intrasession reproducibility values were comparable. These observations could be the result of a relatively large contribution of physiologic variability in the timescale of 3 to 15 minutes. However, exact contributions of acquisition and physiology-related variability remain unclear and more knowledge on underlying mechanisms is essential.
Conclusions
Our study shows that reduction of 3T CASL scanning time to 3 minutes still allows steady and reproducible WB and VR-CBF values to be obtained. This setting greatly facilitates the use of CASL sequences in clinical routine practice. High intrascan variability at 3T suggests that physiologic variations play a considerable role in ASL variability.
Acknowledgments
The authors thank prof. A.H. Zwinderman for his thorough feedback on the statistical analysis used in this study.
References
- Received August 21, 2008.
- Accepted after revision November 8, 2008.
- Copyright © American Society of Neuroradiology


