
Abstract
BACKGROUND AND PURPOSE: Tools for noninvasive mapping of hemodynamic function including cerebrovascular reactivity are emerging and may become clinically useful to predict tissue at hemodynamic risk. One such technique assesses blood oxygen level–dependent (BOLD) MR imaging contrast in response to hypercapnia, but the reliability of its quantification is uncertain. The aim of this study was to prospectively investigate the intersubject and interhemispheric variability and short-term reproducibility of hypercapnia functional MR imaging (fMRI) in healthy volunteers and to assess the effects of different methods of quantification and normalization.
MATERIALS AND METHODS: Sixteen healthy volunteers, (7 women and 9 men) underwent hypercapnia fMRI with a clinical 1.5T scanner; 8 underwent scanning twice. We determined BOLD amplitude changes using a visually defined block design or automated regression to end-tidal (ET) carbon dioxide (CO2). Absolute percent signal intensity changes (PSC) were extracted for whole-brain, gray matter, and middle cerebral artery territory, and also normalized to ETCO2 change. Intersubject and intrasubject (between hemispheres and sessions) coefficients of variation (COV) were derived. We assessed the effects of different quantification methods on reproducibility indices using the t test and U tests.
RESULTS: The mean change in ETCO2 was 7.8 ± 3.3 mm Hg. Averaged BOLD increases varied from 2.54% to 2.92%. Short-term reproducibility was good for absolute PSC (4.8% to 10%) but poor for normalized PSC (range, 24% to 27% COV). Intersubject reproducibility varied between 11% and 23% for absolute PSC and, again, was poorer for normalized data (32% to 39%). Interhemispheric reproducibility of absolute PSC was excellent ranging between 1.24 and 2.16% COV.
CONCLUSIONS: In conclusion, quantification of cerebrovascular reactivity with use of hypercapnia fMRI was found to have good between-session and very good interhemispheric reproducibility. The technique holds promise as a diagnostic tool, especially for sensitive detection of unilateral disease.
Cerebral blood flow (CBF) is tightly controlled to meet metabolic demands according to neural activity levels and to counterbalance systemic variation in blood pressure. Several control mechanisms are integrated to maintain adequate cerebral tissue perfusion. Metabolic, myogenic, and local mechanisms interact to maintain constant CBF despite wide variations in arterial blood pressure, referred to as cerebral autoregulation. Cerebrovascular reserve (CVR) reflects the spare capacity of the cerebral circulation to increase CBF in response to regulatory vasodilatory stimuli. The main cerebral vasodilatory stimulus is carbon dioxide (CO2); hence, exogenous CO2 and acetazolamide have been used to assess CVR. Alterations in these cerebral hemodynamic control parameters are present in various disease states1–4 with increasingly recognized pathophysiologic relevance. Tools for noninvasive mapping of cerebrovascular parameters including CVR would thus be desirable to complement emerging physiologic imaging techniques to predict tissue at hemodynamic risk.5–7
Many techniques have been developed for noninvasive assessment of CVR. In a clinical setting, measurements of CVR are performed with use of transcranial Doppler (TCD), by quantifying change in flow velocity in the middle cerebral artery (MCA) on a vasodilatory challenge such as hypercapnia, apnea, or acetazolamide. Positron-emission tomography and single-photon emission CT (SPECT) have also been used to detect and locate quantitative brain perfusion changes with similar stimuli.8–10 However, these latter 2 techniques are not widely available, are expensive, and involve significant radiation, therefore limiting their clinical usability. More recently, the blood oxygen level–dependent (BOLD) functional MR imaging (fMRI) technique has been applied to assess CVR in healthy volunteers and in patients,5,7,11–13 but the quantitative reliability is uncertain. Recent publications have also shown the value of hypercapnia BOLD fMRI to predict normal and abnormal hemispheric CVR.14
BOLD fMRI is sensitive to changes in the local deoxyhemoglobin concentration, which varies with perfusion and blood volume changes in a complex but qualitatively predictable manner. BOLD contrast is based on the fact that deoxyhemoglobin acts as an endogenous contrast agent. BOLD hypercapnia fMRI detects increase in tissue oxygenation resulting from increases in CBF induced by CO2 inhalation while demands in oxidative metabolism remain constant. This mechanism leads to an observed BOLD signal intensity increase related to measurable T2* prolongation. Over a reasonable range of increases in CO2, there is a linear increase in CBF and cerebral blood volume (CBV) with an exponential plateauing close to maximal dilation.15,16 It has previously been assumed that BOLD signal intensity increases also linearly with CO2, but this is speculative and more recent theoretic models of hemodynamic BOLD response suggest a nonlinear relationship.17–19 Previous studies have used simple ratios to normalize fMRI response to varying levels of hypercapnia expressed as % BOLD signal intensity or %R2*change/mm HG end-tidal (ET)CO2 change.5,7,12,20 The validity of this approach has not been tested.
There are potential advantages of this technique versus TCD because BOLD fMRI assesses the hemodynamic effects on tissue oxygenation rather than blood flow velocity. It is noteworthy that BOLD hypercapnia fMRI 1) affords whole-brain mapping and, hence, assessment of regional heterogeneity and 2) is sensitive to vasodilatory effects mediated by collateral arteries, inaccessible to TCD techniques. The disadvantage of hypercapnia fMRI is its semiquantitative nature and complex dependence on blood flow and volume changes and on the ratio between arterial and venous blood volume. Arterial spin-labeling (ASL) would be a quantitative method to directly assess CBF and, hence, CVR; however ASL has poor signal-to-noise intensity at 1.5T, which is still currently the main clinical platform for MR imaging.
Current clinical practice is to increasingly offer brain MR imaging to patients with cerebral ischemia (stroke and transient ischemic attack) that would allow for uncomplicated routine use of an integrated CVR assessment. Application of such a technique to map CVR would be extremely useful in patients with a hemodynamically significant brain lesion such as an arteriovenous malformation whereby the normal autoregulatory mechanisms have been altered, or in patients with intracranial or extracranial steno-occlusive disease to evaluate future stroke risk, perhaps even as a risk stratification tool for carotid intervention. However, the clinical usefulness of such a test is dependent on sufficient reliability and reproducibility of the diagnostic test.
Therefore, the aim of our study was to assess the reliability of a standardized quantitative hypercapnia fMRI protocol with use of a clinical 1.5T scanner. Specifically, we aimed to assess intrasubject and intersubject reproducibility for different analysis techniques and CO2 normalization. For the different analysis techniques, we determined BOLD amplitude changes by using a visually defined block design or automated regression to ETCO2.
Materials and Methods
Study Sample
Sixteen healthy volunteers (7 women and 9 men with a mean age of 27.7 years (age range, 19–34 years)) without neurologic signs and symptoms and no medical or drug history were included in the study after giving informed written consent. All subjects were medication free and were asked not to consume caffeine for the 4 hours before the scanning session. Eight subjects underwent subsequent scans on the same day after a 30-minute break outside the scanner. The hospital research and development department and medical school research ethics committee approved the study.
MR Imaging
MR imaging studies were performed on a clinical 1.5T scanner (Intera; Philips, Best, the Netherlands). A standard 8-channel head coil was used for imaging, with use of a gradient-echo echo-planar sequence with the following parameters: TR, 3500 ms; TE, 60 ms; flip angle, 90°; matrix size, 64 × 64; FOV, 192 mm; sections, 33; thickness, 3 mm; and no gap. A total of 160 volumes (approximately 9 minutes acquisition time) were acquired for each experiment.
CO2 Stimulation
We controlled ETCO2 by using a standard nonrebreathing anesthetic circuit with 2 one-way valves to prevent rebreathing. The circuit incorporated a reservoir bag of 2 L to compensate for any large tidal volume breaths. Subjects breathed through a comfortably secure standard anesthetic mask to ensure a closed circuit. ETCO2 was continuously monitored via a sampling tube at the mouthpiece level. ETCO2 recordings were made during the entire experiment, and a reading was taken every 3.5 s to correlate with the length of time of each volume acquisition or 1 dynamic (ie, 1 TR).
We used free gas flow of 1-L/min O2 and 8-L/min air and then provided a fixed amount of CO2 (1 L/min), therefore providing 10% CO2. Control of CO2 gas flow was via an external source outside of the MR imaging scanner. We used high 10% CO2 to achieve maximal vasodilation, and we monitored the ETCO2 level aiming for an increase in ETCO2 between a 7- and 8-mm Hg change. This was performed by 2 experienced and medically qualified practitioners (S.D.G., S.K.) who were familiar with the experiment setup. During the 9-minute long paradigm, all of the subjects underwent 2 periods of hypercapnia and 3 periods of normocapnia. We also continuously monitored the subjects’ blood pressure, pulse, and arterial oxygen saturations continuously by using a MR compatible device (In vivo; Siemens, Malvern, Pa).
Data Analysis
We analyzed all data using FSL software (http://www.fmrib.ox.ac.uk/fsl/), FMRI Expert Analysis Tool (FEAT) deploying standard preprocessing with high-pass filtering, and smoothing and motion correction using MCFLIRT.21 During the FSL analysis, the ETCO2 data acquired during the scanning session are incorporated into the design matrix of the general linear model by the 2 methods described below. A Gaussian model was used for modeling the hemodynamic response function. A limitation of our CO2 setup included a sampling delay in ETCO2 from patient to capnometer outside the scanner room. There was also a second time lag of BOLD signal intensity change after increase in ETCO2 level. The FSL analysis method compensated for these time lags by allowing for a temporal derivative of the design matrix waveform. This essentially shifts the waveform slightly in time during the analysis to enable a better fit of the data and model.
Visually Defined Boxcar Analysis
We created individual hypercapnia activation maps using FEAT by visually assigning each volunteer's ETCO2 time series data in a boxcar format (ie, defining on-and-off periods according to the ETCO2 changes). On-periods were defined as peak or plateau of ETCO2 levels after a greater than 5-mm Hg change from each volunteer's baseline ETCO2 level (Fig 1). The boxcar data were then incorporated into the general linear model and used for analysis.

Example of boxcar analysis method showing BOLD signal intensity timecourse and corresponding ETCO2 model.
Automated Regression Model with Use of ETCO2 Data
The second method was fully automated, whereby the hypercapnia-induced activation maps were derived from direct regression of the BOLD signal intensity to the entire ETCO2 time series as input regressor (Fig 2). By using the actual ETCO2 data, we exploited the full dynamic range of CO2 variations.

Example of automated analysis method showing BOLD signal intensity timecourse and corresponding ETCO2 time course.
Absolute and ETCO2 Normalized BOLD Amplitudes
Activation maps with use of both methods of analysis were thresholded at the uncorrected P < .05 level, therefore allowing for all significantly activated voxels to be represented on the CVR maps. Mean percent signal intensity changes (PSC) were derived for the following tissue compartments: whole brain (ie, supratentorial brain), gray matter, white matter, and gray matter MCA territory. Linear normalization to the ETCO2 change averaged during the experiment was performed as in previous studies5,7,22,23 for the datasets resulting in PSC/mm Hg ETCO2 change.
Tissue Segmentation and Region-of-Interest Definition
After this, we segmented the fMRI images into gray and white matter using FMRIB Automated Segmentation Tool (FAST) from FSL.24 A manually drawn MCA template territory was also created in standard space. This was then joined with each volunteer's gray matter template to make individualized gray matter MCA territory masks. Absolute mean PSC were derived from these tissue compartments with FSL software FEAT query after conversion from standard space into functional space.
Asymmetry Index
The degree of hemispheric asymmetry (hemispheric asymmetry index [hAI]) was determined according to hAI = 200 X (PSC dominant [handedness] hemisphere − PSC nondominant hemisphere)/(PSC sum both hemispheres) as in studies by Baciu et al,25 de Boorder et al,26 and Kaminogo et al.27 The 95% confidence intervals were also given for hAI.
Statistical Analysis
We performed statistical calculations using the Statistical Package for Social Sciences version 15.0 (SPSS, Chicago, Ill) software. We then compared data using the Student t test and the Mann-Whitney U test for parametric and nonparametric variables, respectively. Correlations were performed with the Pearson correlation coefficient. Intersubject and intrasubject variability were expressed as coefficients of variation. Statistical significance was set as P < .05. Data are expressed as mean percentage signal intensity change ± SD. The statistical software STATA (StataCorp, College Station, Tex) was used for linear regression analysis and to assess data for nonlinearities by use of a quadratic term. Regression involved use of a random intercept model to allow for multiple observations.
Results
General Findings
All 16 subjects tolerated the experiment well without adverse reactions during the course of study to inhalation of CO2. The observed motion as estimated by FSL was within acceptable limits in all cases (ie, < 3 mm in x-, y-, and z-axis). There were no significant alterations in blood pressure, pulse, and oxygen saturations after CO2 stimulation. The mean baseline ETCO2 level was 35.4 ± 5 mm Hg. The mean peak ETCO2 level was 43.3 ± 5.6 mm Hg. The mean change in ETCO2 was 7.8 ± 3.3 mm Hg. The intersubject coefficient of variation (COV) of ETCO2 change was 41%, and intrasubject reproducibility was 29%.
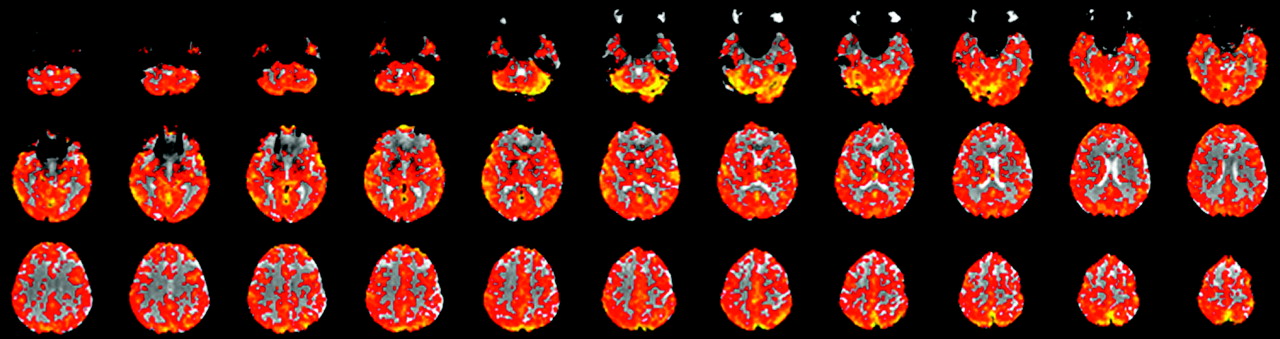
All subjects showed strong and qualitatively symmetric BOLD signal intensity increases during hypercapnia. Significant responses were not limited to brain parenchyma with high z-scores in both gray matter and the subarachnoid spaces and lower z-values in white matter voxels with a clearly visible interface between gray and white matter (Fig 3). As expected, absolute PSC were higher for gray matter than with white matter (Table 1).

A CO2 reactivity map of a healthy volunteer showing symmetric hemispheric signal intensity change after stimulation with CO2. This is a contrast map denoting magnitude of signal intensity change.
Summary data of normalized and nonnormalized mean PSC and SD for both analysis methods
Absolute PSC and ETCO2 Levels
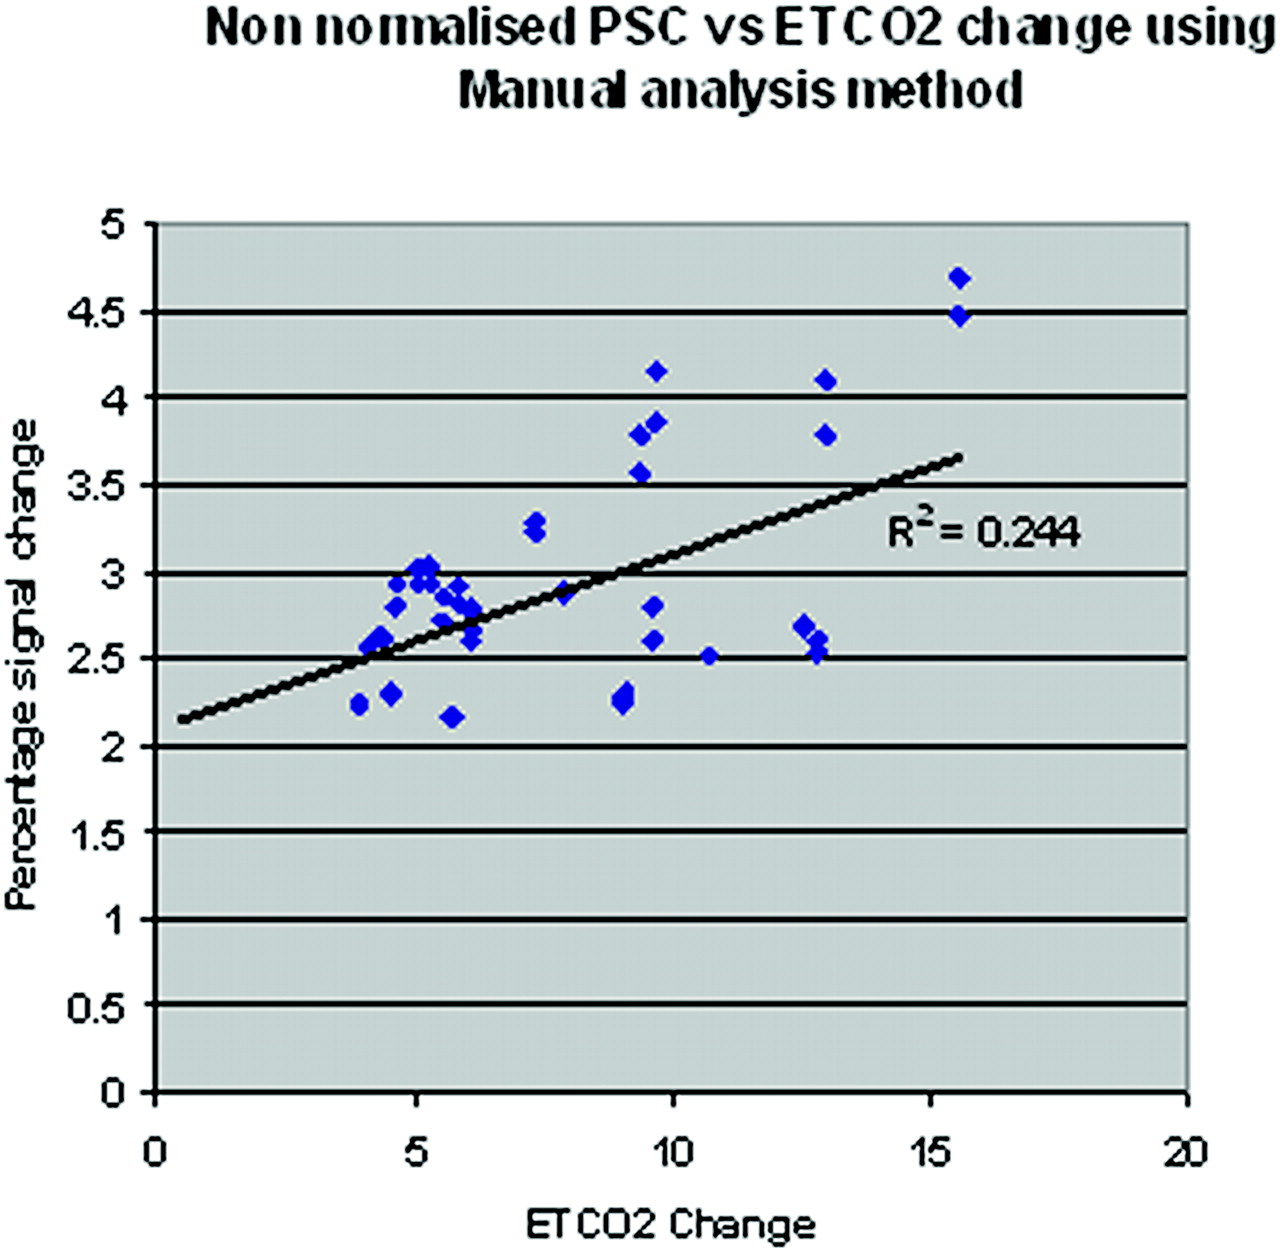
We found a significant linear correlation between PSC and ETCO2 levels for both methods of BOLD amplitude estimation (R2 = 0.244 (P = .0001) for the boxcar method and R2 = 0.18 (P = .003) for the automated method (see Fig 4 for boxcar method). To further explore the possibility of a nonlinear relationship between PSC and ETCO2 change, we tested the data using a quadratic term and found no significant relationship.

Scatterplot showing the relationship between change in ETCO2 and nonnormalized BOLD PSC for the boxcar method.
Reliability of Boxcar vs Automated Determination of Absolute PSC
There was a small but significant bias toward higher absolute PSC when using the boxcar compared with the regression model that failed to reach significance for whole-brain gray matter (Table 1). A good test-retest short-term reproducibility was found for absolute PSC for both the boxcar and regression analysis methods (range, 4.8% to 10% COV; Table 2).
Test retest reliability given as COV for nonnormalized and normalized data for both analysis methods*
Intrasession, interhemispheric reproducibility of absolute PSC was excellent (range, 1.2% to 2.2% COV) depending on tissue and analysis method. Correlation between hemispheric absolute PSC was very high for both analysis methods (0.963–0.993; P = .0001). Mean hemispheric asymmetry indices were low for all regions of interest (Table 3).
Hemispheric asymmetry index values given for boxcar and automated analysis methods*
Effect of ETCO2 Normalization
Linear correction for ETCO2 unexpectedly led to substantial degradation of reliability. Short-term reproducibility of normalized data yielded an unacceptably high COV of more than 23% (Table 2). Deterioration was significant for all the regions/tissue types except for whole-brain and gray matter data analyzed with the automated method that still showed a similar trend.
Between-Subject Variation
Intersubject variability.
Similar to intrasubject reproducibility, the between-subject variation was lower for the nonnormalized compared with CO2 normalized data (Table 4). Of note, the automated regression analysis method revealed lower COV, suggesting improved correction for between-subject variability of physiologic factors with lowest values for the MCA territory (14.2%) and white matter (11.3%).
Intersubject nonnormalized and normalized COV given for both analysis methods
Discussion
Our study investigated both the short-term reproducibility and intersubject variability of hypercapnia BOLD fMRI in a group of young healthy volunteers and compared various quantification methods. The main findings are that absolute BOLD signal intensity changes after 10% hypercapnia challenge 1) yield good short-term reproducibility (≤10%), 2) reveal very good interhemispheric reproducibility (< 4%), and 3) show better reproducibility and lower between-subject variability than BOLD ratios normalized to ETCO2.
BOLD fMRI techniques are becoming increasingly used in clinical studies. To be used as a diagnostic clinical test, the technique needs to be reliable (ie, precise and accurate). Accuracy of CVR assessments with hypercapnia fMRI has been assessed against SPECT,28 with favorable results. The reported BOLD signal intensity changes of 2.54% to 2.93% are also reasonably well in line with previously reported results with use of the same field strength and similar pulse sequence details (gradient echo-planar imaging with TR of 3800 ms and TE of 40 ms).12 Our reported absolute BOLD signal intensity changes in white matter were higher than other reported values; this finding is likely because of different gray and white matter segmentation techniques used. However, our normalized values are very similar to other published data.
Few formal short-term reproducibility studies of CVR assessment are available to date. MR imaging assessment with acetazolamide was reported to have a limited reproducibility of 26% to 28% for intersession COV.29 Leontiev and Buxton30 assessed the reproducibility of visual stimulation and mild hypercapnia by using ASL and BOLD at 3T. Of note, unacceptably poor reproducibility was seen for ASL, even at 3T. Furthermore, two-threefold larger intrasubject and intersubject variability were reported for absolute BOLD signal intensity changes (intrasubject COV, 21.4% to 35.0%; intersubject COV, 32.7% to 50.3%), but similar COVs were noted for normalized BOLD (intrasubject COV, 23.3% to 28.6%; intersubject COV, 30.6% to 33.0%). The differences can be explained by technical differences with smaller hypercapnia challenge, much smaller region-of-interest analysis, and longer between-scan interval in their study akin to increased variation. The improvement seen in our study for absolute BOLD changes underlines the advantage of a submaximal 10% CO2 stimulation compared with mild hypercapnic stimulus of 5% CO2, which may have led to greater variability in the ETCO2 change and BOLD signal intensity change. With use of higher CO2 stimulus, larger ETCO2 changes are achieved causing near maximal vasodilation. The resulting BOLD signal intensity change can then be expected to be near maximum as well and, hence, more stable across imaging sessions as evidenced by our lower COV.
Our interhemispheric data analysis revealed very low COV and very strong interhemispheric correlation for the absolute BOLD signal intensity change. Also by using an amplitude-based assessment of hemispheric asymmetry, we found excellent symmetry for hypercapnia fMRI, with mean hAI ranging between −1.92 and 0.84. This method of data analysis provides a highly comparable measure by intrinsic correction for a number of potential sources of variations, such as physiologic baseline variations in CO2 level and cerebral blood flow, variation in respiratory effort, and ETCO2 and scanner performance. The hAI has been used previously in clinical studies of patients with carotid artery disease with SPECT.26,27 So far, hAI has not been reported for hypercapnia fMRI. We consider the assessment of the hemispheric symmetry of the BOLD response particularly relevant for future clinical studies examining patients with unilateral diseases such as carotid artery disease. Inasmuch as confidence intervals (3% to 8%) from our young healthy volunteers can be translated to patients, hypercapnia fMRI promises sensitive detection of stroke risk and CVR in those with hemodynamically significant steno-occlusive diseases. Additional studies in older volunteers and patients are warranted to ascertain the diagnostic specificity and sensitivity of this test.
An important factor to consider for quantitative reproducible hypercapnia fMRI relates to variations in ETCO2 levels. In our data, a significant linear relationship was found between absolute PSC and ETCO2 levels, explaining 24% and 18% of the mutual variance according to the boxcar and regression analyses. There was no indication of a nonlinear interaction, but the linear dependence resulted mainly from the lower end of ETCO2 change (Fig 4). Because of the experimental setup chosen in view of safe clinical applicability, we had limited data at higher ETCO2 changes; hence, we are unable to exclude a nonlinear relationship.
Normalization of PSC to ETCO2 change substantially degraded the reliability of hypercapnia fMRI with significant worsening of short-term reproducibility and increase in intersubject variability. This was surprising against the clear linear interrelation observed and the proposed linear normalization method to present the data corrected for the ETCO2 change in % signal intensity change/mm Hg change format. The disadvantage of normalization with use of ratios to mm Hg and ETCO2 change can be explained by its oversimplification of the true interrelation that is not unity and moreover is expected to depend on the absolute baseline value with nonlinear behavior at maximal vasodilation. For strong hypercapnic challenges, BOLD normalizations to mm Hg CO2 change cannot be recommended. Of note, this rationale was also applied in a previous large patient study using TCD for assessment of CVR in which no normalization to ETCO2 was performed.31
The main limitation of our study was the inclusion of only young healthy volunteers and a limited number of subjects. However, the study size was sufficient to demonstrate that 10% hypercapnia provides a robust BOLD signal intensity increase, allowing reliable and reproducible CVR assessment. It remains to be shown whether similar short-term reproducibility can be achieved in older subjects and patients. However, the setup was chosen for its tolerability, and we expect no difficulties for older subjects and patients.
The second limitation was the dependence of absolute BOLD PSC on the end-expiratory CO2 change. Nevertheless, we demonstrated that the standard proposed normalization was inadequate and impaired reproducibility. Until the full nature of this relationship is clarified, control of potential confounding effects from ETCO2 via regression analysis is required for systematic evaluation of CVR between subjects and effects from interventions. From a practical aspect for clinical application, additional standardization of ETCO2 may further mitigate the problem. Dynamic end-tidal forcing, described by Wise et al20, independently sets ETCO2 to desired levels by rapid alteration of inspired gases on a breath-by-breath basis via computer feedback. This method targets the desired ETCO2 change and may further improve reproducibility for individual CVR mapping.
Conclusions
In conclusion, assessing cerebrovascular reactivity with use of hypercapnia fMRI and absolute BOLD amplitude estimation was found to be safe and reproducible in healthy volunteers. Analysis of absolute BOLD signal intensity change yielded good short-term and very good interhemispheric stability. Larger normative data in older healthy subjects and patient studies are warranted to probe the clinical usefulness of CVR assessment by quantitative hypercapnia fMRI.
References
- Received October 21, 2008.
- Accepted after revision December 11, 2008.
- Copyright © American Society of Neuroradiology
In this issue


Jump to section
Related Articles
Cited By...
- Effects of short-term continuous positive airway pressure withdrawal on cerebral vascular reactivity measured by blood oxygen level-dependent magnetic resonance imaging in obstructive sleep apnoea: a randomised controlled trial
- Cerebral misery perfusion due to carotid occlusive disease
- Impaired Cerebrovascular Reactivity Predicts Recurrent Symptoms in Patients with Carotid Artery Occlusion: A Hypercapnia BOLD fMRI Study
- Quantitative Measurement of Cerebrovascular Reactivity by Blood Oxygen Level-Dependent MR Imaging in Patients with Intracranial Stenosis: Preoperative Cerebrovascular Reactivity Predicts the Effect of Extracranial-Intracranial Bypass Surgery
- Impaired Cerebrovascular Reactivity With Steal Phenomenon Is Associated With Increased Diffusion in White Matter of Patients With Moyamoya Disease