
Abstract
BACKGROUND AND PURPOSE: The internal carotid artery (ICA) in the rat has a single extracranial branch, which supplies the muscles of mastication. The rat ICA also has multiple intracranial branches including (from proximal to distal): multiple small perforating arteries which supply the hypothalamus and the anterior choroidal artery which supplies the choroid plexus and part of the basal ganglia. At the ICA terminus, the vessel bifurcates into the anterior and middle cerebral arteries. The purpose of this study was to demonstrate selective injection of ICA branches in the rat.
MATERIALS AND METHODS: Microcatheters (μcath1 and μcath2) were fabricated by plugging the tip of 169-μm outer diameter polyimide tubing and perforating the sidewalls. A 450-μm polydimethyl-siloxane cylinder was affixed to the distal tip of μcath2 but not μcath1. We evaluated the territory of μcath1 injection ex vivo using magnetization-prepared rapid acquisition of gradient echo MR imaging of brain specimens injected at necropsy. Territories of μcath1 and μcath2 injection were evaluated in vivo with dynamic susceptibility-weighted contrast-enhanced MR imaging. The territory of μcath2 also was evaluated in vivo with fused static microPET/T1 MR images performed after [18F] fluorodeoxyglucose (18FDG) injection. We evaluated additional catheterized and injected animals at 48 hours using physical examination, T2 MR images, and postmortem brain histologic specimens.
RESULTS: Gadolinium-diethylene-triamine pentaacetic acid (Gd-DTPA) and 18FDG injected through μcath1 selectively opacified the ipsilateral cerebral hemisphere, with no contralateral opacification. Gd-DTPA injected through μcath2 selectively opacified the territories of the hypothalamic perforating arteries, and anterior choroidal artery. There was no iatrogenic complication 48 hours after 20- to 25-minute injections performed with μcath1 or μcath2.
CONCLUSIONS: We have developed 2 microcatheters which can be placed in the ICA for selective injection of its branches. One microcatheter selectively injects the ipsilateral cerebral hemisphere. The other selectively injects only the hypothalamus and lateral thalamus.
Selective intra-arterial cerebral injection achieves high first-pass concentrations within the injected arterial territory, whereas other territories and organs receive the contrast material, drug, or other agent at far lower concentrations by recirculation only. Despite myriad potential therapeutic applications, selective intra-arterial cerebral injection currently is used infrequently in the clinical setting: for determination of language dominance before temporal lobe surgery,1 delivery of chemotherapy for retinoblastoma and some malignant gliomas,2–5 and delivery of spasmolytics in cerebral vasospasm.6 Preclinical selective injection of internal carotid artery (ICA) branches has been accomplished in large animals.7,8 However, large animal models can be expensive and cumbersome for preclinical therapeutic evaluation. A paucity of preclinical models for selective intra-arterial cerebral injection–dependent therapies may be the major reason why intra-arterial drug delivery has not yet been applied to other neurologic diseases.
In the rat, the intracranial branches of the ICA and their territories (Fig 1A, -B) have been well defined by previous meticulous infarction studies,9,10 and multiple groups have injected the cervical or proximal intracranial ICA.11,12 However, in our experience, injection via an end-port microcatheter with its tip positioned in the cervical or proximal ICA fails to achieve a selective injection. Rather, contrast material is delivered to the bilateral forebrain, including the cortical mantle and deep nuclei bilaterally (unpublished data, Zink et al, 2006) owing to a complete, robust circle of Willis. Recently, selective injection of the rat middle cerebral artery (MCA) was achieved in a stroke model.13 To our knowledge, the work presented here represents the first example of selective controlled injection of an entire single cerebral hemisphere with contralateral sparing and of selective injection of the hypothalamus and the lateral thalamus.

Schematic representation of the rat intracranial ICA and the territories of its proximal branches. A, Intracranial arterial supply in the rat with rostral oriented upward. The ACA, MCA, PCA, HTA, and AchoA are labeled.10 B, Axial representation of the rat forebrain 2 to 4 mm caudal to bregma shows the medial thalamus (MH) and lateral thalamus (LT), the thalamus (Thal), internal capsule (IC), and striatum (St). The vascular territories of the HTAs (gray hatching) and AchoA (filled black) are shown.
Materials and Methods
Estimation of ICA Diameter
Four adult male (270–330 g) Sprague-Dawley rats were anesthetized with isoflurane gas anesthesia (1%–2% in 2-L O2) delivered via facemask and transferred to a 3T MR imaging system (GE Healthcare, Milwaukee, Wis) equipped with 50-mT/m gradients and software version E2.0-M4–0502.b. The head was placed within a 6-element, 5-cm inner diameter (ID) inductively coupled solenoid resonator constructed in house (Doug Ballon, CBIC, New York, NY), tuned via trimmer capacitors on the end elements and matched via adjustment of a trimmer capacitor in series with the drive loop. A 3D-magnetization transfer protocol was used with acquisition parameters: 8-cm FOV, 36 sections at 1-mm thickness (interpolated to 72 sections at 0.5 mm), 33.3-ms TR, 3.5-ms TE, 2 averages, and a 384 × 256 matrix reconstructed to 512 × 512. The ICA axial diameter was measured with in-house software (Jon Dyke, CBIC). The caliber of the rat intracranial ICA was estimated at 420 ± 160 μm at the level of the anterior choroidal artery (AchoA) origin (Fig 2A) and 360 ± 160 μm at the ICA terminus (Fig 2B). Error values represent the transverse dimension of a voxel. The Weill-Cornell Medical College Animal Care and Use Committee (IACUC) reviewed and approved this method.

3D time-of-flight imaging was used to estimate the ICA diameter. Axial images show the origins of the AchoA (A) and MCA (B). Arrowheads show the course of the AchoA. M and A represent the origins of the MCA and ACA. The HTAs are not visualized.
Microcatheter Fabrication
Single-thickness polyimide tubing with an outer diameter of 169 μm (MicroLumen, Tampa, Fla) was cut into 25-cm segments. One end of each segment was plugged with Miller Stephenson 907 epoxy (Danbury, Conn). Four pairs of 35-μm perforations were made in each microcatheter at 1-mm intervals from the epoxy-plugged tip with use of an Excimer laser (Maestro 1000; Resonetics, Nashua, NH). Adjacent perforations were offset 90° (Fig 3). At the end of each length of tubing, opposite from the perforations and bulb, a threaded injection hub was glued in place with Miller-Stephenson 907 epoxy. These perforated, end-plugged microcatheters were designated “μcath1”.

Rat brain arterial microcatheters. A, The 169-μm OD polyimide microcatheters have 35-μm perforations at 1, 2, 3, and 4 mm proximal to the tip (arrows). Every other pair of perforations is oriented 90° from the previous. The distal tips of both microcatheters are plugged with epoxy. The bottom microcatheter has a 450-μm bulb glued to its distal tip (μcath2). Markings at the top of the image represent millimeters. B, Methylene blue injected through μcath1 demonstrates side port positions.
Polydimethyl-siloxane (Sylgard 184; Dow Corning, Auburn, Mich) was mixed with curing agent in a 10:1 weight ratio, degassed, injected into 450-μm ID polyimide tubing, and cured at 80°C for 2 hours. A 450-μm-diameter polydimethyl-siloxane (PDMS) cylinder was removed from its tubing, cut into 1-mm segments, and plasma treated. Each PDMS segment was affixed to an epoxy-plugged, 25-cm-long polyamide tubing segment with use of Bondit B-45TH (Reltek, Santa Rosa, Calif) and cured at 100°C. The microcatheters were perforated and glued to injection hubs as previously described. These microcatheters were designated “μcath2”. Segments of 7–0 polypropylene suture were threaded into the lumen of each microcatheter to increase rigidity.
Microcatheter (μcath) Placement
Sixteen adult male (270–330 g) Sprague-Dawley rats were anesthetized with isoflurane gas (1%–2% in 2-L O2) delivered via facemask. In the supine position, a 24-gauge tail vein microcatheter was placed. In nonsurvival animals (#1–#2), 3000-u/kg intravenous heparin was given in 2-mL normal saline (NS). In survival animals (#3–#16), intravenous tobramycin was administered (180 mg/kg in NS). The right ICA was exposed via a midline neck incision, the occipital artery sacrificed, the pterygopalatine artery permanently ligated, and an arteriotomy made in the right external carotid artery as described previously.14 A novel microcatheter (μcath) loaded with 7–0 polyamide suture was introduced into the cervical ICA and advanced 22 to 23 mm (μcath1) or 18 to 20 mm (μcath2) cephalad to the carotid bifurcation. With the μcath in place, a temporary ligature was placed around the cervical ICA. This surgical method and the imaging methods described below were reviewed and approved by the Weill-Cornell Medical College IACUC.
Angiographic and Perfusion Imaging Methods (Table)
Experimental protocol*
After placement of μcath1, a thoracotomy was performed on animal #1, and the right atrium was sectioned. Gadolinium-diethylene-triamine pentaacetic acid (Gd-DTPA; Magnevist, Wayne, NJ) diluted 1:1 with NS was injected via the ICA microcatheter (300 μL for 10 minutes). The brain was removed, incubated in 10% neutral buffered formalin (Sigma-Aldrich, St. Louis, Mo) for 30 minutes, then transferred to a 5-element, 1.7-cm ID resonator tuned and matched as above. Ex vivo MR imaging was performed with the 3D magnetization-prepared rapid gradient echo protocol15 with acquisition parameters: pulse TR, 20.3 ms; TI, 725.0 ms; TE, 9.6 ms; FOV, 1 cm × 2 cm; section thickness, 100 μm; matrix size, 128 × 256 × 60–76; flip angle, 60°; and number of averages, 4. The above parameters yielded a spatial resolution of 100 μm × 78 μm × 78 μm. After placement of μcath1, animals #2 to #4 were transferred to the MR imaging scanner, where dynamic susceptibility-weighted contrast-enhanced perfusion-weighted imaging (DSC-MR) was performed before, during, and after Gd-DTPA injection. Magnevist:saline (1:1) was delivered intracranially via a manual injection with a 3-mL syringe (Becton Dickinson, Sandy, Utah) and a smartPrep kit (TopSpins, Ann Arbor, Mich) in series with μcath1. Magnevist:saline was injected for 10 s during dynamic gradient-echo (GE) imaging with parameters: FOV, 5 cm × 4.5 cm; section thickness, 2 mm; TR, 14 ms; TE, 7 ms; matrix, 256 × 256; flip angle, 20°; TR, 1.4 s/section, and a total imaging time of 120 s. After placement of μcath2, DSC-MR imaging was performed on animals #5 to #7 with use of the same methods. Animals #3 to #7 were sacrificed immediately after imaging.
After placement of μcath2, animal #8 was transferred to a microPET focus 220 (CTI; Siemens, Malvern, Pa) with transaxial FOV, 19 cm; rostrocaudal FOV, 7.6 cm; and spatial resolution, 1.3 mm. An injection of 20 μCi [18F] fluorodeoxyglucose (18FDG) in 10-μL NS was administered via μcath1 for 1 minute. Five minutes later, a 1-minute acquisition was performed. Five minutes later, and with the animal in the same position, 412 μCi in 206 μL was injected for 10 s via tail vein. Five minutes later, a second 1-minute acquisition was performed. The animal was removed from the microPET system and transferred to the MR imaging scanner, where axial T1-weighted images were acquired with a 5-cm-diameter solenoid resonator (receiver coil) described above. Acquisition parameters included FOV, 4 cm; section thickness, 2 mm; matrix, 256 × 192; number of averages, 2; TR, 400 ms; and TE, 14 ms.
List-mode data from both microPET scans were summed and reformatted in 3 planes. Using PMOD image analysis software (Zurich, Switzerland), we manually coregistered 3D microPET images according to the external contour of the injection nidus. MicroPET images then were manually coregistered with raw axial T1 MR images and sagittal and coronal reformats according to the external contour of the brain. For the purpose of substructure analysis, the anterior aspect of the ear canal, seen as blooming susceptibility on MR images, was considered to be 6 mm caudal to bregma.16,17 All subsequent descriptions of rat brain anatomy will be in the rostrocaudal coordinate system of Paxinos and Watson17 with (−) and (+) mm described in relationship to bregma.
Evaluation of Iatrogenic Neurologic Injury
In animals #9 to #16, a scalp incision was made before ICA catheterization, and a transcranial Doppler probe was secured 3 mm posterior and 5 mm lateral to bregma with Krazy Glue (Columbus, Ohio). In animals #9 to #12, μcath1 was advanced 22 to 23 mm under continuous Doppler monitoring, and 400-μL NS was injected for 20 minutes. In animals #13 to #16, μcath2 was advanced 18 to 20 mm, and 200-μL NS was injected for 20 minutes. In all 8 animals, the ICA microcatheter was removed within 25 minutes of placement; pulsatile, anterograde flow was re-established in the cervical ICA, and the neck incision was closed. Forty-eight hours later, paw strength and the presence or absence of a circular gait were tested. The animals were re-anesthetized and transferred to the MR imaging scanner. T2 fluid-attenuated inversion recovery was performed with use of the previously described 5-cm-diameter solenoid receiver coil with the following parameters: FOV, 5 cm; ST, 2 mm; matrix, 256 × 160; number of averages, 2; TR, 9.6 ms; TE, 111 ms; and TI, 2.1 ms. Static GE images were acquired with the same parameters described for dynamic imaging of animals #2 to #7. Animals were sacrificed with intraperitoneal injection of high-dose pentobarbital (SleepAway; Fort Dodge Laboratories, Fort Dodge, Iowa). Brains were removed, cut into 100-μm sections, and stained with 1% triphenyl tetrachloride (TTC; Sigma, St. Louis, Mo), as described.18
Results
Right Hemispheric Injection (μcath1)
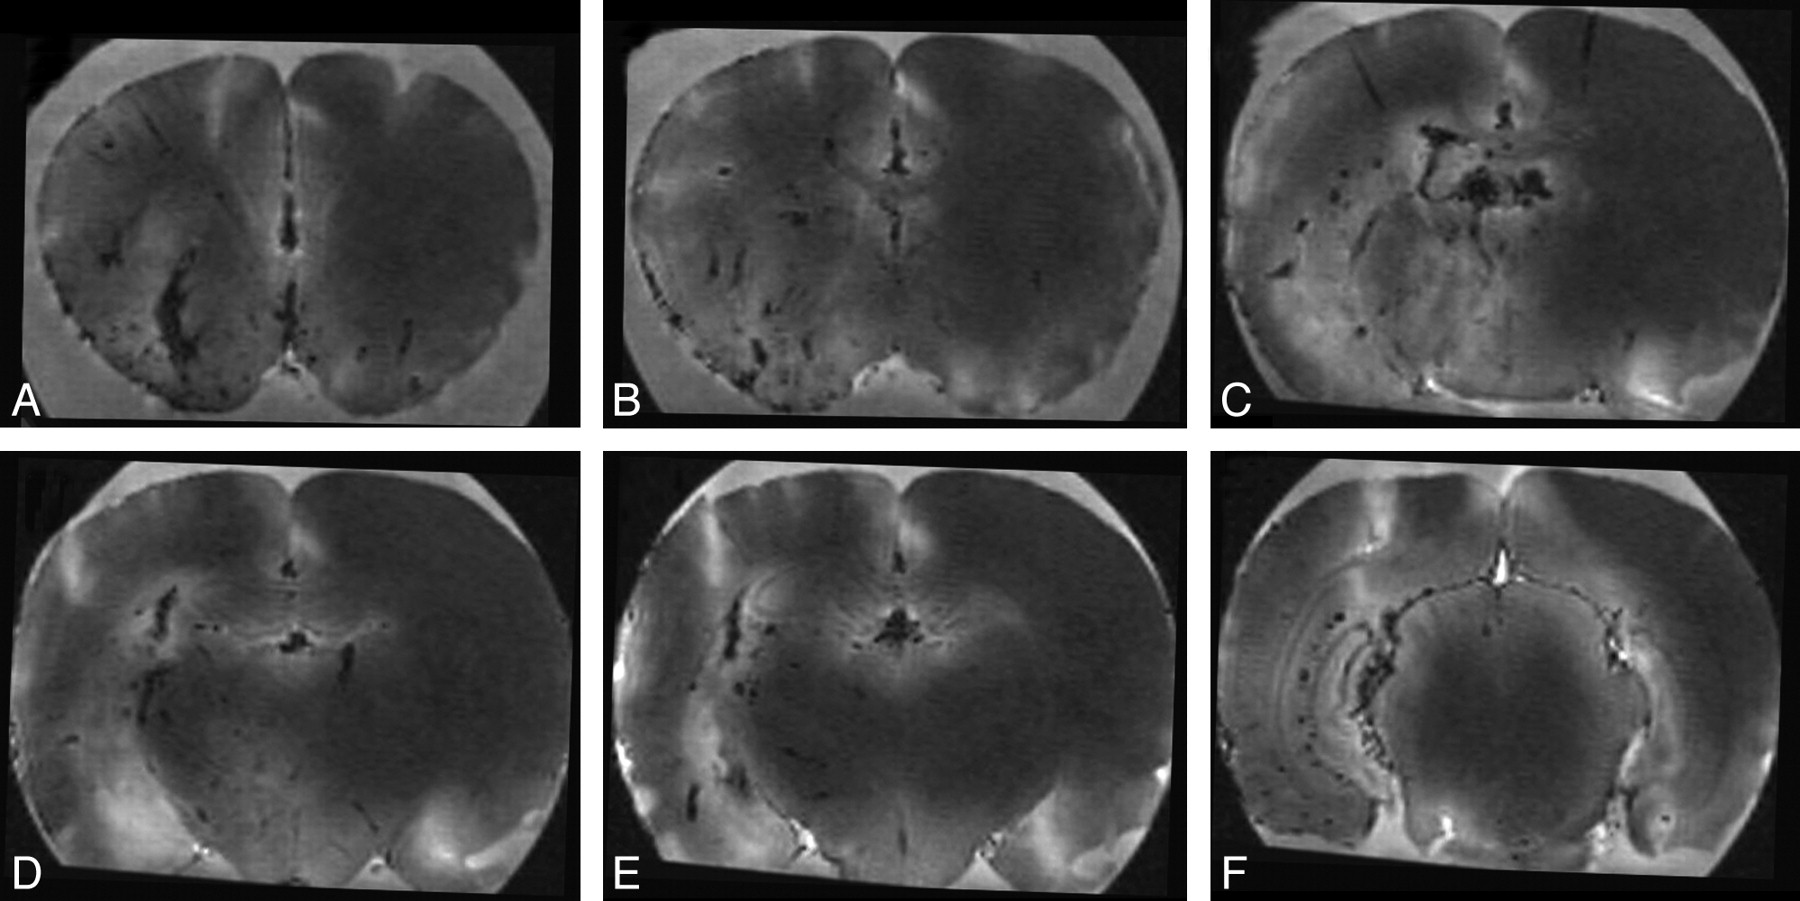
A single animal was injected with gadolinium via μcath1 at the time of sacrifice by section of the right atrium (Fig 4). Because ex vivo MR imaging was performed with a T1-weighted GE sequence and owing to concentration effect, intravascular Gd-DTPA appears dark. Gd-DTPA opacified multiple branches of the right ICA, with minimal discernible arterial cross filling. Venous structures were identified on the basis of wall irregularity and nontubular morphologic features. Patchy regions of high signal intensity seen predominantly throughout the parenchyma of the right cerebral hemisphere are thought to represent a T1 effect of gadolinium at lower concentrations within the brain parenchyma. The cytoarchitecture of the hippocampus (Fig 4E, -F) also was well seen ipsilateral to the selective arterial injection. From a phylogenetic perspective, it is also interesting to note the prominence of the olfactory perforating artery (Fig 4A) relative to the size of other perforating vessels.

Injection of gadolinium into a single cerebral hemisphere demonstrated with ex vivo MR imaging. Thoracotomy was performed and the right atrium sectioned before injection of 300 μL of 1:1 Magnevist:saline for 10 minutes via μcath1. The brain was removed, soaked in formalin for 30 minutes, and imaged with an MPRAGE sequence. Axial images A to F are displayed from rostral to caudal at +1.7, +0.5, −0.9, −1.8, −2.1, and −5.8 mm relative to bregma. Gadolinium-containing vessels were dark because of the concentration effect. Midline vessels (not labeled), irregular vessels seen in long axis within the deep brain, and linear vessels within the cortical mantle are thought to represent veins. Branching vessels arising from the ventral aspect and vessels seen in cross-section are thought to represent arteries (not labeled).
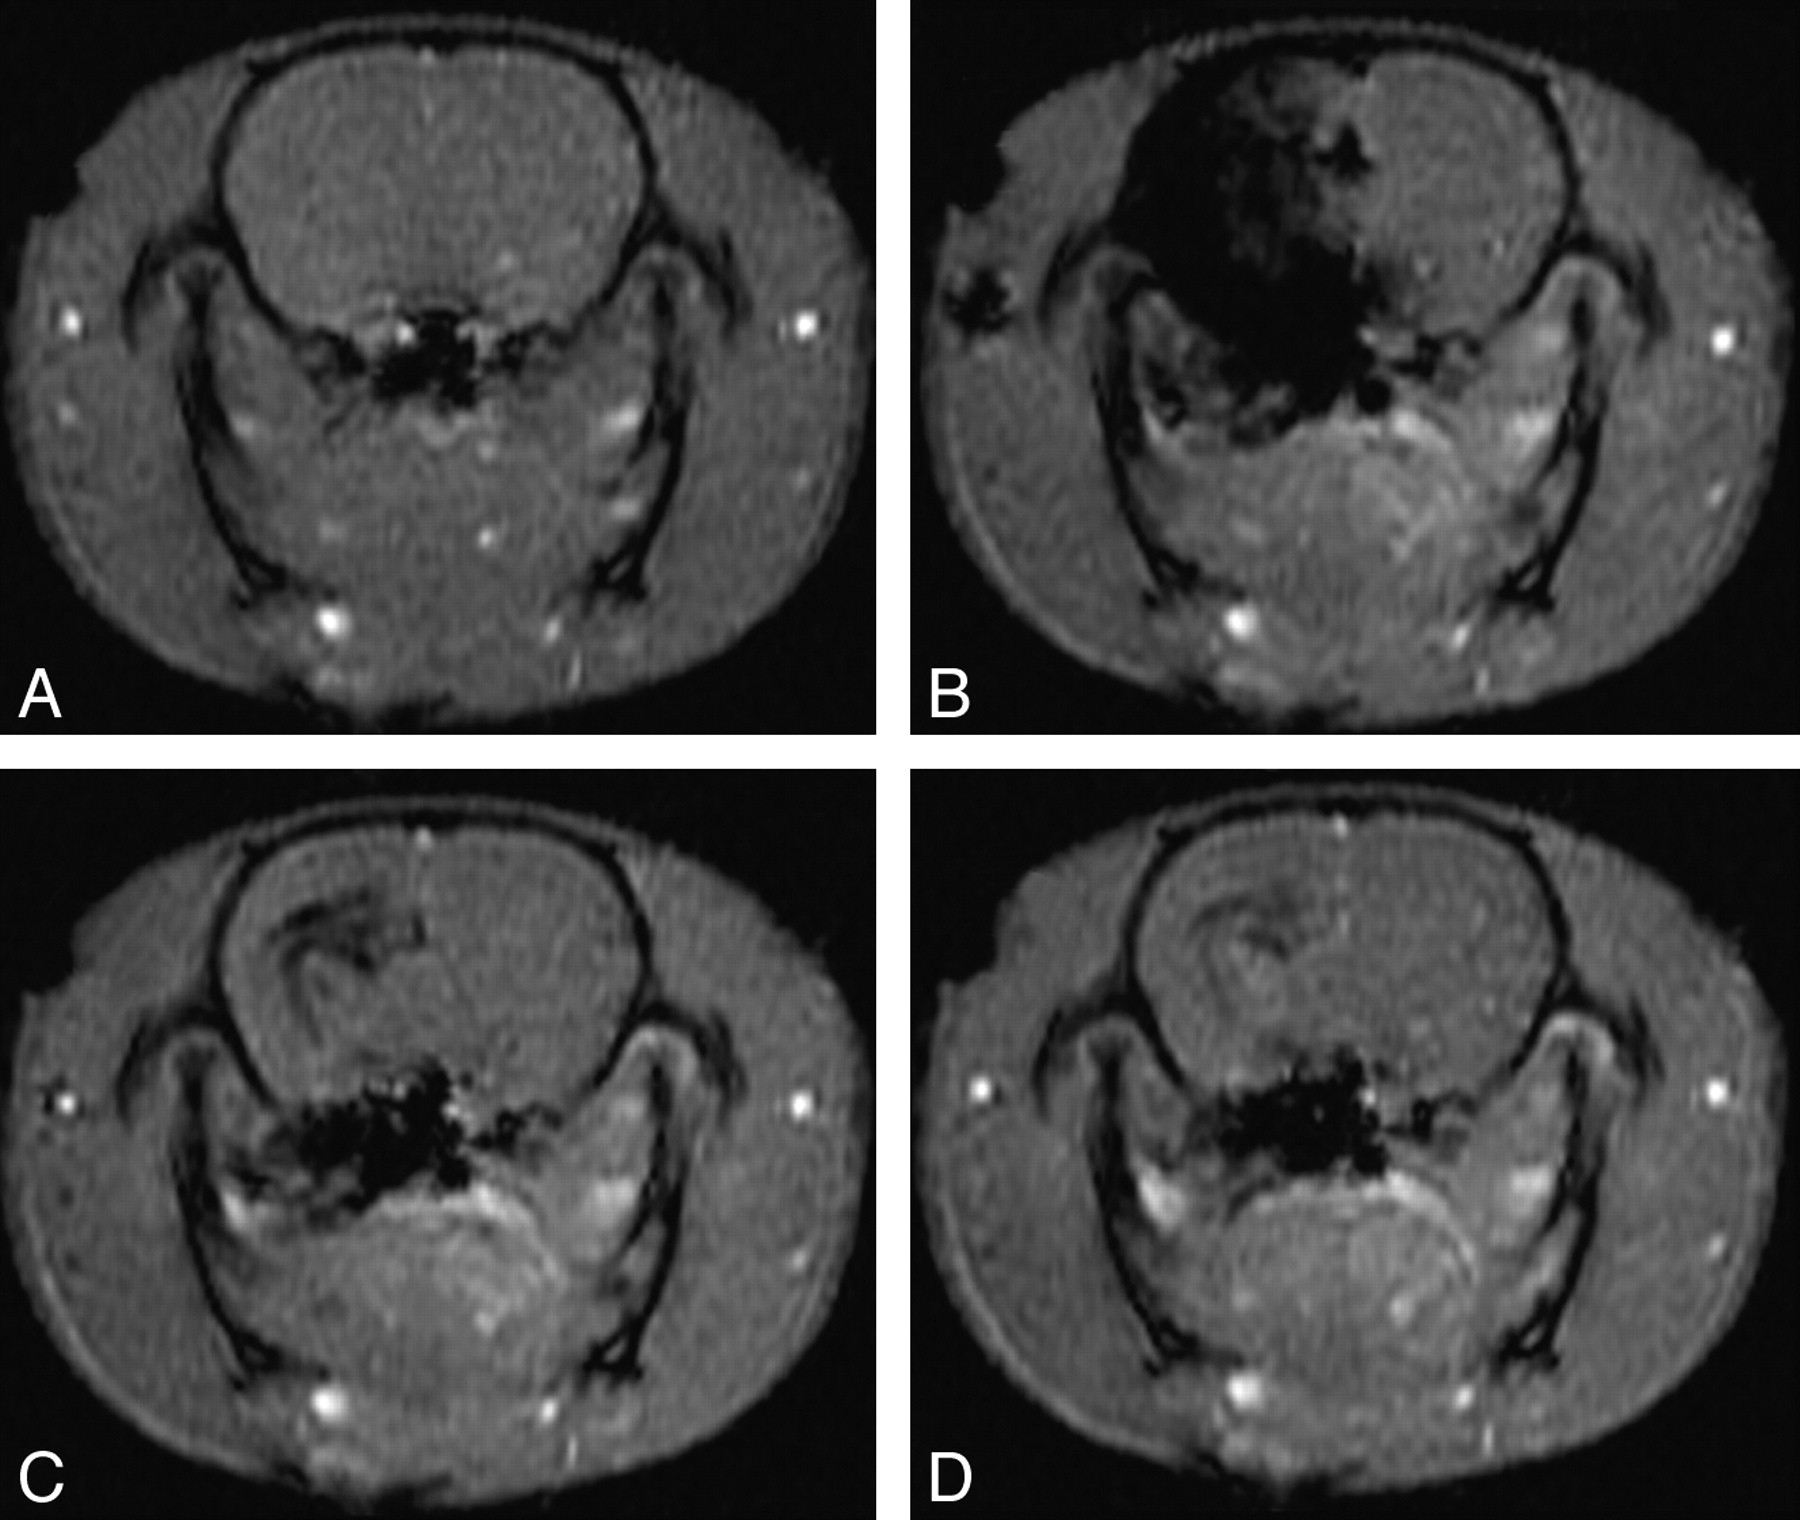
To further validate the injected territory of μcath1, we acquired DSC-MR images through a single axial plane in the rat forebrain 2 mm posterior to bregma (−2) during and after Gd-DTPA injection. Because of concentration effects, Gd-DTPA also appeared dark on this susceptibility-sensitive sequence. Three consecutive animals were injected via μcath1 during DSC-MR imaging. Images from a representative animal (Fig 5) demonstrate parenchymal (Fig 5B), venous (Fig 5C), and washout (Fig 5D) phase opacification of the right cerebral hemisphere. Most of the contralateral hemisphere was spared with the exception of the hippocampus, which opacified bilaterally. During the initial phases of injection via μcath1, the hypothalamus opacified with the rest of the hemisphere but demonstrated patchy regions of delayed washout. Persistent Gd-DTPA seen in the region of the internal capsule on later images was thought to represent slow perithalamic venous drainage.

Single cerebral hemisphere injection during dynamic MR imaging. Axial T1 GE-MR images acquired 4 to 5 mm caudal to bregma at −1 (A) and 5 (B), 11 (C), and 29 (D) s after the beginning of a 10-s hand-injection of Magnevist:NS via μcath1 (ie, from 0–10 s).
Selective Injection of Hypothalamus and Lateral Thalamus (μcath2)
A 450-μm PDMS cylinder was affixed to the distal tip of μcath2 to occlude the ICA terminus and its branches, allowing selective injection of the ipsilateral forebrain deep gray structures with sparing of the neocortex. Three animals injected with Gd-DTPA via μcath2 during DSC-MR imaging also demonstrated multiple phases of opacification. In the parenchymal phase, gadolinium was seen in the hypothalamus bilaterally, right greater than left, and the lateral thalamus in the expected distribution of the anterior choroidal territory (Fig 6B). Immediately after cessation of the injection, the anterior choroidal territory opacification washed out, whereas the hypothalamic opacification persisted (Fig 6C, -D). As in Fig 5, a subsiding rim of opacification in the region of the internal capsule along the ventricular margin was thought to represent perithalamic venous drainage.

Selective injection of gadolinium into the hypothalamus and lateral thalamus. Axial T1 GE-MR images acquired 4 to 5 mm caudal to bregma at 0 (A), 6 (B), 12 (C), and 30 s (D) after the beginning of a 10-s hand-injection of Magnevist:NS via μcath2.
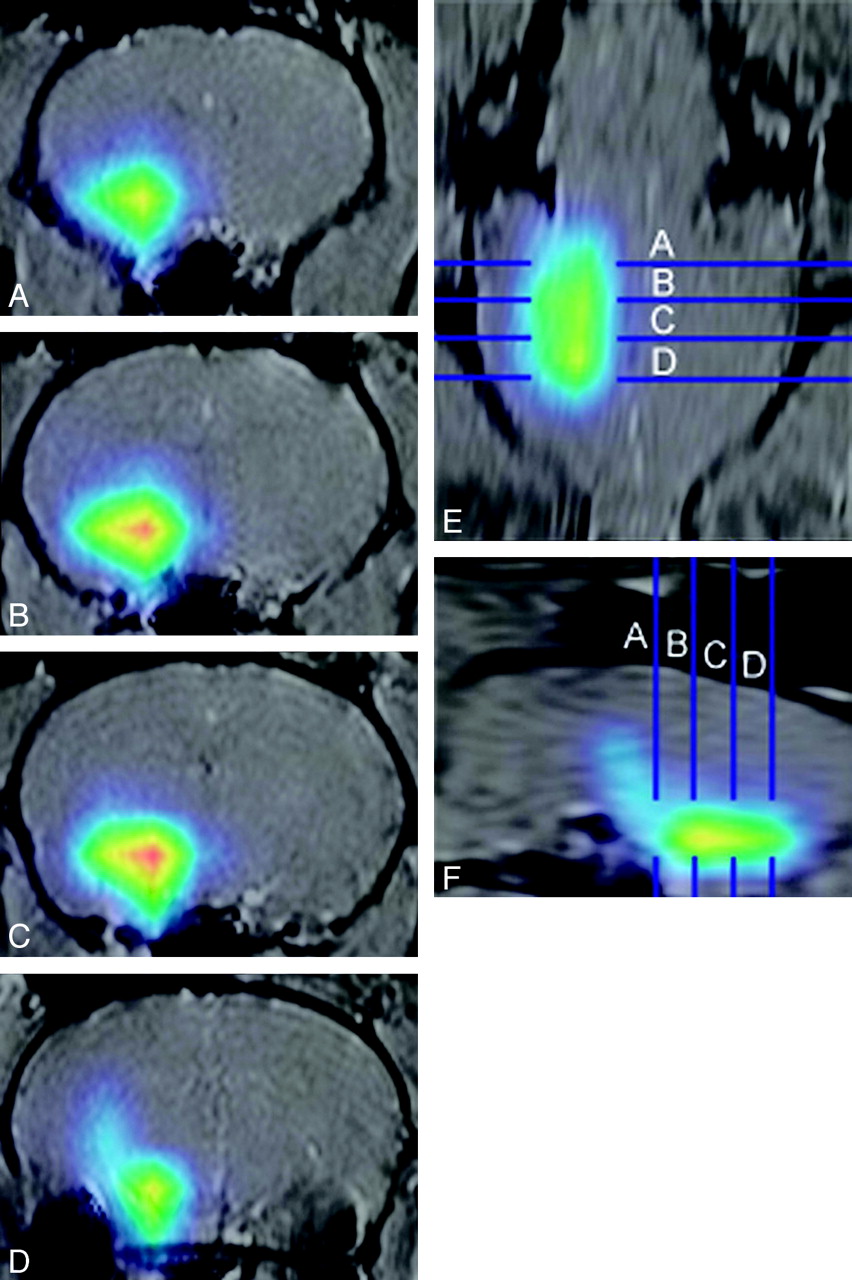
18FDG injected through μcath2 perfused an ellipsoid region of the ventral forebrain (Fig 7). With use of the ear canal susceptibility effect as a landmark (Fig 7D), the position of each axial image relative to bregma was determined for anatomic correlation.16,17 The volume of rat brain occupied by 195 μCi/mL or greater was approximately 180 μL, centered in the region of the hypothalamus (−1.3 mm to −4.5 mm relative to bregma) and tuber cinereum (−1.8 to −3.3) according to the coordinates of Paxinos and Watson.17 Absence of activity in the anterior choroidal territory (lateral thalamus) was attributed to early washout of the lateral thalamus. This interpretation is consistent with data from dynamic MR images. In addition, the substantia nigra (−6.3 to −4.8) did not opacify, consistent with arterial supply to the rostral midbrain predominantly arising from the posterior circulation. As in previous images, a taillike region of activity extending superiorly and caudally from the main collection was thought to represent persistent activity within perithalamic veins.

Selective injection of 18FDG into the hypothalamus. MicroPET data were acquired 5 minutes after injection of 20 μCi 18FDG in 10-μL NS via μcath2 for 1 minute. Activity is represented by red (270 μCi/mL), yellow (240 μCi/mL), green (195 μCi/mL), and blue (90 μCi/mL). MicroPET images were manually coregistered with 2-mm-thick axial T1-weighted images and coronal and sagittal reformats. Panel A is 1.0 to 0.8 mm rostral to bregma. Panels B through D are 1.0 to 1.2 mm, 3.0 to 3.2 mm, and 5.0 to 5.2 mm caudal to bregma, respectively.
Evaluation of Iatrogenic Injury Caused by ICA Catheterization
In 4 animals, μcath1 was placed under continuous laser Doppler monitoring of the ipsilateral MCA territory and was left in place for up to 25 minutes. A transient flow reduction of 5% to 15% was seen within the MCA territory in 2 of 4 animals. In both cases, the slight Doppler abnormality initially was detected just as μcath1 crossed the skull base. In both animals, this small Doppler abnormality abated within 5 minutes. In 4 animals, μcath2 was placed under continuous laser Doppler monitoring of the ipsilateral MCA territory and was left in place for up to 25 minutes. Four of 4 animals demonstrated a 40% to 73% reduction in flow within the MCA territory. In all 4 animals, the Doppler abnormality persisted until μcath2 was removed and the ICA revascularized. Forty-eight hours after removal of the microcatheter, no motor or visual field defect was detected on examination of these 8 animals. There was no T2-bright lesion or extraosseous region of susceptibility effect on MR imaging examination. There was no intracranial hemorrhage on necropsy and no TTC lesion on histologic examination to suggest infarction.
Discussion
The first microcatheter (μcath1) selectively injected the ipsilateral cerebral hemisphere as shown in Figs 4 and 5. This represents a more selective injection than whole-brain injection previously achieved by use of an end-hole microcatheter placed in the distal cervical or proximal intracranial ICA (not shown). Penetrating branch arteries from the circle of Willis are well seen throughout the rostral and caudal right forebrain in Fig 4, illustrating selective opacification of branches supplying the right cerebral hemisphere. Combining known vascular territorial anatomy with the imaging data shown here, μcath1 convincingly injected the ipsilateral MCA, anterior cerebral artery (ACA), anterior choroidal artery, and hypothalamic artery.
A limitation of the single-hemisphere injection technique was its dependence on injection pressure. For example, differences in the opacified arteries/territories in Figs 4 and 5 likely reflect differing injection pressures in the animals shown. In Fig 4, a postmortem animal injected vigorously (30 μL/min), there was opacification of bilateral ACA branches, likely representing leakage around the catheter tip. In Fig 5 (a living animal, which was hand-injected more gently), the ACA territories were not opacified. Opacification of the contralateral hypothalamus was not pressure dependent, presumably reflecting robust intraparenchymal collaterals within the hypothalamus.
The second microcatheter (μcath2) selectively injected deep gray structures of the rat forebrain, particularly the hypothalamus, as shown in Figs 6 and 7. In 3 of 3 animals injected via μcath2 in real time, the anterior choroidal territory opacified later than the adjacent hypothalamus with an earlier washout. Yet, in a single animal injected with 18FDG via μcath2, no activity was seen selectively in the hypothalamus. Reconciling these findings hinges on the technical considerations. Acquisition of microPET images shown in Fig 7 was started 5 minutes after tracer injection. Given the rapid washout of the lateral thalamus visualized in Fig 6, it is not surprising that activity was absent in the lateral thalamus during delayed microPET image acquisition. Indeed, the flow dynamic of the hypothalamus and lateral thalamus is quite different, possibly suggesting a dual blood supply to the lateral thalamus.
Because these devices ultimately are intended for use in valuable rat models for neurologic disease, safety is of great importance. In healthy rats presented here, μcath1 was shown to cause scarce or no perturbation in arterial flow within the MCA territory, anatomically the most likely region to suffer flow deficit because of ICA catheterization. In contrast, μcath2 predictably demonstrated a significant (40%–73%) flow reduction consistent with MCA occlusion. However, postprocedure analysis showed no detectable lasting effect of a brief (up to 25 minutes) MCA occlusion. There was no infarction, intracranial hemorrhage, or detectable neurologic deficit in 4 of 4 of animals catheterized with μcath1 or in 4 of 4 animals catheterized with μcath2.
Conclusions
The techniques shown here exemplify selective intra-arterial cerebral injection in the rat. To our knowledge, the devices described here represent the first examples of selective injection of a unilateral cerebral hemispheric (μcath1) and of the hypothalamus and lateral thalamus (μcath2). Moving forward, these techniques hold promise for delivery of novel therapeutic agents, including but not limited to pharmacotherapy, viral vectors, nucleotide probes, radiolabeled ligands, nanoparticles, or stem cells in rat models for neurologic disease.
Acknowledgments
We would like to thank Yuchuan Ding, MD, PhD, (University of Texas at San Antonio) for technical instruction, Marta Pelowitz of MicroLumen (Tampa, Fla) for donating polyimide tubing, and Greg Gillen of Gillen Surgical Company (New York, NY) for donating microvascular surgical supplies. Figs 1A and B were created by Seth Labenz of Topos Graphics (New York, NY).
Footnotes
This work was funded by a Cornell University Intramural Seed Grant (2006).
References
- Received April 16, 2008.
- Accepted after revision January 14, 2009.
- Copyright © American Society of Neuroradiology
In this issue


Jump to section
Related Articles
Cited By...
- No citing articles found.