
Abstract
BACKGROUND AND PURPOSE: BOLD MR imaging combined with a technique for precision control of end-tidal pCO2 was used to produce quantitative maps of CVR in patients with Moyamoya disease. The technique was validated against measures of disease severity by using conventional angiography; it then was used to study the relationship between CVR, vascular steal, and disease severity.
MATERIALS AND METHODS: A retrospective analysis comparing conventional angiography with BOLD MR imaging was performed on 11 patients with Moyamoya disease. Iso-oxic cycling of end-tidal pCO2 between 2 target values was performed during BOLD MR imaging. CVR was calculated as the BOLD signal difference per ΔpCO2. CVR was correlated with the presence of Moyamoya or pial collaterals and the degree of Moyamaya disease as graded by using a modified Suzuki score.
RESULTS: A good correlation between mean CVR and Suzuki score was found for the MCA and ACA territories (Pearson correlation coefficient, −0.7560 and −0.6140, respectively; P < .0001). A similar correlation was found between mean CVR and the presence of pial and Moyamoya collateral vessels for combined MCA and ACA territories (Pearson correlation coefficient, −0.7466; P < .0001). On a voxel-for-voxel basis, there was a greater extent of steal within vascular territories with increasing disease severity (higher modified Suzuki score). Mean CVR was found to scale nonlinearly with the extent of vascular steal.
CONCLUSIONS: Quantitative measures of CVR show direct correlation with impaired vascular supply as measured by the modified Suzuki score and enable direct investigation of the physiology of autoregulatory reserve, including steal phenomenon, within a given vascular territory.
Abbreviations
- ACA
- anterior cerebral artery
- AFNI
- analysis of functional neuroimages
- AIF
- arterial input function
- ANOVA
- analysis of variance
- BOLD
- blood oxygen level−dependent
- CBF
- cerebral blood flow
- CVR
- cerebrovascular reactivity
- CO2
- carbon dioxide
- ΔSpCO2
- difference per change in end-title carbon dioxide
- f
- fraction
- ICA
- internal carotid artery
- MCA
- middle cerebral artery
- neg
- negative
- PCA
- posterior cerebral artery
- pCO2
- partial pressure of carbon dioxide
- PET
- positron-emission tomography
- pO2
- partial pressure of oxygen
- pos
- positive
- SE
- standard error
- SPECT
- single-photon emission CT
- TIA
- transient ischemic attack
Moyamoya disease is a vasculopathy affecting the proximal circle of Willis vessels characterized by progressive narrowing and formation of secondary collaterals. Blood flow distal to these stenotic vessels is thought to be maintained by a drop in vascular resistance mediated by small artery and arteriolar vasodilation. As the disease progresses, however, the ability of this autoregulatory system or CVR to preserve adequate perfusion is lost when compensatory arteriolar dilation reaches a maximum. Further increases in vascular resistance at the stenosis ultimately lead to tissue oligemia and possible ischemia. Measurements of CVR can provide valuable information for planning surgical revascularization, assessing the success of such a procedure postoperatively, and predicting the recurrence of focal neurologic symptoms.1
CO2 is a potent vasodilator of the cerebrovasculature and can be used to test the responsiveness of the autoregulatory system in patients with Moyamoya disease. Measurements of regional CBF in response to changes in end-tidal pCO2 have been accomplished with a number of imaging modalities, including PET,2 SPECT,3 CT perfusion,4 and MR imaging. BOLD MR imaging measurement of CVR, in particular, has recently been shown to be highly correlated with CBF in patients with steno-occlusive disease caused by atherosclerosis or Moyamoya disease.5
Blood flow manipulation is typically achieved by acetazolamide stress, breath-hold techniques, or steady-state CO2 administration via a face mask. These methods produce inconsistent changes in blood flow. Recently, we have implemented a method for precision control of end-tidal pCO2 and pO2,6 permitting accurate correlation of changes in pCO2 with the BOLD MR imaging signal-intensity response.
In the present work, we used BOLD MR imaging in combination with precise iso-oxic changes in end-tidal CO2 to produce quantitative maps of CVR in patients with Moyamoya disease. To validate this technique, we correlated measurements of CVR with a modified Suzuki score, which is a measure of disease severity determined by using conventional angiography. The measures of CVR were also correlated with the extent of steal within a vascular territory, providing insight into the physiology of autoregulatory reserve.
Materials and Methods
Patient Selection and Angiographic Scoring
A retrospective analysis was performed on patients with Moyamoya disease undergoing cerebrovascular reactivity measurements before surgical revascularization at our institution. Ethics approval was obtained through our research institute's ethics committee and written consent was given by all participants. Patients without structural brain disease such as ischemic or hemorrhagic stroke and those with a prior conventional angiogram with 6-vessel injection obtained within 6 months before the CVR study were included in the study. A total of 11 patients who underwent a CVR study between October 2005 and June 2007 were evaluated.
The degree of Moyamoya disease as visualized on conventional angiography was scored by a neuroradiologist (D.J.M.) using a modified Suzuki score7: stage 0, no evidence of vessel disease; stage I, mild-to-moderate stenosis around the carotid bifurcation with absent or slightly developed ICA Moyamoya disease (almost all of both ACA and MCA branches are opacified in antegrade fashion); stage II, severe stenosis around the carotid bifurcation or occlusion of either the proximal ACA or MCA with well-developed ICA Moyamoya disease (either the ACA or MCA branches or both are clearly defective, but at least several of the ACA or MCA branches remain opacified in antegrade fashion); stage III, occlusion of both the proximal ACA and MCA with well-developed ICA Moyamoya disease (only a few of either the ACA or MCA branches or both are faintly opacified in antegrade fashion through the meshwork of ICA Moyamoya disease); and stage IV, complete occlusion of both the proximal ACA and MCA with an absent or a small amount of ICA Moyamoya disease (without opacification of either the ACA or MCA branches in antegrade fashion).
Each vascular territory was also assessed for the presence of Moyamoya or leptomeningeal collaterals. For the purpose of scoring these collaterals, a simple binary system was used (M−P− to indicate the absence of Moyamoya or pial collaterals, M+P− to indicate the presence of Moyamoya collaterals but the absence of pial collaterals, M+P+ to indicate the presence of Moyamoya and pial collaterals). The Table summarizes the demographic data and angiographic scoring for the 11 patients included in the study.
Clinical and angiographic characteristics of 11 patientsa
Cerebrovascular Reactivity by BOLD MR imaging
MR imaging was performed on a 3T Signa HD clinical MR imaging scanner (GE Medical Systems, Milwaukee, Wisconsin) equipped with 40 mT/m gradient coils and a standard head coil. A standard single-shot BOLD protocol with a spiral readout (TE, 40 ms) was used. The imaging time was 12 minutes for a total acquisition of 320 volumes. Each volume contained 28 sections with a resolution of 3.75 × 3.75 × 4.5 mm. High resolution T1-weighted images were obtained to provide anatomic coregistration. Patients breathed via a tight-fitting mask that was attached to a circuit consisting of a 3 valve manifold and reservoirs for externally supplied gas and exhaled gas. The valves are configured such that external gas is inhaled first and, if the breath size exceeds the gas flow entering the circuit, the balance of inhaled gas is made up with the previously exhaled gas (i.e., rebreathing). External gas is supplied by a custom built computer-controlled gas blender (Respiract; Thornhill Research, Toronto, Canada). It supplies O2, and mixtures of CO2 and N2 (nitrogen) with O2, to achieve target end-tidal CO2 and end-tidal O2 independent of breathing pattern.8 This resulted in near square wave transitions (within 1–3 breaths) and precise, sustained end-tidal gas levels. We used this approach to cycle end-tidal CO2 between 40 and 50 mmHg in 90 sec cycles while keeping end tidal O2 at 100 mmHg during BOLD signal acquisition.
Data Analysis
Image analysis was performed by using AFNI, an open-source environment used for processing and displaying functional MR imaging data. BOLD MR imaging data were transformed onto the Talairach coordinate system, and the BOLD data were temporally shifted and correlated with the patient's CO2 waveform. A least-squares regression analysis of the BOLD signal intensity versus the CO2 waveform for each voxel was calculated. For each vascular territory (ACA, MCA, PCA), the CVR for positively and negatively reacting voxels was determined. CVR for each voxel was calculated according to the following:

where ΔS is the change in MR signal intensity for a given voxel that occurs between peak and trough CO2 levels and ΔpCO2 is the change in end-tidal CO2 in mmHg. In healthy brain, CVR is positive, reflecting an increase in CBF in response to increasing pCO2. In areas of brain in which blood flow is reduced in response to increasing pCO2, CVR is negative. Areas of negative CVR are generally thought to be the result of the vascular “steal” phenomenon, whereby hypercapnea leads to diversion of blood from areas of brain where arterioles are maximally vasodilated and vascular resistance is already minimized to areas of the brain capable of decreasing vascular resistance in response to a CO2 stimulus.5
The mean of all positively reacting voxels in a vascular territory (Mean CVRpos) and the mean of all negatively reacting voxels in a vascular territory (Mean CVRneg) were calculated. The Mean CVRcombined for a given vascular territory was calculated as a weighted average of negative- and positive-reacting voxels as follows:

where fneg and fpos are the fraction of negatively and positively reacting voxels respectively.
Statistical Analysis
Statistical analysis was performed by using Prism (GraphPad Software, La Jolla, California). The correlation between Mean CVRcombined for the MCA and ACA territories and the modified Suzuki score, and the correlation between Mean CVRcombined for combined ACA and MCA territories and presence of Moyamoya and pial collaterals were calculated with a Pearson correlation coefficient. One-way ANOVA was performed to compare the Mean CVRcombined for vascular territories with different Suzuki scores. An unpaired t test was used to compare the Mean CVRcombined for vascular territories with and without Moyamoya or pial collaterals.
Results
The study group comprised 7 females and 4 males with an age range between 10 and 48 years. Five patients had unilateral disease and 6 patients had bilateral disease. A total of 66 vascular territories were analyzed (11 each of the right and left ACA, right and left MCA, and right and left PCA). CVR maps are shown for 2 patients with varying degrees of Moyamoya disease and the corresponding conventional angiograms for the affected vascular territories (Figs 1 and 2). The CVR maps qualitatively show a correlation between regional changes in CVR and angiographic features of Moyamoya disease.
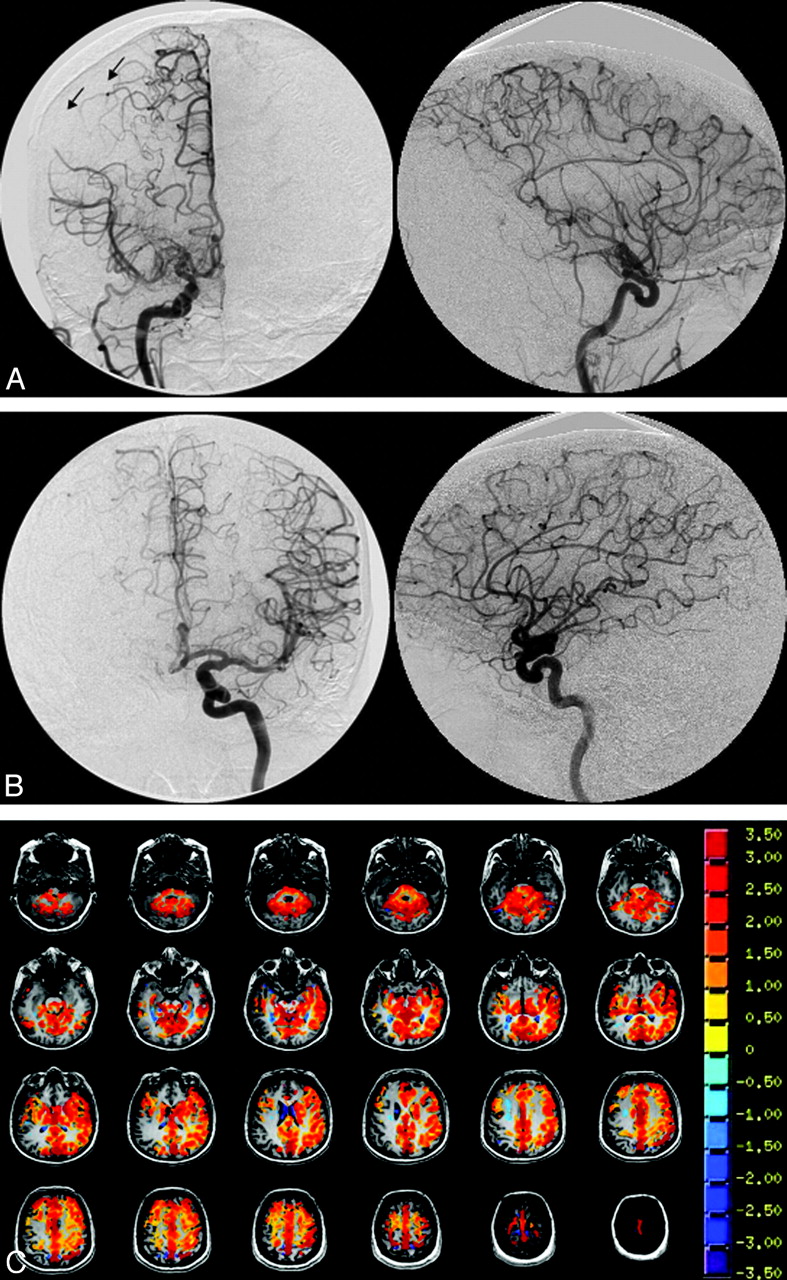
A 48-year-old woman who presented with headache. A, There is high-grade stenosis of the main trunk of the right MCA with “puff of smoke” vessels in the region of the stenotic trunk. B, The left ICA and branches are normal. Angiography indicates a Suzuki grade II right hemisphere and a Suzuki grade 0 left hemisphere. The arrows indicate surface collaterals extending from the right ACA to the right MCA territory. C, The CVR map shows absence of reactivity to the CO2 stimulus (no color) in the right parietal lobe, corresponding to the region of the angiographic collaterals.

A 35-year-old woman who presented with TIA consisting of left hemiparesis. A−C, The angiograms indicate severe stenosis/occlusion of the distal ICAs bilaterally, with extensive Moyamoya vessels consistent with Suzuki grade IV bilaterally. The left vertebral injection (C) shows extensive pial collateralization from the posterior circulation to the ACA and MCA territories. However, the right hemisphere is not as well supplied as the left. D, This finding is supported by the CVR map, which shows a greater extent of steal phenomena (blue pixels) in the right hemisphere compared with the left. Notice the preservation of reactivity in the relatively well-supplied cerebellum.
The Mean CVRcombined for MCA and ACA territories was plotted against the degree of Moyamoya disease as observed on conventional angiography and measured by the modified Suzuki score (Fig 3 ). There was good correlation between Mean CVRcombined and Suzuki class for MCA and ACA territories (Pearson correlation coefficient, −0.7560 and −0.6140, respectively); however, the correlation was better for the MCA territory. Vascular territories with Suzuki score >0 had a statistically significant lower CVR score compared with disease-free areas (1-way ANOVA, P < .0001 for MCA and ACA territories). There was a decreasing trend of Mean CVRcombined with increasing disease score, but the difference was not statistically significant.
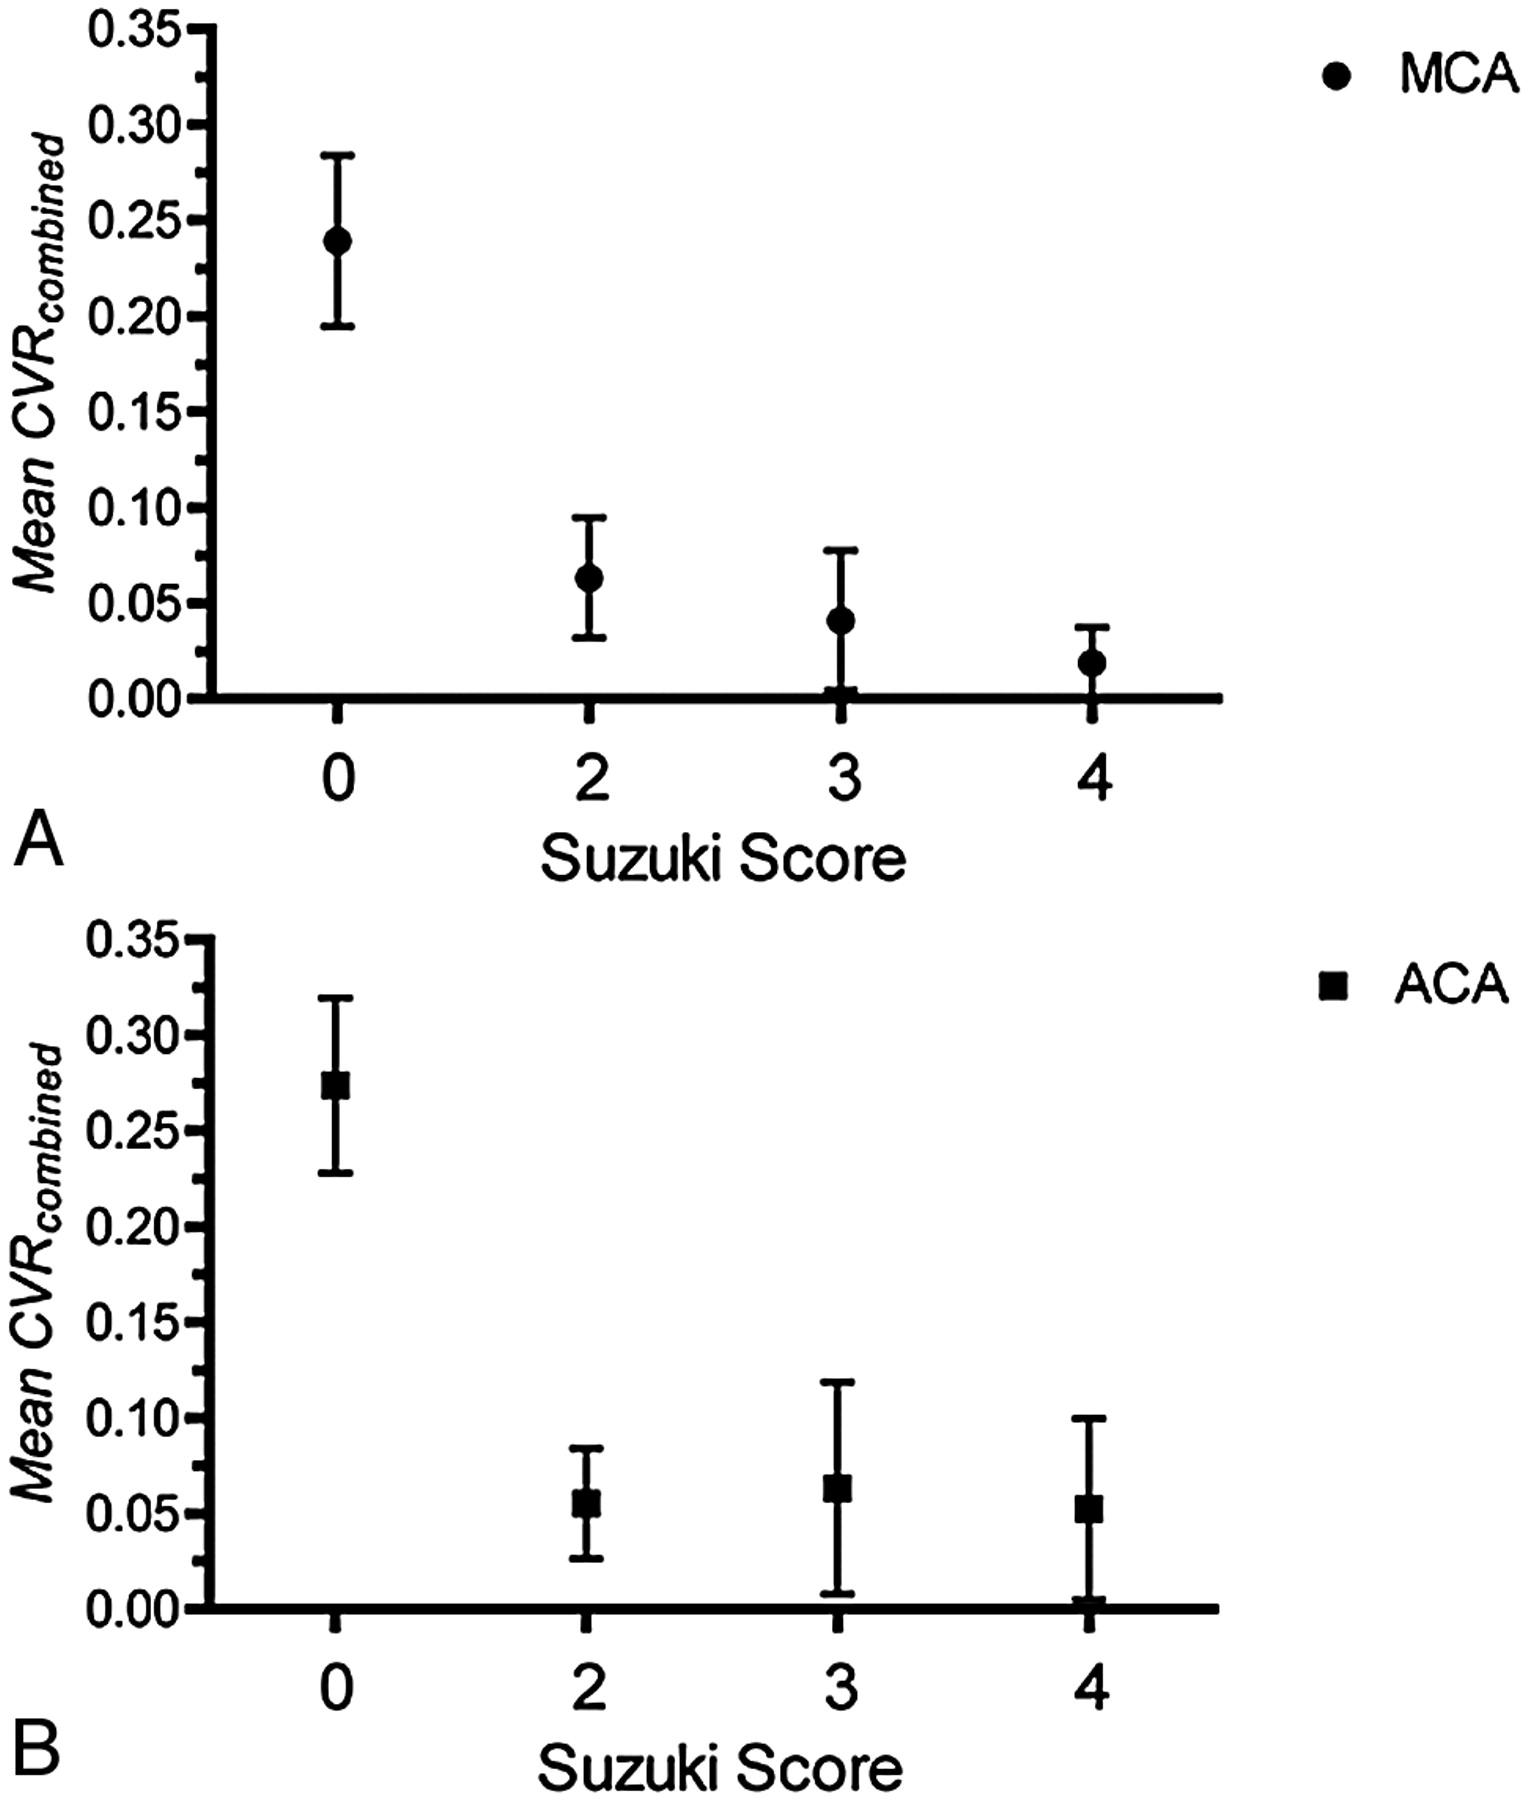
Relationship between Mean CVRcombined versus disease severity as measured by the modified Suzuki score. A, Mean CVRcombined versus the Suzuki score for the MCA territory. B, Mean CVRcombined versus the Suzuki score for the ACA territory.
The Mean CVRcombined was calculated for combined ACA and MCA territories with Moyamoya and pial collaterals (M+P+), Moyamoya collaterals alone (M+P−), and no collaterals (M−P−) (Fig 4). There was a good correlation between Mean CVRcombined and the presence of collateral vessels (Pearson correlation coefficient, −0.7466). Territories with vessel collaterals had significantly lower Mean CVRcombined (Mean CVRcombined± SE = 0.068 ± 0.031 and 0.021 ± 0.013 for M+P− and M+P+, respectively) compared with territories with no collaterals (Mean CVRcombined± SE = 0.20 ± 0.017). Territories containing Moyamoya and pial collaterals (M+P+) had a lower Mean CVRcombined compared with territories with Moyamoya vessels alone (M+P−), but this difference was not statistically significant (P = .11, unpaired t test).
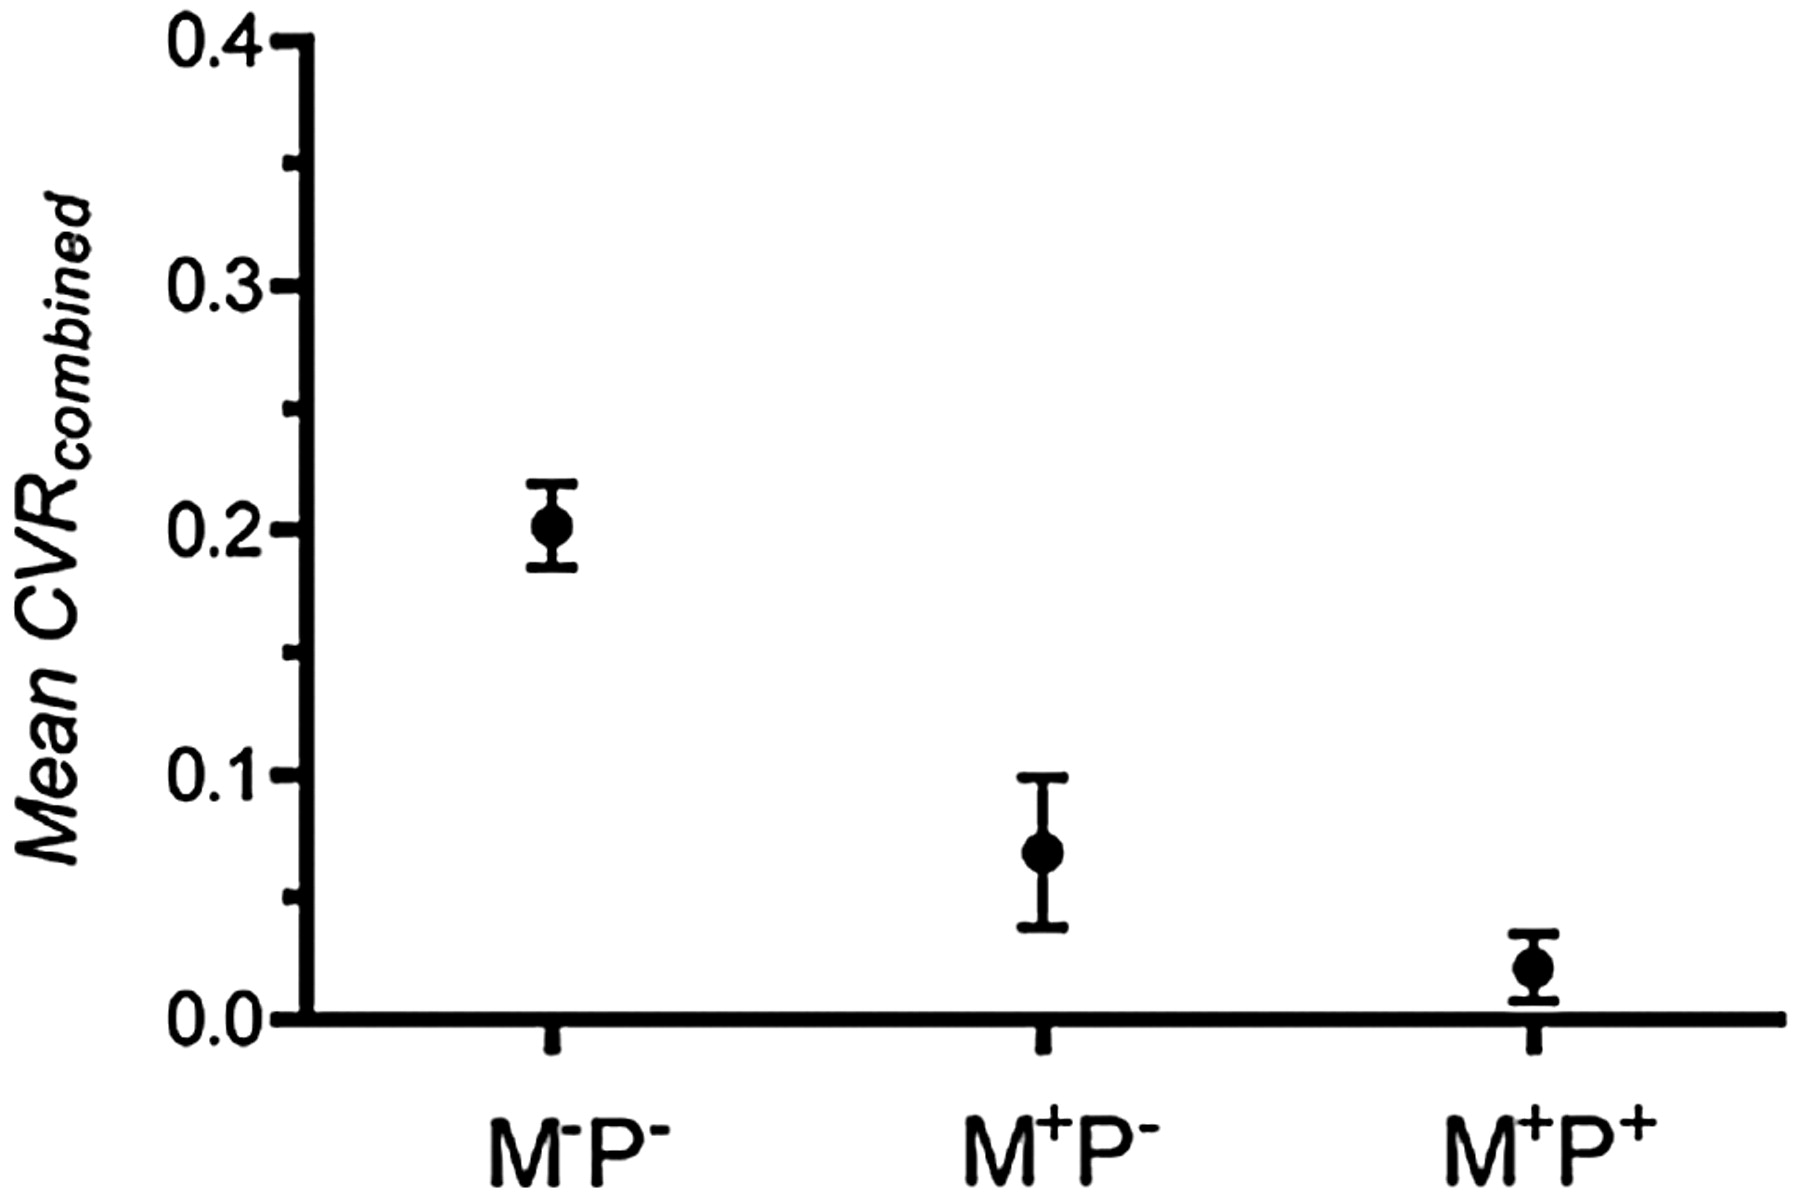
Correlation between Mean CVRcombined for MCA and ACA territories and the presence of pial or Moyamoya collaterals. M-P- indicates the absence of Moyamoya or pial collaterals, M+P− indicates the presence of Moyamoya collaterals but the absence of pial collaterals, and M+P+ indicates the presence of Moyamoya and pial collaterals.
To examine the dependence of CVR on the extent of vascular steal, we generated plots of Mean CVRpos, Mean CVRneg, and Mean CVRcombined versus the fraction of negatively reacting voxels (fneg) for all ACA, MCA, and PCA territories. Vascular territories affected by Moyamoya disease (Suzuki >0) have more vascular steal (higher fneg) compared with disease-free territories (Suzuki = 0). A nonlinear decrease in Mean CVRpos with fneg was found (Fig 5A). An exponential decay with a plateau of 0 was fitted to the data (R2 = 0.45). A similar trend for Mean CVRcombined against fneg (Fig 5B) was fitted to an exponential decay with a plateau of −0.09 (R2 = 0.72). Extrapolating from this fit, the x-intercept (Mean CVRcombined = 0) occurs with fneg = 0.52. A plot for Mean CVRneg illustrates the independence of Mean CVRneg over a wide range of fneg values (Fig 5C).
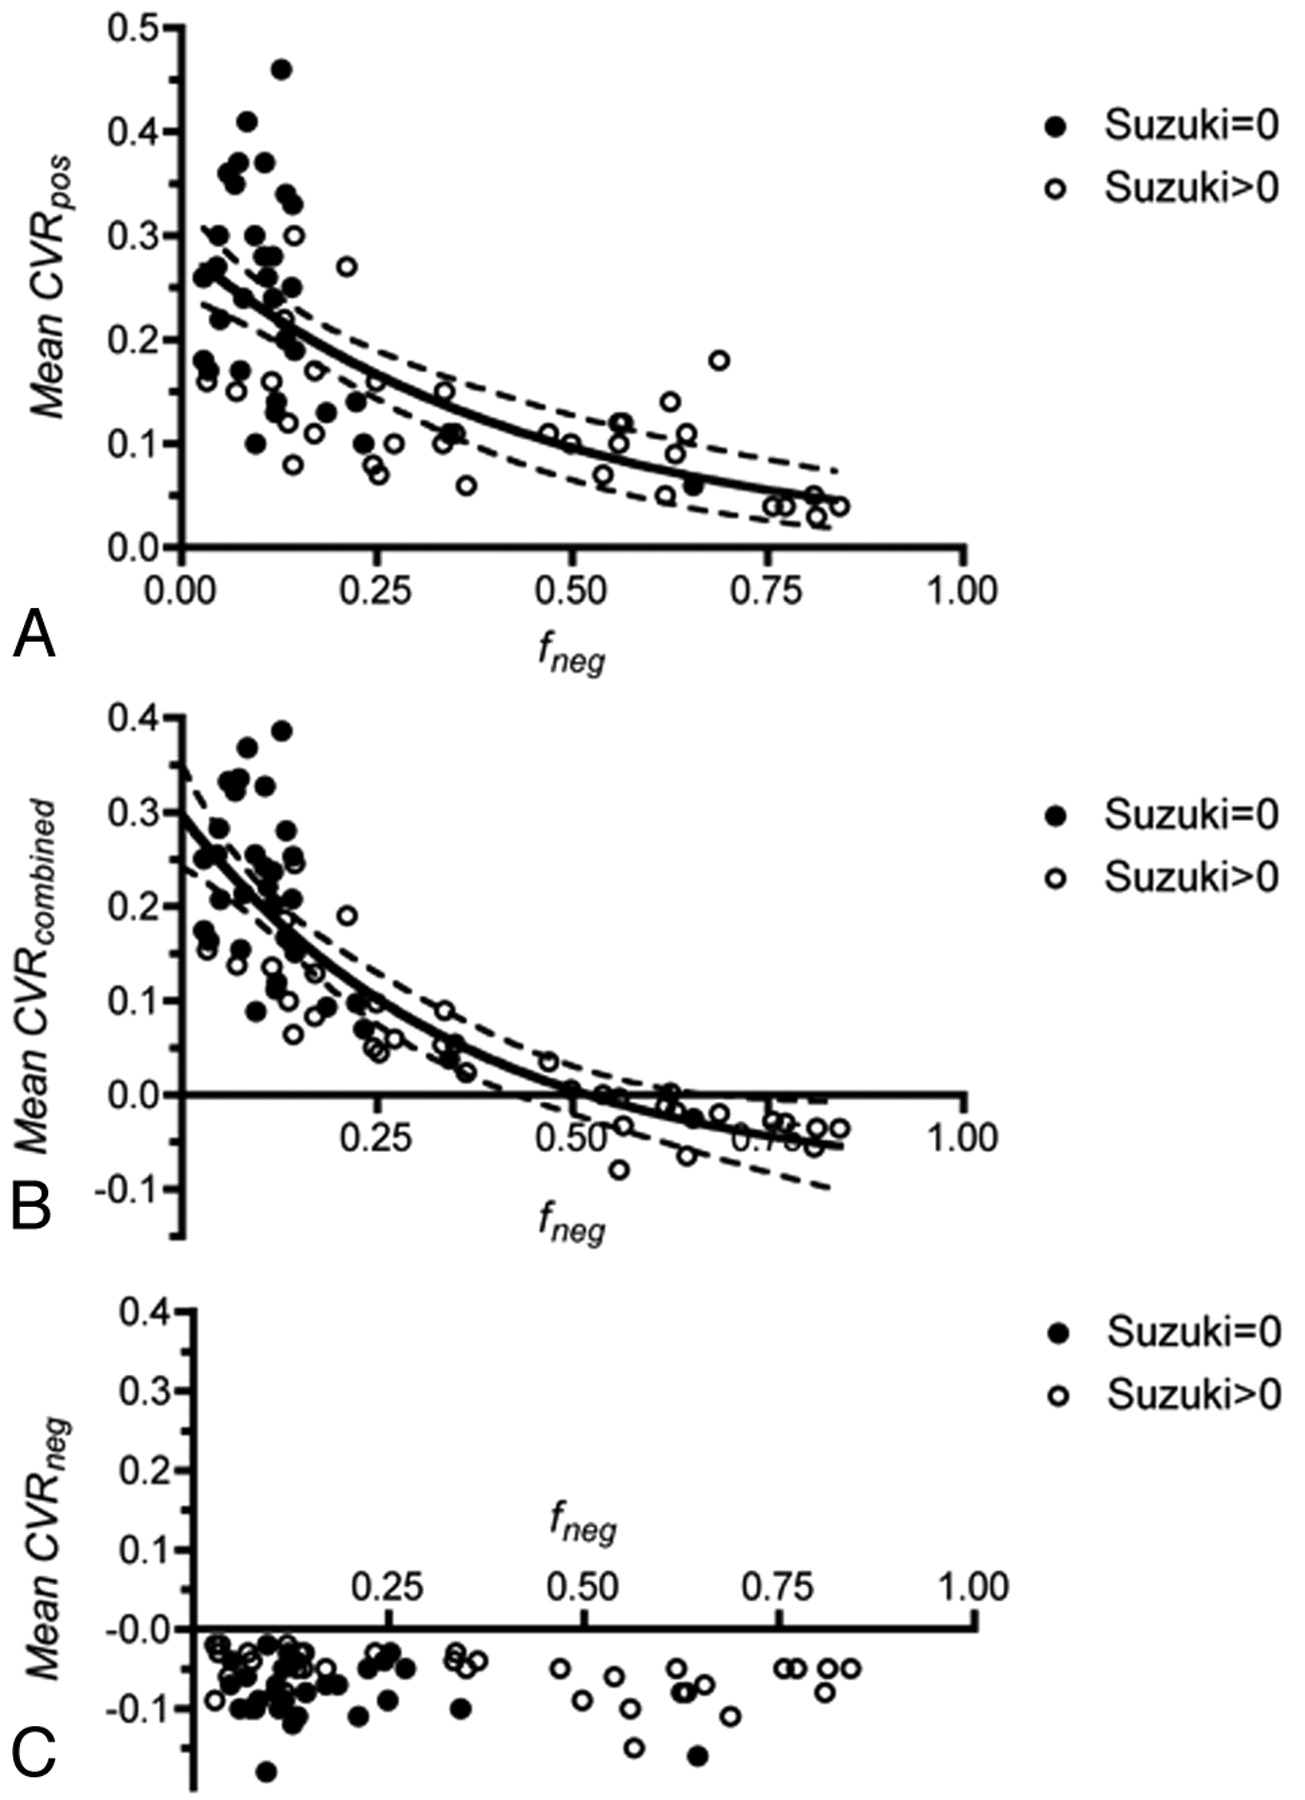
Relationship between Mean CVRpos, Mean CVRcombined, Mean CVRneg, and the degree of vascular steal (fneg) for all ACA, MCA, and PCA territories. Closed circles represent vascular territories with a Suzuki score of 0, and open circles, Suzuki >0. A, Mean CVRpos versus fneg. B, Mean CVRcombined versus fneg. An exponential decay has been fitted to the data. The dotted lines indicate the 95% confidence band. C, Mean CVRneg versus fneg.
Discussion
Measurement of CVR with BOLD MR imaging and the CO2 rebreathing circuit used in the current study has a number of advantages over existing methods. Nuclear medicine techniques such as PET and SPECT have poor spatial and temporal resolution and involve the administration of radioactive tracers. Changes in CBF measured with CT perfusion have been shown to correlate well with angiographic scoring of Moyamoya disease.4 The accurate quantification of CBF by using CT perfusion is dependent on an AIF, which is difficult to define in circulation affected by Moyamoya disease. In addition, studies that rely on breath-hold or acetazolamide stress cannot reproducibly create changes in end-tidal pCO2 and, therefore, cannot accurately quantify CVR. BOLD MR imaging is a readily accessible technique that can produce quantitative maps of CVR with high temporal and spatial resolution, requires no radioactive tracer, and is not dependent on an AIF. Furthermore, the rebreathing technique used in the current study produces reproducible changes in end-tidal pCO2, allowing truly quantitative and accurate mapping of CVR.
Using the BOLD MR imaging technique with the rebreathing circuit, we found a good correlation between Mean CVRcombined and the Suzuki score. The Mean CVRcombined decreases with increasing Suzuki score; however, the difference was not statistically significant between vascular territories for a Suzuki score of >0. This is not completely unexpected because angiographic scoring of upstream feeding vessels may not adequately reflect the perfusion in downstream tissue. Furthermore, we have shown that the effect on Mean CVRcombined is diminished as disease burden increases (Fig 5B), so while a significant difference between Mean CVRcombined for a vascular territory with a Suzuki score of 0 and a Suzuki score of >0 may be significant, we expect a smaller difference between vascular territories with non-zero Suzuki scores.
The correlation between CVR and the presence of Moyamoya and pial collaterals suggests that the presence of these vessels is associated with poor vascular reactivity that is not adequately compensated by collateralization. Vascular territories with pial and Moyamoya vessels had a nonsignificant but lower Mean CVRcombined compared with vascular territories with Moyamoya vessels alone. The presence of pial collaterals may, therefore, represent a more severe disease burden as measured by Mean CVRcombined; however, further measurements will be needed to clarify this relationship.
Measurements indicate that a nonlinear relationship exists between Mean CVRpos and fneg (Fig 5A). For small values of fneg, there is an initial large decrease in Mean CVRpos for small changes in fneg. As fneg increases, the effect on Mean CVRpos is diminished. In contrast, the mean reactivity of negatively reacting voxels (Mean CVRneg) is relatively constant over a range of fneg. The Mean CVRcombined is, therefore, predominantly affected by changes in Mean CVRpos for small values of fneg. As the amount of steal increases in a given vascular territory, the decrease in Mean CVRcombined is mainly determined by the increasing extent of steal (fneg) and not significantly by decreasing Mean CVRpos or Mean CVRneg. No attempt has been made to mathematically model the relationship between CVR and fneg, but the results presented here demonstrate a reproducible relationship between these parameters in all vascular territories studied and in multiple patients.
There was a decreasing trend between Mean CVRcombined and increasing Suzuki score and vessel collateralization, but the difference was not statistically significant. Statistically significant differences may exist; however, the study was limited because of the small number of patients analyzed. Other limitations of this study were the deficiency of patients with mild Moyamoya disease (Suzuki = I) and the retrospective nature of the study.
Conclusions
BOLD MR imaging in combination with precision control of end-tidal pCO2 and pO2 is an easily implemented technique that can produce reproducible and quantitative maps of CVR. In the present work, we have demonstrated how this technique correlates well with existing measures of Moyamoya disease burden by using conventional angiography and, therefore, validates the use of BOLD MR imaging for this purpose. However BOLD MR imaging takes this correlation one step further by providing truly quantitative maps of the spatial severity of Moyamoya disease.
Footnotes
-
J.A.F. and D.J.M. contributed to the development of the RespirAct, a device used in this study. These authors stand to benefit financially if this device is successfully commercialized by Thornhill Research, a University of Toronto/University Health Network−related company.
References
- Received June 4, 2009.
- Accepted after revision September 16, 2009.
- Copyright © American Society of Neuroradiology
In this issue


Jump to section
Related Articles
Cited By...
- Predicting Ischemic Risk Using Blood Oxygen Level-Dependent MRI in Children with Moyamoya
- Breath-Hold Blood Oxygen Level-Dependent MRI: A Tool for the Assessment of Cerebrovascular Reserve in Children with Moyamoya Disease
- Cerebrovascular Reactivity Mapping: An Evolving Standard for Clinical Functional Imaging
- Novel MRI Approaches for Assessing Cerebral Hemodynamics in Ischemic Cerebrovascular Disease
- Neurosurgical Advances in the Treatment of Moyamoya Disease
- Impact of Extracranial-Intracranial Bypass on Cerebrovascular Reactivity and Clinical Outcome in Patients With Symptomatic Moyamoya Vasculopathy