
Abstract
BACKGROUND AND PURPOSE: For more widespread clinical use advanced imaging methods such as relative cerebral blood volume must be both accurate and repeatable. The aim of this study was to determine the repeatability of relative CBV measurements in newly diagnosed glioblastoma multiforme by using several of the most commonly published estimation techniques.
MATERIALS AND METHODS: The relative CBV estimates were calculated from dynamic susceptibility contrast MR imaging in double-baseline examinations for 33 patients with treatment-naïve and pathologically proved glioblastoma multiforme (men = 20; mean age = 55 years). Normalized and standardized relative CBV were calculated by using 6 common postprocessing methods. The repeatability of both normalized and standardized relative CBV, in both tumor and contralateral brain, was examined for each method with metrics of repeatability, including the repeatability coefficient and within-subject coefficient of variation. The minimum sample size required to detect a parameter change of 10% or 20% was also determined for both normalized relative CBV and standardized relative CBV for each estimation method.
RESULTS: When ordered by the repeatability coefficient, methods using postprocessing leakage correction and ΔR2*(t) techniques offered superior repeatability. Across processing techniques, the standardized relative CBV repeatability in normal-appearing brain was comparable with that in tumor (P = .31), yet inferior in tumor for normalized relative CBV (P = .03). On the basis of the within-subject coefficient of variation, tumor standardized relative CBV estimates were less variable (13%–20%) than normalized relative CBV estimates (24%–67%). The minimum number of participants needed to detect a change of 10% or 20% is 118–643 or 30–161 for normalized relative CBV and 109–215 or 28–54 for standardized relative CBV.
CONCLUSIONS: The ΔR2* estimation methods that incorporate leakage correction offer the best repeatability for relative CBV, with standardized relative CBV being less variable and requiring fewer participants to detect a change compared with normalized relative CBV.
ABBREVIATIONS:
- nRCBV
- normalized relative CBV
- RC
- repeatability coefficient
- rCBV
- relative CBV
- sRCBV
- standardized relative CBV
- wCV
- within-subject coefficient of variation
Dynamic susceptibility contrast MR imaging has been increasingly used to evaluate the vascular properties of brain tumors and may be useful in other disorders of the central nervous system, including stroke, hypoxia, stenosis, and brain trauma. DSC MR imaging is obtained by quantifying the signal-intensity change on T2*/T2-weighted imaging following injection of contrast agent as it passes through tissue. Parameters typically derived from DSC MR imaging include cerebral blood flow, cerebral mean transit time, and relative CBV (rCBV); the latter is generally regarded as the most robust and commonly derived parameter of the 3. For patients with brain tumors, the information provided by rCBV estimates has been used to assist clinicians in the identification of brain tumor grade,1⇓⇓⇓–5 progression,6⇓–8 and aggressiveness or treatment response.7,9,10
Postprocessing methods used for rCBV estimation are varied, with no single technique implemented as the standard for use in clinical practice or research. Reports have demonstrated profound differences in derived rCBV values that depend on the choice of acquisition and postprocessing methods,11 with much of this variability being attributed to the effects of contrast agent leakage due to blood-brain barrier disruption. These effects, which are especially influential when evaluating high-grade gliomas, can be minimized or corrected for by either administration of a preload dose of contrast agent to saturate T1 changes due to leakage or by a postprocessing mathematic correction or both. Without such considerations, contrast agent leakage, apparent as T1-shortening, would falsely underestimate rCBV or, if apparent as residual T2* effects, could overestimate rCBV.3,11,12
Additionally, due to the variability of nonquantitative rCBV values within similar tissue types, scaling metrics are often applied to rCBV estimates to better assess comparisons among subjects and between examinations. Two commonly applied scaling metrics involve either normalization or standardization. Normalization involves drawing a reference ROI, typically within normal-appearing white matter, whereby all voxels are divided by the mean value of that ROI. Alternatively, standardization, which transforms rCBV maps to a standardized intensity scale, without the need to draw a reference ROI, has been shown to increase consistency in rCBV measurements across time and patients.13 Although the use of scaling metrics may reduce the variability of rCBV interpretation, the variability inherent in estimation methods is not fully known.
While the accuracy of several methods used for rCBV estimation has been investigated,3,11,12,14⇓⇓–17 the repeatability of these methods has not, including a comparison between normalized (nRCBV) and standardized (sRCBV) rCBV approaches. Although rare, studies investigating the repeatability of imaging datasets are of great importance, especially if they are to be used as reliable biomarkers of disease detection and for decision-making in clinical trials and eventually as part of patient management.18,19 The aim of this study was to compare the repeatability across 6 commonly used postprocessing methods in the estimation of standardized and normalized rCBV by using double-baseline data obtained from subjects with newly diagnosed glioblastoma multiforme.
Materials and Methods
Participants
Institutional review board approval was obtained to retrospectively evaluate MR imaging data from subjects for whom informed consent had been obtained for participation in a prospective National Cancer Institute–sponsored phase Ib/II clinical trial. Detailed information regarding this trial can be found on-line (ClinicalTrials.gov identifier NCT00662506) and in recently published work.20,21
In general, participants were selected for inclusion in this National Cancer Institute clinical trial if they were at least 18 years of age, had histologically confirmed glioblastoma multiforme, were scheduled to receive standard22,23 postsurgical (biopsy or resection) chemoradiotherapy, had residual contrast-enhancing tumor, maintained a stable dose of steroids before their baseline and vascular MR imaging examinations, would not require concurrent treatment other than that specified by the trial, had a Karnofsky Performance Status score of at least 60%, and had a Mini-Mental State Examination score of at least 15. In general, participants were excluded if they had uncontrolled intercurrent illness, a condition or disease contraindicated for treatment with cediranib, pregnancy, or prior anti–vascular endothelial growth factor therapy for treatment of their tumor.
The sample size used for this study was based on total enrollment in the National Cancer Institute clinical trial, and not from a predetermined power analysis. All of the subjects who participated in the National Cancer Institute clinical trial were considered for inclusion in this retrospective study, in which exclusion criteria were limited to early initiation of treatment and issues of data quality, including substantial artifacts or incomplete and missing data.
Data Acquisition
Double-baseline MR imaging examinations were performed at Massachusetts General Hospital Cancer Center and the Dana-Farber Cancer Institute in Boston, Massachusetts. Data obtained included DSC MR imaging and pre- and post-contrast-enhanced T1-weighted imaging. All data were acquired on 3T MR imaging systems (Tim Trio; Siemens Erlangen, Germany) equipped with AutoAlign (Siemens), which aligns section positions in a standard reproducible way, and were collected by using a similar imaging protocol.24
The DSC gradient-echo echo-planar MR imaging data were collected as follows: TR = 1.45–1.50 seconds, TE = 30–32 ms, flip angle = 80° or 90°, 12 sections with section thickness = 5 mm, intersection gap = 1.5 mm, acquisition matrix = 160 × 160 or 128 × 128, and FOV = 192–768 × 192–768 mm2, using a 0.2-mmol/kg dose of gadopentetate dimeglumine contrast agent (0.1-mmol/kg preload injection and 0.1-mmol/kg at approximately 80 seconds during DSC data collection). For each patient, both baseline images were collected with the exact same parameter settings. Parameter settings varied among patients but were within the ranges listed above.
T1-weighted MR imaging data were collected as follows: TR = 0.19–0.868 seconds, TE = 12 ms, 23 sections with section thickness = 5 mm, intersection gap = 1 mm, acquisition matrix = 432–512 × 512, and FOV = 185–220.
rCBV Estimation
The nRCBV and sRCBV estimates for 6 commonly used postprocessing methods were calculated from unmodified DSC data by using plug-ins developed at the Medical College of Wisconsin for use within Analysis of Functional NeuroImages software (http://afni.nimh.nih.gov/afni).24 The rCBV software plug-ins incorporate data truncation, calculation of preinjection baseline signal intensity, and calculation of concentration-time curves in the estimation of rCBV for each method. Specifically, the first 5 time points were removed because transient changes in the DSC signal occur before reaching a steady-state signal. This procedure was to establish a more accurate estimation of the preinjection baseline signal intensity. A voxelwise calculation of preinjection baseline signal intensity (SB) was then performed according to the following equation:
 where Nb is the number of baseline time points following DSC signal truncation and before contrast injection and Sj is the jth image in the time-series. The concentration-time curve could then be calculated according to the following equation:
 where S(t) is the signal time course. Next a voxelwise estimation of rCBV was performed for each of the methods listed in Table 1 as detailed in Paulson and Schmainda.14 Data for each estimation method were then standardized or normalized13 for each visit separately, with manually drawn normal-appearing white matter reference regions or standardization files, respectively.
Description of rCBV estimation methods
Data Analysis
For each visit, the DSC and precontrast T1-weighted images were coregistered with postcontrast T1-weighted images by using a normalized mutual information cost function with 6 df. Enhancing tumor volume ROIs were determined for each corresponding visit by using a semiautomated, threshold-detection algorithm applied to ΔT1 maps.25 Specifically, the ΔT1 maps were created from the subtraction of standardized precontrast from standardized postcontrast T1-weighted images and thresholded to exclude values below a threshold of 3000. This previously determined threshold ensures that regions containing perfused tissue are included in the final tumor ROI. This approach also ensures that regions of bright signal on precontrast T1-weighted images resulting from blood products, for example, are not included as part of the enhancing-tumor ROI.25 An example of using this approach to create ΔT1 maps is shown in Fig 1. For comparison the repeatability metrics were also determined in normal-appearing contralateral brain ROIs.

ΔT1 mask creation. Following standardization of each image, the standardized precontrast T1-weighted image (A) is subtracted from the standardized postcontrast T1-weighted image (B). The resulting ΔT1 map is thresholded, with results shown in red (C), and the abnormal region is extracted from the area identified in yellow, giving the final enhancing tumor mask (D).
Statistical Analysis
Consistent with a previous report,18 repeatability will refer to the consistency of quantitative results obtained when the same imaging test is performed at short intervals on the same subjects by using the same equipment in the same center. In this context, the repeatability coefficient (RC) with upper and lower confidence intervals (RCU, RCL), SDs, and within-subject coefficient of variation (wCV) was calculated for mean rCBV estimates within the tumor and normal brain ROIs separately.18 These metrics were used as a means of comparing repeatability within and across rCBV estimation methods and not in comparison with a reference standard, which would address the question of accuracy. The RC is a measure of the limits of agreement between baseline studies for a given method, wherein 95% of the test-retest measurement differences lie. Therefore, rCBV estimation methods were ordered as having greater repeatability based on a lower RC for nRCBV and sRCBV separately. Additionally, the wCV was used to compare not only the variation among rCBV estimation methods but also between standardized and normalized approaches, such that those methods showing lower variation were regarded as more consistent.
Repeatability metrics were also compared for each estimation method between normal brain and tumor ROIs by using a Wilcoxon matched pairs test with statistical significance set at α = .05. All repeatability metrics were calculated as presented in Barnhart and Barboriak18 and can be viewed in the On-line Appendix. All statistical tests were performed by using GraphPad Prism software (GraphPad Software, San Diego, California). Last, the minimum sample size required to detect a parameter change of 10% or 20% was calculated for each nRCBV or sRCBV estimation method with 2-tailed statistical significance set at α =.05 and power = 0.90. The percentage changes were based on the population mean for each estimation method and the respective scaling metric in this study.26
Results
Participants
Forty participants were enrolled in the National Cancer Institute clinical trial between February 2009 and February 2011. Double-baseline MR imaging data were acquired within 8 days for 38 subjects; 2 of the initial 40 subjects did not receive a second baseline examination and were therefore excluded from this analysis. Five additional subjects were excluded from analysis due to data-quality issues involving one of the baseline examinations, including the following: self-removal from the MR imaging scanner during the examination (n = 1), poor contrast injection (n = 2), and initiation of treatment (n = 2). The remaining 33 subjects were treatment-naïve, aside from maintaining a stable dose of steroids for a minimum of 5 days before initiation of the first baseline MR imaging examination and continuing through the second baseline MR imaging examination. Twenty male and 13 female subjects were included in the analyses with a mean age of 55 ± 10.8 years and a mean timing between baseline examinations of 3.6 ± 1.4 days.
Statistical Measures
Repeatability metrics obtained for all rCBV analysis methods are shown in Table 2 for tumor ROIs and are sorted in order of best repeatability as determined by the RC for nRCBV and sRCBV separately. Also in Table 2 are the 95% CI ranges for RC, wCV, and SDs including total, between-subject, and within-subject SDs. While RC provides a way to assess how repeatable a given measure is (ie, nRCBV or sRCBV), the wCV is used to make comparisons across all measurement types (eg, nRCBV and sRCBV) independent of scale. Figure 2 provides a visual comparison of methods 1–6 for nRCBV and sRCBV estimates in approximately the same section from the same subject for each visit, in which all images showed the same scale for either nRCBV or sRCBV across methods and visits.
Metrics of rCBV estimation methodsa
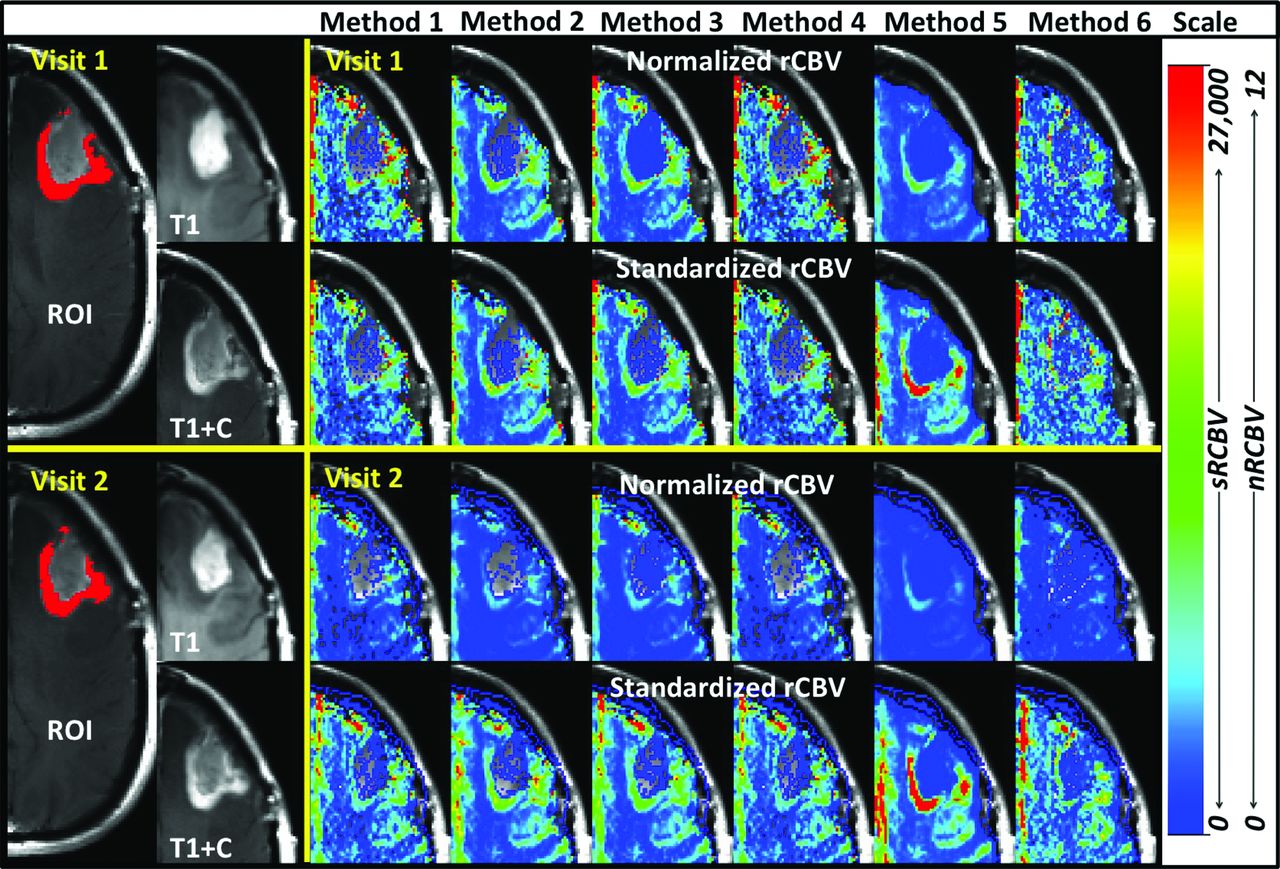
Visual comparison of nRCBV and sRCBV. Methods 1–6 (across) for visit 1 (top 2 rows) and visit 2 (bottom 2 rows) in the same subject in approximately the same section for visits 1 and 2. All data are presented with the same respective scale for nRCBV or sRCBV and are in arbitrary units.
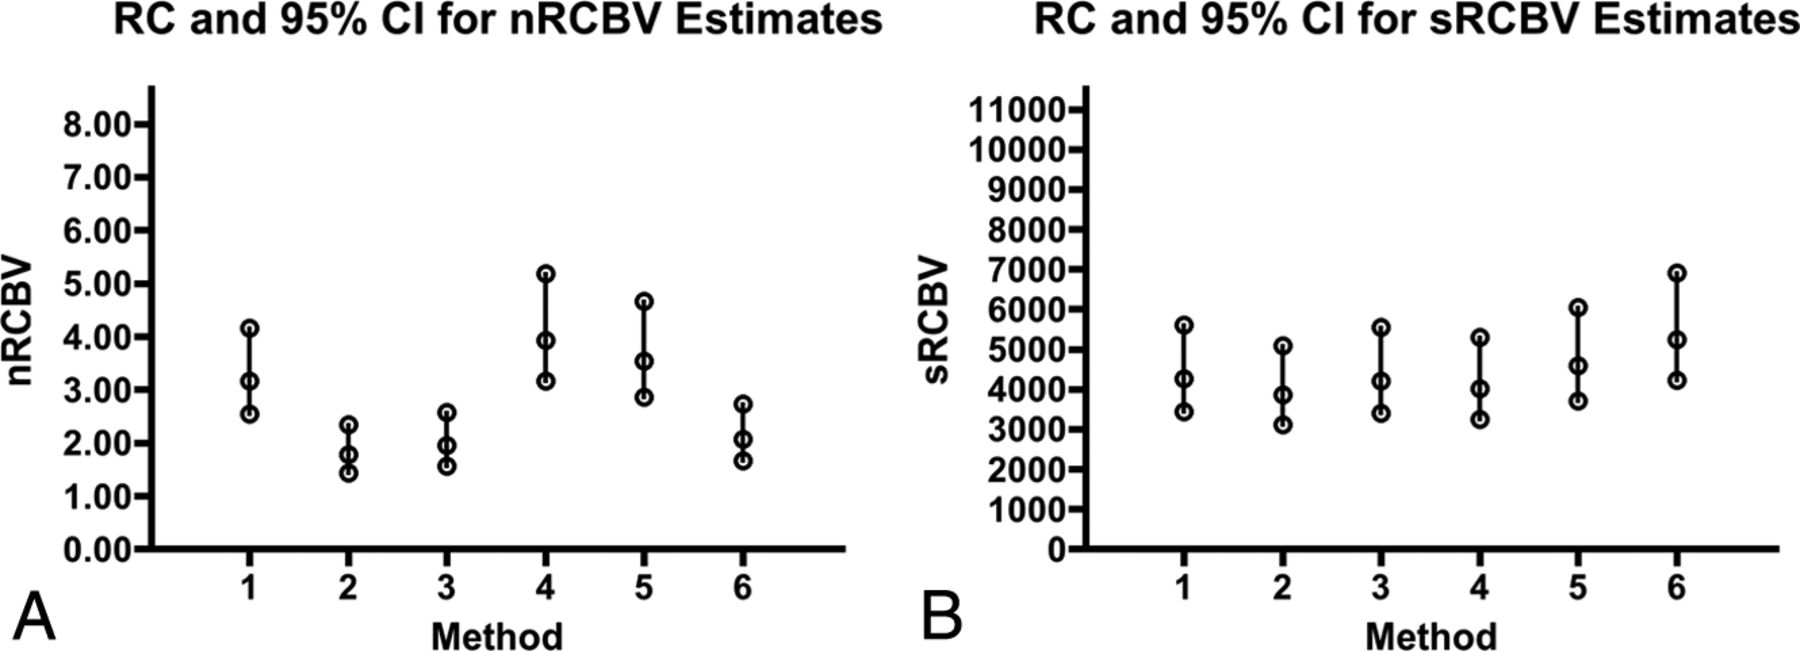
The RC shows the greatest consistency (ie, lower RC values) for leakage-corrected methods 2 and 3 for both nRCBV and sRCBV. In general, the signal-based rCBV analysis methods were among the least repeatable, particularly for method 5. Based on the 95% CIs of RC, sRCBV shows greater consistency than nRCBV between visits and across methods as shown in Fig 3. The nRCBV and sRCBV are scaled with separate arbitrary units; therefore, the overall 95% CI of RCs cannot be directly compared for the extent of range but rather are compared for consistency within ranges for each scaling metric separately. The RC in sRCBV estimates was comparable (P = .31) between tumor and normal brain. However, for nRCBV estimates, the repeatability in normal brain (P = .03) was superior to that of tumor.

Consistency and variation in rCBV estimation. A and B, RC and 95% CI for nRCBV and sRCBV estimates, respectively. Because arbitrary units are used, values are displayed with the maximum RC as 60% of the upper limit of the y-axis. Ranges for RC are largely consistent across methods for sRCBV, but not for nRCBV.
In general, as shown in Fig 4, wCV was higher for nRCBV in normal brain and tumor compared with sRCBV. The wCV in tumor was higher for all nRCBV methods than for any sRCBV method. As expected, due to lower mean values in normal brain, the wCV was significantly higher in normal brain compared with tumor (P = .03) for sRCBV estimation methods. The wCV was comparable in both normal brain and tumor for nRCBV (P = .84).

The wCV of normalized and standardized rCBV in tumor and brain tissue. The wCV is shown for nRCBV estimates in brain (nBrain) and tumor (nTumor) and for sRCBV estimates in brain (sBrain) and tumor (sTumor).
A sensitivity analysis was also performed on 14 of the subjects in whom repeat imaging was performed within a shorter, 3-day timeframe. RC had similar trends for both nRCBV and sRCBV with respect to the order of repeatability, in which method 2 had the greatest repeatability. As expected, this analysis showed improved (18.2% mean difference) RC values (P = .002) and improved (18.5% mean difference) wCV (P = .003) for sRCBV methods, which were statistically significant. However, there was no statistical difference detected for RC (P = .15) or wCV (P = .19) by excluding subjects with >3 days between examinations for the nRCBV methods.
Finally, with the measurement variations in rCBV determined, a power analysis was performed to estimate the minimum number of participants needed to detect a change in rCBV of either 10% or 20%. A percentage change of 10% or 20% will be equivalent between normalized or standardized scaling metrics because both use a form of linear transformation of the data and do not alter the underlying information content.13 For nRCBV, a minimum of 118–643 or 30–161 subjects is necessary to statistically power a study in which a 10% or 20% change is expected. For sRCBV, the number of participants required is fewer, with 109–215 or 28–54 subjects to detect a 10% or 20% change, respectively. These results are listed in Table 3.
Sample size for rCBV estimation methodsa
Discussion
The use of rCBV to interpret treatment response has become essential for many diseases, especially for high-grade gliomas. In particular, with relatively new or even established therapies, it can be difficult to monitor with standard imaging and response criteria.27⇓⇓–30 These challenges are especially apparent in imaging of patients following chemoradiotherapy or anti–vascular endothelial growth factor therapy, in which it is difficult to distinguish pseudoprogression from true progression or pseudoresponse from true response, respectively.31
Specifically, the standard of care for patients with high-grade glioma requires the delivery of chemoradiotherapy with concomitant and adjuvant temozolomide.22,23 Responses are particularly difficult to interpret within the first 3 months of treatment because standard imaging has not shown a reliable distinction between true tumor progression and pseudoprogression. Pseudoprogression presents as an early increase in enhancement on T1-weighted imaging, thought to represent an inflammatory response involving changes in the blood-brain barrier and vascular endothelium. Patients with pseudoprogression have shown longer survival rates than patients with true tumor progression.31
Additionally, anti–vascular endothelial growth factor drugs, which are now becoming the standard for treatment of patients with recurrent high-grade gliomas, decrease the permeability of the blood-brain barrier, oftentimes resulting in otherwise enhancing tumor being undetectable and difficult to interpret on contrast-enhanced T1-weighted imaging, regardless of treatment response. This normalization of the blood-brain barrier often results in improvement of symptoms and a decrease in edema, further confounding the interpretation of response clinically.31 In a recent phase II clinical trial, FLAIR and postcontrast T1-weighted imaging were evaluated for their ability to predict overall survival in patients with recurrent glioblastoma multiforme treated with the anti–vascular endothelial growth factor drug bevacizumab.32 It was found that an increase in enhancement was associated with poorer survival, while FLAIR progression did not reveal a significant survival disadvantage.32 The results of this study are promising in predicting treatment failure for those who show progression on T1-weighted imaging, yet standard imaging has still remained ineffective in determining true responders from pseudoresponders in those who have diminished enhancement.
Among others, the treatment approaches described here have benefited from the inclusion of rCBV, in which relative values or functional changes in the direction of rCBV have been shown to be promising in predicting response to treatment, to the point at which it is now a routine clinical examination at many hospitals.3,8⇓–10,27,33⇓–35 With the increasingly prevalent use of rCBV in the evaluation of patients with brain disease, it has become extremely important that the quality of the data being assessed be consistently produced, especially when assessing disease with time.
This study demonstrates that methods incorporating leakage correction largely have superior repeatability. Additionally, methods that use ΔR2* estimation perform better than those that are signal-based. Method 2, an accuracy-proved14 leakage-corrected technique11 that uses ΔR2* estimation offered the best repeatability for both normalized and standardized scaling metrics. Additionally, when methods are compared across scaling metrics, standardization decreased within-subject variations with greater consistency across techniques than did normalization. Figure 2 provides a visual contrast among methods with lower wCV and lower RC (greater repeatability) compared with those with higher wCV and higher RC (lower repeatability) between visits. These differences in repeatability are especially evident when comparing sRCBV method 2 (best repeatability) with sRCBV method 5 (worse repeatability) between visits. Method 2 is visually consistent over visits, yet method 5 reveals an extending area of increased rCBV from visit 1 to visit 2. Less repeatable estimation methods could lead to errors in interpretation clinically because the rCBV maps in Fig 2 should appear visually the same in both visits. Clinically, using rCBV methods with greater repeatability should provide clinicians with improved confidence in interpretation by providing a reliable assessment of progression or response to treatment.
Using the rCBV estimation techniques that offer superior repeatability may help to validate its use as an imaging biomarker, both on a daily basis and in the context of planning and interpreting clinical trials in which rCBV is evaluated.18,19 Furthermore, by choosing the methods with the greatest repeatability, clinical trials can be performed in a much more cost-effective and efficient manner. For example, by using the variabilities determined in this study, a power analysis was performed to estimate the number of participants required to detect a certain percent change in rCBV. The numbers required varied substantially, with the standardized leakage-corrected rCBV methods proving to be the most consistent. Consequently using sRCBV in clinical trials has the potential to improve efficiency by requiring many fewer participants to address a given hypothesis.
Although it was not addressed in this study, there is growing interest in using dynamic contrast-enhanced MR imaging for the evaluation of brain tumors. This method, which provides additional information on vascular permeability and blood volume, also has been shown to vary across analysis platforms.36 As such, assessing the repeatability of DCE MR imaging among various models may also be beneficial in the future for improved consistency and widespread application.
One limitation of this study involves the subjective nature of normal-appearing white matter ROI selection used to produce nRCBV estimates. However, this inherent subjectivity is implicit to this approach and exactly what can confound nRCBV interpretation, making it less repeatable. Still, when selecting the normal-appearing white matter ROIs, care was taken to avoid including gray matter or tissue within or near abnormal regions with the goal of reducing any added variability resulting from the choice of the reference ROI.
Another limitation to this study is that data were only analyzed in high-grade gliomas. Correction techniques applied to datasets with low-grade tumors or stroke, in which blood-brain barrier distortion may not be as profound or present, may render processing methods compared here more or less repeatable in these population types. However, because tumors are assessed over time, low-grade tumors that transform to high-grade tumors would be prone to increased variability in methods that do not use some means of leakage correction.
Further limitations of this study involve the number of subjects included and the timing of repeat baseline examinations. The number of participants included was based on clinical trial enrollment requirements rather than a power analysis based on imaging parameters. In addition, in this study, repeatability was assessed in participants with examinations that occurred up to 8 days apart. Improved accuracy in the measurement of repeatability could potentially be achieved within shorter intervals or within the same day. To further address potential limitations due to extended timing between baseline exams, the repeatability analysis was performed that included only the 14 subjects for whom repeat examinations occurred within 3 days of each other. Results of improved RC and wCV were observed in sRCBV methods as expected due to potential biologic changes during a longer timeframe. However, no improvement was made within a shorter timeframe for nRCBV methods, and this is likely due to the greater inherent variations with normalization. Even with a shorter timeframe between examinations, trends in the order of repeatability remained consistent across both nRCBV and SRCBV methods, in which method 2 displayed the greatest repeatability.
Last, only data normalized by using normal-appearing white matter reference ROIs or standardized with the method identified by Bedekar et al13 were investigated. Other scaling techniques may produce differing results regarding repeatability when applied to these rCBV estimation methods. This study focused primarily on the repeatability of rCBV estimation techniques and secondarily on the use of intensity-scaling metrics applied to these techniques. Likewise, rCBV estimation techniques were not compared within nonscaled data. If different or less common scaling metrics are applied, further investigation of repeatability may be necessary, especially by using estimation methods demonstrated to be more accurate14 and repeatable for both nRCBV and sRCBV (ie, leakage-corrected). However, rCBV estimation techniques tended to display a similar order of repeatability regardless of scaling metric.
Conclusions
Characterization of the repeatability of rCBV measures is important for determining when a change in these values is an accurate representation of tumor growth or response to treatment. These results show that there is a clear difference among the repeatability of various methods for estimating rCBV. Consistent with previous reports regarding the accuracy of rCBV estimation,14 the leakage-corrected estimate of rCBV demonstrates the best repeatability for both standardized and normalized values. In addition, standardization of rCBV results in decreased variability and requires fewer study participants to detect a desired change compared with normalized rCBV. Thus, we recommended leakage-corrected standardized rCBV as a best approach included in the effort to homogenize perfusion measurements across sites.
Footnotes
Disclosures: Steven M. Stufflebeam—RELATED: Grant: National Institutes of Health.* Elizabeth R. Gerstner—RELATED: Grant: National Institutes of Health.* Tracy T. Batchelor—RELATED: Grant: National Institutes of Health (National Cancer Institute),* Comments: 2 R01 CA129371–06, 2 K24 CA125440–06; UNRELATED: Consultancy: Merck, Roche, Kirin, Novartis, Proximagen, Agenus, Spectrum, Amgen; Payment for Lectures (including service on Speakers Bureaus): Imedex, UpToDate, Educational Concepts Group, Research To Practice, Oakstone Publishing, Robert Michael Educational Institute; Travel/Accommodations/Meeting Expenses Unrelated to Activities Listed: Roche, Kirin, Novartis, Agenus; Other: Champions Biotechnology, Advance Medical. Daniel P. Barboriak—UNRELATED: Board Membership: GE Healthcare NeuroMRI Advisory Board, Comments: This board has not met for several years, and I have received no compensation for more than 36 months, but I am told that I am still a member; Grants/Grants Pending: Radiological Society of North America; Quantitative Imaging Biomarkers Alliance contract, Comments: I have received and was recently awarded a second Quantitative Imaging Biomarkers Alliance contract for research relating to dynamic contrast-enhanced MRI software; Payment for Lectures (including service on Speakers Bureaus): World Class Continuing Medical Education, Comments: I receive payment from World Class Continuing Medical Education for giving lectures at the National Diagnostic Imaging Symposium; Travel/Accommodations/Meeting Expenses Unrelated to Activities Listed: I am the imaging cochair of the ECOG-ACRIN (Eastern Cooperative Oncology Group–American College of Radiology Imaging Network) Brain Tumor Working Group and also the chair of the ACRIN Head and Neck/Brain Steering Committee, Comments: I am reimbursed for travel and expenses to the ECOG-ACRIN meetings (2 per year); Other: National Cancer Institute Brain Malignancies Steering Committee, Comments: The National Cancer Institute pays for teleconference/preparation and meeting expenses as part of my activities. Bruce Rosen—RELATED: Grant: National Institutes of Health/National Cancer Institute (5U01CA154601).* Kathleen M. Schmainda—RELATED: Grant: National Institutes of Health*; UNRELATED: Royalties: Medical College of Wisconsin, Comments: royalties received on Medical College of Wisconsin–owned patents of which K.M.S. is an inventor; Other: K.M.S. founded the company Imaging Biometrics LLC. *Money paid to the institution.
This work was supported by National Institutes of Health/National Institute of Neurological Disorders and Stroke RO1 NS060918, National Institutes of Health/National Cancer Institute RO1 CA082500, National Institutes of Health/National Cancer Institute U01 CA176110 (Medical College of Wisconsin), and National Institutes of Health/National Cancer Institute U01 CA154601 (Massachusetts General Hospital).
Indicates open access to non-subscribers at www.ajnr.org
References
- Received November 4, 2014.
- Accepted after revision January 23, 2015.
- © 2015 by American Journal of Neuroradiology


Jump to section
Related Articles
Cited By...
- Identification of a Single-Dose, Low-Flip-Angle-Based CBV Threshold for Fractional Tumor Burden Mapping in Recurrent Glioblastoma
- Classification of Hyper-scale Multimodal Imaging Datasets
- DSC Perfusion MRI-Derived Fractional Tumor Burden and Relative CBV Differentiate Tumor Progression and Radiation Necrosis in Brain Metastases Treated with Stereotactic Radiosurgery
- Performance of Standardized Relative CBV for Quantifying Regional Histologic Tumor Burden in Recurrent High-Grade Glioma: Comparison against Normalized Relative CBV Using Image-Localized Stereotactic Biopsies
- Perfusion MRI-Based Fractional Tumor Burden Differentiates between Tumor and Treatment Effect in Recurrent Glioblastomas and Informs Clinical Decision-Making
- Quantitative Delta T1 (dT1) as a Replacement for Adjudicated Central Reader Analysis of Contrast-Enhancing Tumor Burden: A Subanalysis of the American College of Radiology Imaging Network 6677/Radiation Therapy Oncology Group 0625 Multicenter Brain Tumor Trial
- Moving Toward a Consensus DSC-MRI Protocol: Validation of a Low-Flip Angle Single-Dose Option as a Reference Standard for Brain Tumors
- The Initial Area Under the Curve Derived from Dynamic Contrast-Enhanced MRI Improves Prognosis Prediction in Glioblastoma with Unmethylated MGMT Promoter