
Abstract
BACKGROUND AND PURPOSE: Magnetic susceptibility measured with quantitative susceptibility mapping has been proposed as a biomarker for demyelination and inflammation in patients with MS, but investigations have mostly been on white matter lesions. A detailed characterization of cortical lesions has not been performed. The purpose of this study was to evaluate magnetic susceptibility in both cortical and WM lesions in MS by using quantitative susceptibility mapping.
MATERIALS AND METHODS: Fourteen patients with MS were scanned on a 7T MR imaging scanner with T1-, T2-, and T2*-weighted sequences. The T2*-weighted sequence was used to perform quantitative susceptibility mapping and generate tissue susceptibility maps. The susceptibility contrast of a lesion was quantified as the relative susceptibility between the lesion and its adjacent normal-appearing parenchyma. The susceptibility difference between cortical and WM lesions was assessed by using a t test.
RESULTS: The mean relative susceptibility was significantly negative for cortical lesions (P < 10−7) but positive for WM lesions (P < 10−22). A similar pattern was also observed in the cortical (P = .054) and WM portions (P = .043) of mixed lesions.
CONCLUSIONS: The negative susceptibility in cortical lesions suggests that iron loss dominates the susceptibility contrast in cortical lesions. The opposite susceptibility contrast between cortical and WM lesions may reflect both their structural (degree of myelination) and pathologic (degree of inflammation) differences, in which the latter may lead to a faster release of iron in cortical lesions.
ABBREVIATIONS:
- MPFLAIR
- magnetization-prepared fluid-attenuated inversion recovery
- QSM
- quantitative susceptibility mapping
Multiple sclerosis is a debilitating chronic inflammatory disorder of the central nervous system. MS pathogenesis is not fully understood and is thought to involve the whole brain. While previous MS imaging studies have been largely focused on white matter, recent investigations have focused on the importance of cortical gray matter damage,1 because cortical lesions may be more relevant to physical and cognitive disability in patients than WM lesions.2 This difference raises questions about the various underlying pathologic aspects of cortical and WM lesions. Histochemical staining has shown that cortical lesions have a lower degree of inflammation3 and blood-brain barrier damage than WM lesions,4 implying that the cortical lesion may be partly independent of inflammation.5 Because it is useful to evaluate cortical and WM lesions in vivo across the whole brain, MR imaging is an important tool that complements histochemical staining.
While traditional water content– and proton mobility–based MR imaging modalities show similar abnormalities for both cortical and WM lesions, advanced high-field-strength MR imaging with susceptibility-weighted contrasts such as R2*/T2* mapping and quantitative susceptibility mapping (QSM) may have the potential to discriminate features of cortical and WM lesions. In active and chronic WM lesions, 7T MR imaging studies have shown that regions with decreased R2* and increased magnetic susceptibility correspond to histologically verified regions with demyelination- and/or inflammation-associated iron accumulation.6⇓⇓–9 More recently, R2*/T2* mapping at 7T has shown decreased R2*/increased T2* in cortical lesions, indicating loss of both iron and myelin.10⇓⇓–13
However, simultaneous assessment of the susceptibility contrast in both cortical and WM lesions has not been performed, in particular by using in vivo QSM, which can measure tissue magnetic susceptibility with high reproducibility, even in the cortex.14 Compared with other susceptibility-based imaging techniques such as phase imaging, susceptibility-weighted imaging, and R2*/T2* mapping, the deconvolution inherent in QSM removes the interfering effects of the susceptibility sources external to a voxel and makes the susceptibility sources within the voxel quantifiable.15,16 In addition, the high SNR and resolution at a high field strength of 7T increase the in vivo quantification quality of QSM to benefit the characterization of small cortical lesions.
The purpose of this study was to use QSM at 7T to measure and compare in vivo susceptibility contrast in both cortical and WM lesions and identify differences that may reflect the known pathologic difference between the 2 subtypes of lesions.
Materials and Methods
Patients
We recruited 15 patients with MS from February 2013 to August 2013 at the Stanford University MS clinic. Informed consent was obtained from each patient, and the study was approved by our institutional review board. An MS neurologist (M.H., with 10 years' experience) evaluated patients on the basis of their clinical presentations, investigative work-ups, and the McDonald criteria.17 While quantitative clinical metrics of disability were not available for our subjects, patient medications taken at the time of the study are shown in Table 1. One patient was excluded from analysis because of a data-acquisition error prohibiting QSM reconstruction.
Patient demographic/clinical data and lesion countsa
MR Imaging
All MR images were performed on a 7T scanner (Discovery MR950; GE Healthcare, Milwaukee, Wisconsin) with a 32-channel phased array receive coil (Nova Medical, Wilmington, Massachusetts). The imaging protocol (Table 2) covering the supratentorial brain included the following: 1) a T2*-weighted multisection 2D fast spoiled gradient-recalled sequence, 2) a coronal T1-weighted 3D WM-nulled MPRAGE sequence,18 3) a coronal T1-weighted 3D CSF-nulled MPRAGE sequence, and 4) a coronal 3D T2-weighted magnetization-prepared fluid-attenuated inversion recovery (MPFLAIR) sequence.19 The T1- and T2-weighted images were acquired to aid in lesion identification and segmentation. The T2*-spoiled gradient-recalled images were first reconstructed into both magnitude and phase images, and then QSM images were computed by using the morphology-enabled dipole inversion method,20 which performs Laplacian phase unwrapping first, followed by phase deconvolution by using L1-norm minimization. To reduce the artifacts at the edge of brain while preserving as much as possible of the cortex, we eroded the unwrapped phase by 2.5 mm (∼5 pixels) before the deconvolution. For each patient, the T1-WM-nulled MPRAGE, T1-CSF-nulled MPRAGE, and T2-MPFLAIR images were rigidly coregistered to the T2*-magnitude images by using the FMRIB Linear Image Registration Tool (FLIRT; http://www.fmrib.ox.ac.uk/) in FSL 21 with a mutual information cost function.
Parameters for MR imaging sequencesa
Lesion Identification and Segmentation
All images were examined by raters and determined to be of adequate quality for MS lesion detection and characterization. MS lesions were defined as having abnormal signal on all traditional imaging sequences (hypointense on T1-CSF-nulled MPRAGE and hyperintense on T2*-spoiled gradient-recalled, T1-WM-nulled MPRAGE, and T2-MPFLAIR) by the most votes from 3 experienced MS imaging investigators who reviewed images independently and were blinded to QSM images (E.T., neuroradiologist with 6 years' experience; W.B., neuroimaging scientist with 6 years' experience; M.M.Z., neuroradiologist, with 11 years' experience). Only lesions of ≥2 mm were identified. All available 3T clinical scans before the current 7T scan were evaluated to identify whether any WM lesions were new or enhancing. The gray-white matter boundary on the T1-CSF-nulled MPRAGE images was used to distinguish WM, cortical, or mixed cortical-WM lesions: All WM lesions were completely within the WM, all cortical lesions were primarily (>75%) within the cortex, and all mixed lesions were 25%–75% within both the WM and cortex.
On T2*-spoiled gradient-recalled images, ROIs covering all hyperintense voxels were manually drawn jointly by W.B. and E.T. on multiple continuous image sections. WM and cortical lesion ROIs were drawn only within the WM and cortex, respectively, and each mixed lesion had 2 adjacent ROIs defined separately in its cortical and WM portions. Reference ROIs were drawn on adjacent normal-appearing WM for WM lesions or adjacent normal-appearing GM for cortical lesions. These normal-appearing ROIs were delineated from a single central section that contained the lesion (Fig 1). A donut-shaped region of adjacent homogeneous WM was used for normal-appearing WM; a homogeneous region of adjacent cortex continuous with both sides of the lesion was used for the normal-appearing GM. For a mixed lesion, 2 adjacent normal-appearing ROIs were defined separately for their corresponding normal-appearing cortical and WM portions. The adjacent normal-appearing ROI was within a 10-pixel vicinity of the lesion. A small gap was left between the lesion ROI and its adjacent normal-appearing ROI to reduce potential partial volume artifacts. After all ROIs had been segmented, the ROIs of lesions were overlaid on QSM images for a final quality control evaluation. Any blood vessels in the ROIs were removed, and any cortical or mixed lesions that were eroded or contaminated with artifacts due to QSM postprocessing were excluded from analysis. The susceptibility contrast of a lesion was quantified as the relative susceptibility between the lesion and its normal-appearing parenchyma, which was calculated by subtracting the mean susceptibility in the normal-appearing ROI from that in the lesion ROI.

ROI definition. A whole section of magnitude (A) and QSM images (B) show 1 cortical lesion (red arrows) and 1 WM lesion (blue arrows). C, The ROIs of the cortical lesion and its adjacent normal-appearing cortical gray matter counterpart are delineated in red and green lines, respectively. D, The ROIs of the WM lesion and its adjacent normal-appearing white matter counterpart are delineated in blue and pink lines, respectively. ROIs were first defined on T2*-spoiled gradient-recalled images and then transferred to the other coregistered images. The gap between the lesion ROIs and the adjacent normal-appearing parenchyma reduces the partial volume effect in the segmentation. CSFnMPRAGE indicates CSF-nulled MPRAGE; WMnMPRAGE, WM-nulled MPRAGE.
Statistics
The relative susceptibility values for the set of cortical lesions, cortical portions of mixed lesions, WM lesions, and the WM portions of mixed lesions were each compared with zero by using the 1-sample t test. The relative susceptibility values in all cortical and WM lesions in the same subject were also averaged respectively; then, the above t test were repeated. The statistical significance threshold was set as P < .05, with multiple comparisons corrected by the Bonferroni method.
Results
Of the 14 patients (40.4 ± 7.9 years of age, 7.9 ± 7.2 years of disease duration; see more detail in Table 1), 13 patients had relapsing-remitting MS, while 1 patient had relapsing-remitting MS but was transitioning to secondary-progressive MS. Twelve patients were undergoing disease-modifying therapy. A total of 183 lesions were identified (after removing 1 cortical lesion that contained notable artifacts on the QSM image): 27 (14.8%) cortical, 147 (80.3%) WM, and 9 (4.9%) mixed. Eight of the 14 patients had cortical lesions (Table 1). Prior clinical 3T MR images indicated that all WM lesions were older than 3 months, and 8 of them (all from patient 4) were once contrast-enhancing >9 months before the 7T scan (Table 1), suggesting (but not proving) that none of the WM lesions in our sample were acute. Cortical lesions could not be reliably identified on prior 3T clinical images, and their ages were not determined. All patients were clinically stable between the time of the prior scan and the 7T scan.
The mean relative susceptibility values for 147 WM and 27 cortical lesions were 0.014 ± 0.014 ppm and −0.018 ± 0.013 ppm, respectively. The relative susceptibility value was positive for 132 of the 147 (89.8%) WM lesions, but negative for 25 of the 27 (92.6%) cortical lesions (Figs 2A and 3). Of 2 cortical lesions whose susceptibility was positive, one had a susceptibility of 0.008 ppm (with a dark center and an asymmetric bright rim, Fig 4) and the other had a susceptibility that was almost zero (0.0004 ppm). The mean relative susceptibility value was significantly higher than zero for WM lesions (P < 10−22) but significantly lower than zero for cortical lesions (P < 10−7) (Table 3).
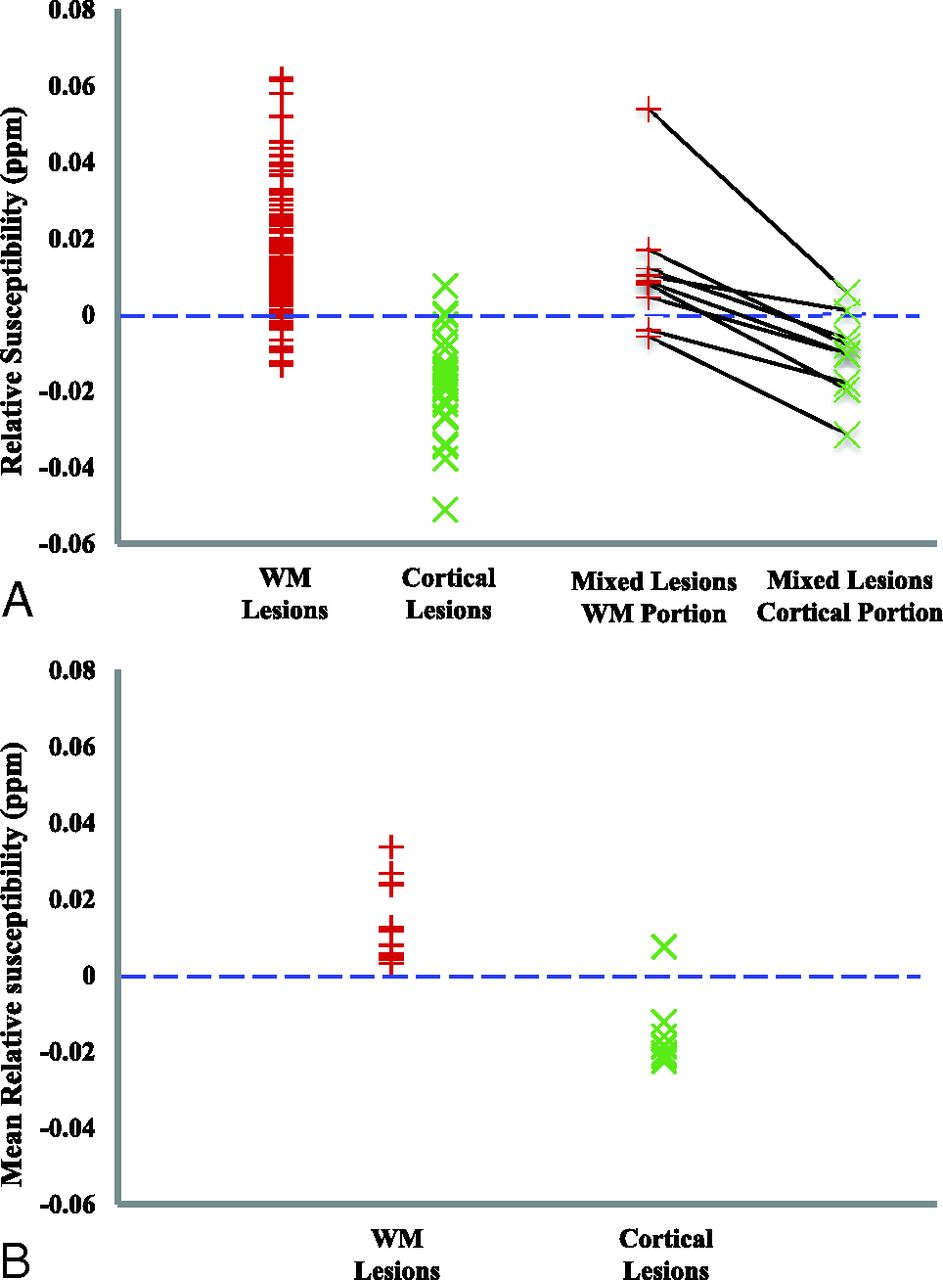
Relative susceptibility in MS lesions. A, The relative susceptibility in each individual lesion. Each black line on the right connects a pair of WM and cortical portions in a mixed lesion. B, The mean relative susceptibility after averaging the relative susceptibility across all lesions per type for each patient (13 patients had WM lesions, and 8 patients had cortical lesions).
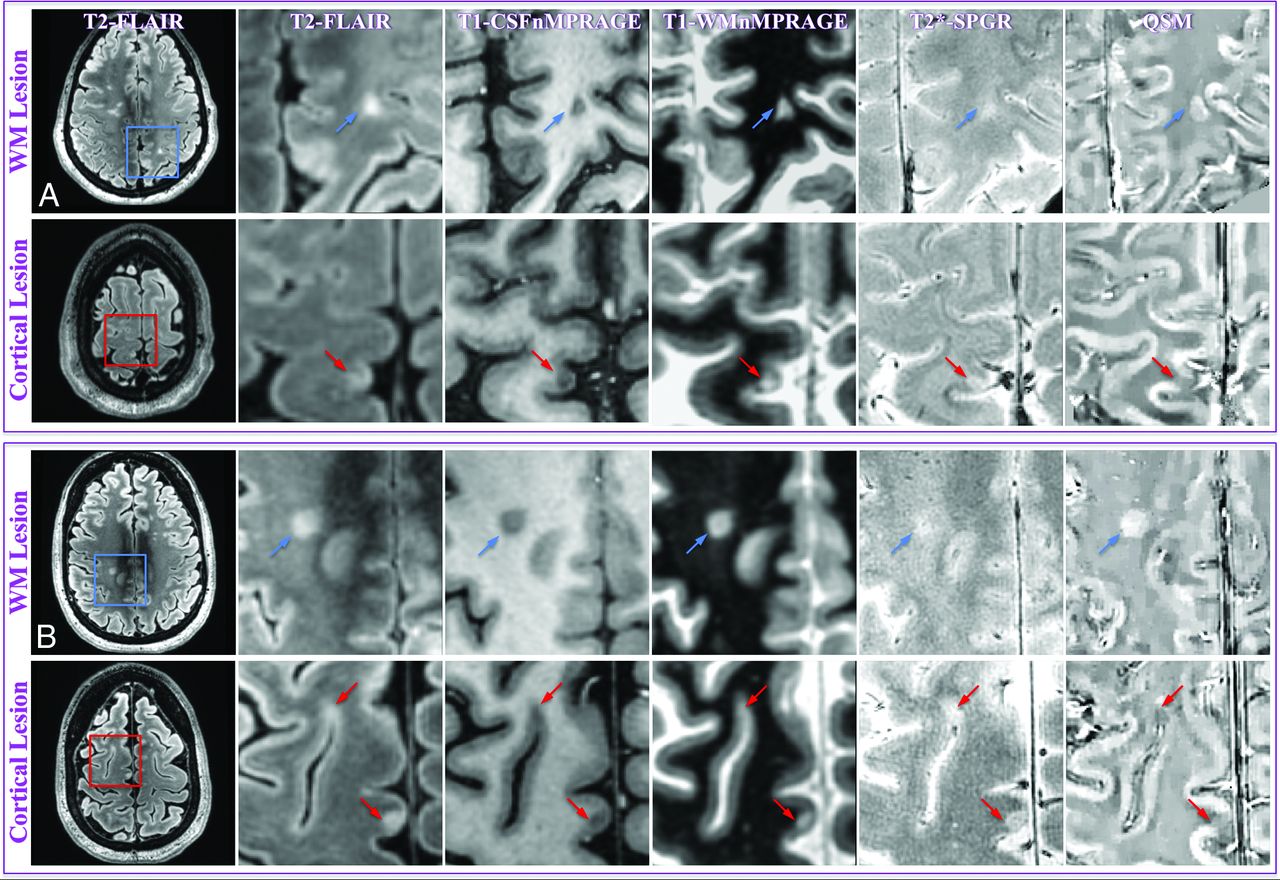
MR images of representative WM and cortical lesions from patients 4 (A) and 5 (B). A whole section of the T2-MPFLAIR image is displayed on the left column with a zoomed-in region (blue/red square) for all image contrasts. Two WM lesions (blue arrows) and 3 cortical lesions (red arrows) are shown. WM and cortical lesions are hyper- and hypointense relative to their adjacent parenchyma on QSM images, respectively, while both types of lesions show an identical contrast on all other images. CSFnMPRAGE indicates CSF-nulled MPRAGE; WMnMPRAGE, WM-nulled MPRAGE.
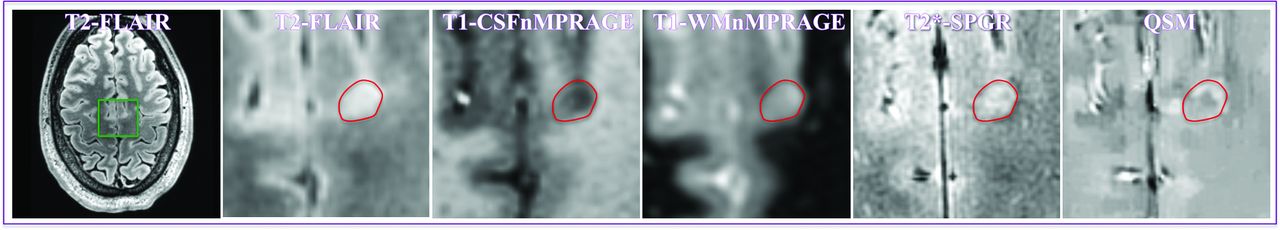
MR images of the only cortical lesion from patient 2. The lesion had a positive relative susceptibility and demonstrated a hyperintense core surrounded by an asymmetric hyperintense rim, suggesting that the lesion may have iron at its edge. Please see the Fig 3 legend for image descriptions.
Mean lesion susceptibility relative to normal-appearing parenchymaa
After we averaged the susceptibility across lesions within each patient, all 13 patients had positive average relative susceptibility values for WM lesions (0.014 ± 0.010 ppm), and 7 of the 8 patients with cortical lesions had a negative average relative susceptibility value for cortical lesions (−0.015 ± 0.009 ppm) (Fig 2B). The patient with a positive average relative cortical susceptibility value for cortical lesions had only 1 cortical lesion (Fig 4). This patient-averaged relative susceptibility value was again significantly higher than zero (P < .0004) for WM lesions but significantly lower than zero (P < .004) for cortical lesions (Table 3).
The relative susceptibility values for WM and cortical portions in 9 mixed lesions were 0.014 ± 0.018 ppm and −0.009 ± 0.012 ppm, respectively. All 9 mixed lesions had higher relative susceptibility values in their WM portions compared with their cortical counterparts. Seven of the 9 (77.8%) lesions had positive relative susceptibility values in their WM portions (P = .043), and the same percentage of lesions had negative relative susceptibility values in their cortical portions (P = .054) (Figs 2A and 5 and Table 3).
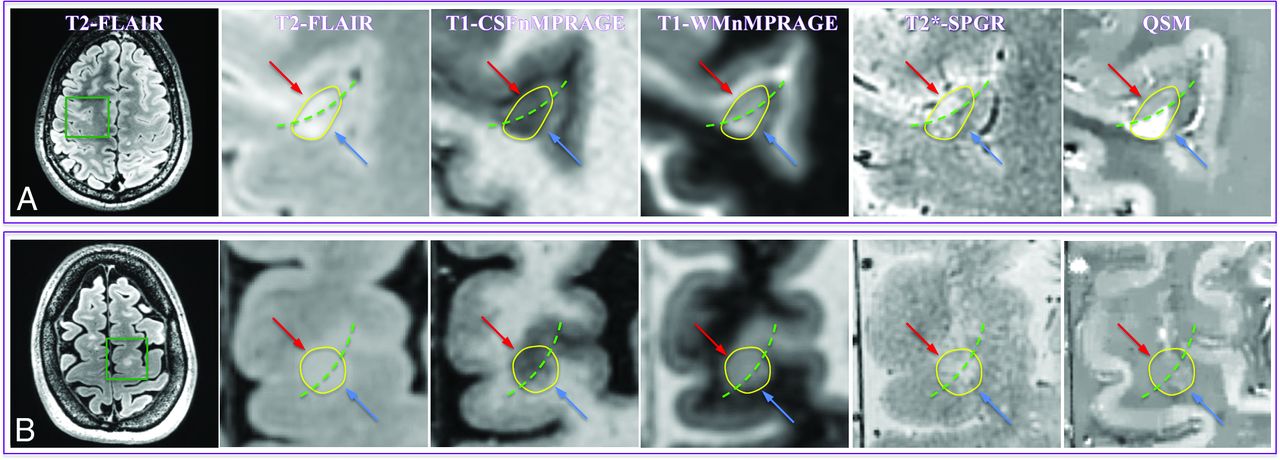
MR images of representative mixed lesions (yellow circles) from patients 1 (A) and 6 (B). The green dashed line divides a mixed lesion into its cortical (red arrow) and WM (blue arrow) components. A, The lesion has a QSM hypointense cortical portion and a hyperintense WM portion relative to adjacent normal-appearing GM and normal-appearing WM, respectively. B, The cortical component is hypointense compared with normal-appearing GM, while the white matter component is centrally isointense but peripherally slightly hyperintense compared with normal-appearing WM. Please see the Fig 3 legend for image descriptions.
Discussion
Our data demonstrate that the magnetic susceptibility values relative to normal-appearing adjacent parenchyma are negative for cortical lesions but positive for WM lesions, and a similar pattern was also found in the cortical and WM portions of mixed lesions, consistent with a recent postmortem study.22 The divergent contrast between cortical and WM lesions on QSM images cannot be revealed by using traditional MR imaging contrasts, including T2, T1, and T2*.
Positive Relative Susceptibility of WM Lesions
Our observation of positive relative susceptibility for WM lesions is in line with data from previous studies, in which most WM lesions appeared QSM hyperintense/isointense relative to normal-appearing WM.9,23 Demyelination (loss of diamagnetic myelin) has been identified as a contributor to the increased susceptibility.6⇓–8 Accumulation of highly paramagnetic iron is also often found in microglia/macrophages near the rim of acute and chronic active MS lesions,6,7,24,25 which can also contribute to an increased susceptibility. However, iron in most MS lesions will regress as disease duration increases, and in some inactive lesions, iron content could even be lower than that in normal-appearing WM.25 This may explain the presence of a few WM lesions with negative relative susceptibility. Nevertheless, because the susceptibility in most WM lesions was still positive relative to normal-appearing WM in our current study and previous studies,9,23 it is likely that the effect of iron loss often does not completely offset that of demyelination.
Negative Relative Susceptibility of Cortical Lesions
In contrast to the positive relative susceptibility of WM lesions, the negative relative susceptibility of cortical lesions is counterintuitive, though supported by a recent postmortem study.22 Potential factors for susceptibility decrease are an iron decrease and/or a myelin increase. In theory, after initial demyelination, remyelination is possible in MS, but the regenerated myelin sheath is typically thinner than normal myelin26; this finding is consistent with overall reduced myelin relative to normal-appearing gray matter in histologic studies.10,27 Accompanying demyelination, loss of iron in cortical lesions has also been observed.10 The 2 contributions both lead to a decreased R2* (or increased T2*), as has been consistently reported in recent MR imaging studies.10⇓⇓–13 However, unlike their similar effects on R2*/T2*, demyelination increases whereas the loss of iron decreases susceptibility. Therefore, in this particular case, QSM resolves a limitation of R2*/T2* mapping because it allows us to further conclude that in cortical lesions, iron loss dominates the susceptibility contrast over demyelination.
Interpretation of the Different Susceptibility Contrast
The different susceptibility contrast between cortical and WM lesions may be partly because the degree of myelination in the cortex is much less than that in WM, while the difference in their iron concentration is small.28 When both demyelination and iron loss are present, less iron loss is required to overwhelm demyelination in cortical lesions compared with WM. Indeed, in the cortex, iron has already been demonstrated to be the dominant source of MR susceptibility contrast and is well-correlated to both susceptibility and R2*/T2*.29,30 Alternatively, this finding suggests that whenever there is increased iron in cortical lesions, a positive susceptibility value should be expected. The observation of iron accumulation in active cortical lesions has been reported in a previous study,27 and the positive susceptibility for cortical lesions did occur in our study. However, these positive susceptibility lesions were only 7.4% of all our cortical lesions. Although one may argue that this could be because most of our cortical lesions were in their chronic stage, in chronic WM lesions, an increased iron level can be maintained for several years.9,31 Moreover, recent results from R2*/T2* mapping consistently showed reduced R2* (or increased T2*) in cortical lesions,10⇓⇓–13 and this could be even independent of disease stage.11,12 Thus, the underlying structural difference between the white matter and cortex alone may not explain all of the susceptibility difference, and pathologic changes that evolve differentially with time may also play a role.
Pathologically, an intact BBB and low degree of inflammation in cortical lesions suggest that there are fewer macrophages/microglia (either infiltrated or locally activated) than in WM lesions, especially at the active and chronic active phases.6,25 These cells phagocytize iron released from damaged oligodendrocytes and retain the iron in chronic WM lesions until the macrophages and microglia degenerate.25 Therefore, the paucity of these iron holders in cortical lesions may reduce the time interval for an increased iron level in these lesions. Thus, we speculate that compared with WM lesions, the time window for the initial phase of iron accumulation is narrower in cortical lesions due to their faster iron release secondary to the lack of inflammatory cells. This narrow time window could make it difficult for susceptibility-contrast MR imaging to depict the stage of iron accumulation in cortical lesions. Because free iron can cause oxidative neurodegeneration,25 the faster release of iron in cortical lesions may partly explain why cortical lesion load is more strongly correlated to the degree of neurodegeneration in MS.2 Nevertheless, this speculation warrants further investigation with longitudinal and contrast-enhanced studies.
Several limitations in our study should be addressed. First, due to the still low in vivo sensitivity of MR imaging to cortical lesions,10 our sampling of cortical lesions was likely incomplete and could be biased. The number of cortical lesions that can be analyzed can be further reduced after QSM reconstruction. Second, although we examined the lesion age by looking at the most recent clinically available contrast-enhanced 3T MR imaging, this can be imprecise for white matter and offers no information for cortical lesions. Given the lack of prior 7T imaging and/or concurrent gadolinium contrast administration, the acute nature of each individual lesion was not definitively ascertainable. Third, the relevance of the presumed iron loss in cortical lesions to clinical disability was not quantified. Last, QSM alone cannot distinguish the contribution of demyelination from that of an iron increase, which would often be seen at the acute phase of both cortical and WM lesions because QSM exhibits a positive sign in both cases, while R2* will decrease for demyelination and increase for iron deposition. To completely distinguish the susceptibility contributions from myelin and iron, our future studies will combine information from both QSM and R2* mapping.
Conclusions
QSM reveals an average negative magnetic susceptibility in cortical lesions and an average positive magnetic susceptibility in WM lesions, relative to their adjacent normal-appearing parenchyma. The negative susceptibility in cortical lesions suggests that iron loss dominates their susceptibility contrast. The different susceptibility contrast between cortical and WM lesions may reflect both their structural (degree of myelination) and pathologic (degree of inflammation) differences, in which the latter may lead to a faster release of iron in cortical lesions.
Acknowledgments
The authors thank Dr Maged Goubran for his insightful discussion and suggestions in the preparation of the manuscript. We also extend our gratitude to the editor and 2 anonymous reviewers for their constructive comments, which greatly helped us improve the final version of the manuscript.
Footnotes
Disclosures: Thomas Tourdias—RELATED: Grant: Association pour la Recherche sur la Sclérose En Plaques, Labex Translational Research and Advanced Imaging Laboratory. May Han—UNRELATED: Consultancy: Pfizer. Yi Wang—RELATED: Grant: National Institutes of Health (R01NS090464)*; UNRELATED: Patents (planned, pending or issued): Cornell University,* Comments: one of the inventors on the QSM patent; OTHER RELATIONSHIPS: in discussion with Cornell regarding QSM technology–based startup. Brian Rutt—RELATED: Grant: GE Healthcare.* Michael M. Zeineh—UNRELATED: Grants/Grants Pending: Doris Duke Charitable Foundation,* Dana Foundation,* Radiological Society of North America,* Other: GE Healthcare, Comments: some research support.* *Money paid to the institution.
This work was supported by GE Healthcare (B.R. and M.M.Z.); National Institutes of Health grants P41EB015891 (B.R. and M.M.Z), S10RR026351 (B.R. and M.M.Z), and RO1NS090464 (Y.W.); and grants from Association pour l'aide à la Recherche contre la Sclérose en Plaques and Translational Advanced Imaging Laboratory (T.T).
Indicates open access to non-subscribers at www.ajnr.org
References
- Received December 21, 2015.
- Accepted after revision April 4, 2016.
- © 2016 by American Journal of Neuroradiology


Jump to section
Related Articles
Cited By...
- Whole-Cerebrum distortion-free three-dimensional pseudo-Continuous Arterial Spin Labeling at 7T
- Imaging cortical multiple sclerosis lesions with ultra-high field MRI
- Quantitative Susceptibility Mapping of Time-Dependent Susceptibility Changes in Multiple Sclerosis Lesions
- Heterogeneity of Cortical Lesion Susceptibility Mapping in Multiple Sclerosis