
Abstract
BACKGROUND AND PURPOSE: The stiffness of intracranial tumors affects the outcome of tumor removal. We evaluated the stiffness of 4 common intracranial tumors by using MR elastography and tested whether MR elastography had the potential to discriminate firm tumors preoperatively.
MATERIALS AND METHODS: Thirty-four patients with meningiomas, pituitary adenomas, vestibular schwannomas, and gliomas scheduled for resection were recruited for MR elastography. On the elastogram, the mean and the maximum shear stiffnesses were measured by placing an ROI on the tumor. Blinded to the MR elastography findings, surgeons conducted qualitative intraoperative assessment of tumor consistency by using a 5-point scale. Histopathologic diagnosis was confirmed by using the resected specimens. The mean and maximum shear stiffnesses were compared with histopathologic subtypes, and the intraoperative tumor consistency was graded by the surgeons.
RESULTS: The mean and maximum shear stiffnesses were the following: 1.9 ± 0.8 kPa and 3.4 ± 1.5 kPa for meningiomas, 1.2 ± 0.3 kPa and 1.8 ± 0.5 kPa for pituitary adenomas, 2.0 ± 0.4 kPa and 2.7 ± 0.8 kPa for vestibular schwannomas, and 1.5 ± 0.2 kPa and 2.7 ± 0.8 kPa for gliomas. The mean and maximum shear stiffnesses for meningiomas were higher than those of pituitary adenomas (P < .05). The mean and maximum shear stiffnesses were significantly correlated with the surgeon's qualitative assessment of tumor consistency (P < .05). The maximum shear stiffness for 5 firm tumors was higher than that of nonfirm tumors (P < .05).
CONCLUSIONS: MR elastography could evaluate intracranial tumors on the basis of their physical property of shear stiffness. MR elastography may be useful in discriminating firm tumors preoperatively.
ABBREVIATIONS:
- MRE
- MR elastography
- MEG
- motion-encoding gradient
- maxSS
- maximum shear stiffness
- meanSS
- mean shear stiffness
Many histopathologic processes in tumors, for example cell proliferation, angiogenesis, fibrosis, calcification, necrosis, and cyst formation, cause marked changes in the viscoelastic properties of tissue. Therefore, physicians have used palpation of the body to detect tumors in daily clinical settings. Regarding intracranial tumors, however, there is no clinical precedent for tumor stiffness. Only neurosurgeons have had the privilege of palpating intracranial tumors at the time of tumor resection. The degree of tumor stiffness or consistency is critical information for precise neurosurgical resection of intracranial tumors such as meningiomas, pituitary adenomas, and vestibular schwannomas, especially those surrounded by important neurovascular structures. Differences in histopathologic characteristics, namely meningothelial-versus-fibrous meningiomas, fibrous-versus-nonfibrous pituitary adenomas, Antoni A- versus Antoni B-dominant schwannomas, and high- versus-low-grade gliomas, might be correlated to the viscoelastic properties of intracranial tumors. Although conventional MR imaging and some other MR imaging sequences have been reported capable of predicting intracranial tumor consistency or fibrosis, they have not been used to directly assess the viscoelastic properties of tumors.1⇓–3
MR elastography (MRE) is an emerging technology enabling the noninvasive assessment of the viscoelastic properties of tissues in vivo.4,5 MRE uses continuous shear waves generated by an extracorporeal mechanical wave driver, imaging the propagating shear waves with a phase-contrast MR image, and processing the wave images with an inversion algorithm to obtain a quantitative cross-sectional image of the shear stiffness map known as an elastogram.6 Since its first description by Muthupillai et al in 1995,4 many clinical applications have been studied, especially for assessing liver disease. Multiple studies have demonstrated a strong correlation between MRE-measured hepatic stiffness and the stage of fibrosis at histology. MRE can serve as a more accurate alternative to invasive biopsy, which has been the criterion standard for the diagnosis and staging of liver fibrosis.7 Although MRE is not common in a neurologic setting, a series of attempts have been made to measure the stiffness of the brain affected by Alzheimer disease,8,9 multiple sclerosis,10 and normal-pressure hydrocephalus.11,12 As for intracranial tumors, only a few studies involving meningiomas and glioblastomas have been published.13,14 In these studies, a correlation between histopathologic characteristics and MRE has not been described in detail. The purposes of the present study were the following: 1) to evaluate tumor stiffness by using MRE in relation to the histopathology, and 2) to test whether MRE has the potential to discriminate firm tumor preoperatively.
Materials and Methods
Ethics
Written informed consent was obtained from all patients in our institutional review board–approved study.
Patients
Between September 2014 and June 2015, MR imaging examinations, including MRE, were performed on 34 consecutive patients (11 men and 23 women; mean age, 54 years; range, 31–77 years) scheduled for resection with previously identified meningiomas, pituitary adenomas, vestibular schwannomas, and gliomas by using conventional MR imaging with contrast. All patients underwent microscopic surgery performed by experienced neurosurgeons at our university hospital. Blinded to the MRE results, surgeons graded tumor stiffness at the time of resection. The dominant tissue consistency was graded by using a 5-point scale previously reported by Murphy et al13 as follows: 1, soft; 2, mostly soft; 3, intermediate; 4, mostly firm (at least 75%–80% of the tumor was firm and required ultrasonic aspiration at a high setting); and 5, firm (most of the tumor required ultrasonic aspiration at a maximum setting). We used an ultrasonic aspirator (Sonopet Ultrasonic Aspirator; Stryker, Kalamazoo, Michigan) when we could not resect tumors by using an air suction tube. In this study, tumors on the scale of 4 and 5 were defined as “firm,” and tumors on the scale of 1–3 were defined as “nonfirm” by surgeons. All surgical procedures were recorded by using a digital video recorder (DATA Gen Pro; Seventh Dimension Design, Hyogo, Japan) and were reviewed for this assessment.
MR Elastography
MRE was performed by using a 3T clinical unit (Discovery MR750W; GE Healthcare, Milwaukee, Wisconsin) with a 12-channel phased array Neurovascular Array Coil (Medrad, Indianola, Pennsylvania). A passive pneumatic driver with a diameter of 19 cm was positioned underneath the occipital portion of the head. Shear waves were introduced in the brain by using the MR Touch system (GE Healthcare) (Fig 1). The imaging parameters for spin-echo echo-planar imaging–based MRE were as follows: TR, 1000 ms; TE, 86.4 ms; FOV, 24 cm; bandwidth, ± 250 kHz; 64 × 64 matrix (256 × 256 reconstruction matrix with zero-filled interpolation); and section thickness, 5 mm. These acquisitions were performed with a single-shot, 1-signal average, 8 MRE time points, 10–13 sections, MRE motion-encoding in the through-plane direction; and no flow compensation or spatial presaturation. Parallel imaging (array spatial sensitivity encoding technique) was used with a reduction factor of 2. To optimize the motion-encoding gradient (MEG) frequency and the external driver frequency, we tested various MEG frequencies from 40- to 120-Hz and from 40- to 120-Hz driver frequencies at every 20 Hz, otherwise under the same imaging conditions, on a healthy volunteer before commencement of this study. The images generated by using MRE included wave images, depicting the tissue motion, and stiffness images (elastograms).

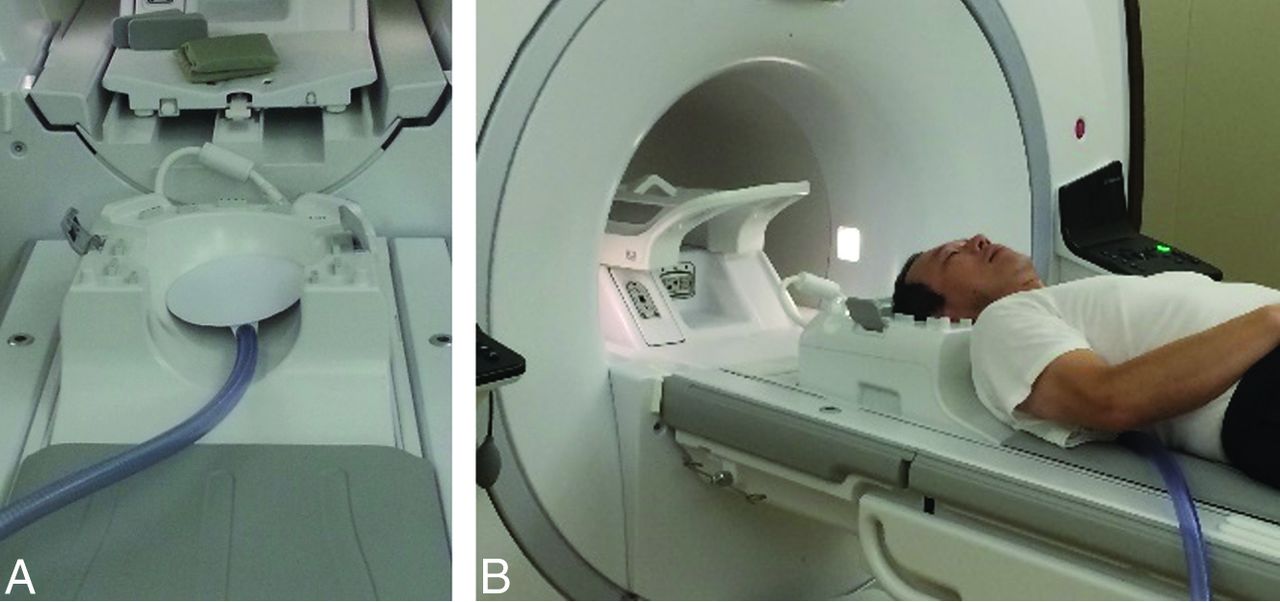
A passive pneumatic driver (MR Touch; GE Healthcare) was placed in a 12-channel phased array Neurovascular Array Coil (A). Shear waves were introduced in the brain by using this system (B).
The criteria for optimization were the presence of noninterfering parallel waves in the wave images, homogeneity of the stiffness distributions for the white matter of the cerebral and the cerebellar hemispheres, and the image signal-to-noise ratio. The previously reported stiffness values for normal white and gray matter were also compared with the measured values from the stiffness map. The red and blue stripes on the wave images show the mechanical waves propagating within the brain. The deepness of the colors reflects the wave amplitude, and their width indicates the wavelength. A longer wavelength reflects faster wave propagation in the media, which indicates higher elasticity of the tissue. The wave information is processed to produce 2D color-coded elastograms and 2D quantitative gray-scale elastograms. ROIs can be drawn on the gray-scale elastograms to measure the elasticity (typically reported in kilopascals). A cross-hatching pattern superimposed on the elastograms indicates less reliable areas for measurement of the elasticity based on the wave amplitude, the pattern of the waves in the wave images, and the signal-to-noise ratio of the magnitude images.
In this study, elastograms were qualitatively assessed for the degree of image quality, such as the extent of signal loss, and quantitatively for the areas without cross-hatches. After determining the optimal motion-encoding gradient frequency, we also examined the external driver amplitudes, namely 50% versus 70%. As a result, an MEG of 60 Hz, an external driver frequency of 40 Hz, and an amplitude of 50% were determined to be optimal in this settings. The choice of motion and MEG frequencies was determined subjectively during this optimization process. The acquisition time for MRE was 50 seconds at most.
Conventional MR Imaging
Conventional MR imaging with contrast media and arterial spin-labeled perfusion imaging were also performed in the current study to correctly demarcate the tumor area, which became the reference when ROI placement on the elastogram was performed. The imaging parameters have been described previously.14⇓⇓⇓–18
Stiffness Measurement on MR Elastogram
The signal intensity reflects the stiffness on each elastogram. For the measurement of tumor stiffness, the largest possible ROI was placed on the tumors by avoiding the interference fringes on the wave image and cross-hatches on the stiffness map. The mean shear stiffness (meanSS) and the maximum shear stiffness (maxSS) were measured in kilopascals. Because the anatomic boundary of the tumor was difficult to discern on the stiffness map alone, T2-weighted axial images, fat saturated T1-weighted images obtained pre- and postcontrast administration, and the axial diffusion-weighted image of the corresponding sections with the stiffness map of the corresponding section were also simultaneously displayed. ROIs ranging from 79 to 1874 pixels were drawn freehand on the workstation display. If the tumor was partially covered by cross-hatches, lesion stiffness in the area without cross-hatches was measured. The measurements were repeated twice for each region, and the values were averaged.
Histopathologic Evaluation
Sections were stained with hematoxylin-eosin for routine histopathology. Immunohistochemical stains were also used for the following: epithelial membrane antigen and vimentin for meningiomas; adenocorticotrophic hormone, prolactin, growth hormone, luteinizing hormone, follicle-stimulating hormone, thyroid-stimulating hormone, and cytokeratin CAM5.2 for pituitary adenomas; S-100 for vestibular schwannomas; and glial fibrillary acidic protein, oligodendrocyte transcription factor (Olig2), anti-O6-methylguanine methyltransferase, isocitrate dehydrogenase 1, and p53 for gliomas. Additionally, Ki-67 was examined for all samples. On the basis of the results, an experienced pathologist (S.B.) determined the histopathologic diagnosis.
Statistical Analysis
The meanSS and maxSS were compared among meningiomas, pituitary adenomas, vestibular schwannomas, and gliomas by using the Kruskal-Wallis H test following the Mann-Whitney U test with Bonferroni correction. The correlations between the meanSS and maxSS and a 5-point scale of intraoperative tumor consistency were examined by using the Spearman rank order test. The meanSS and maxSS were compared between the intraoperative firm tumors (intraoperative consistency scale, 4 and 5) and those that were nonfirm (intraoperative consistency scale, 1∼3) by using the Mann-Whitney U test. Probability values of <.05 were considered significant. For the statistical analysis, the freely available software EZR (Saitama Medical Center, Jichi Medical University; http://www.jichi.ac.jp/saitama-sct/SaitamaHP.files/statmed.html) was used.
Results
The patient characteristics, tumor location, size, mean and maximum tumor shear stiffness assessed by using MRE, and the intraoperative tumor consistency in 34 patients are summarized by histopathologic subtypes in Tables 1⇓⇓–4.
Summary of patient histopathologic characteristics: meningiomas (13 cases)
Pituitary adenomas (11 cases)
Vestibular schwannomas (6 cases)
Gliomas (4 cases)
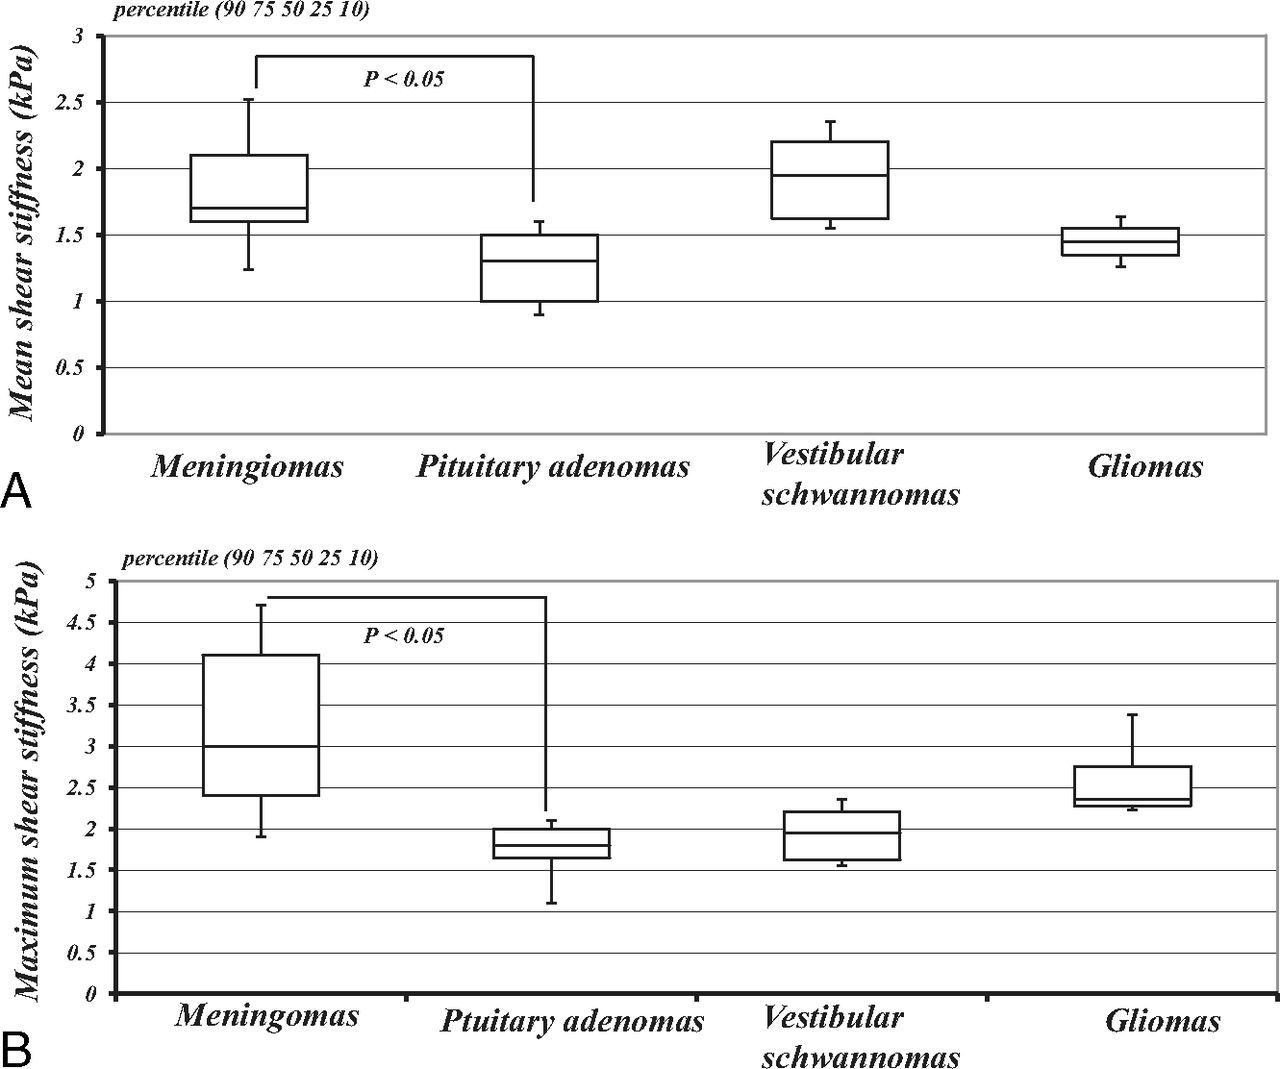
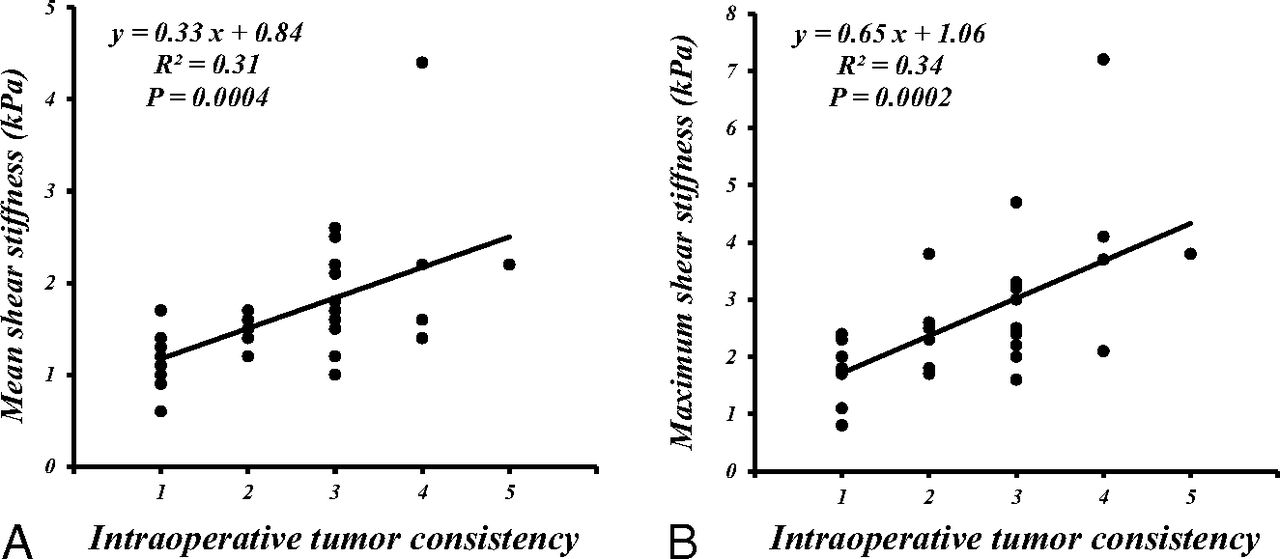
The mean meanSS and maxSS were as follows: 1.9 ± 0.8 kPa and 3.4 ± 1.5 kPa, respectively, for 13 patients with meningiomas; 1.2 ± 0.3 kPa and 1.8 ± 0.5 kPa, respectively, for 11 patients with pituitary adenomas; 2.0 ± 0.4 kPa and 2.7 ± 0.8 kPa, respectively, for 6 patients with vestibular schwannomas; and 1.5 ± 0.2 kPa and 2.7 ± 0.8 kPa, respectively, for 4 patients with gliomas. The meanSS and maxSS of meningiomas were higher than those of pituitary adenomas (P < .05) (the Kruskal-Wallis H test following the Mann-Whitney U test with Bonferroni correction) (Fig 2). Although the meanSS of meningiomas did not significantly correlate with the intraoperative grading (Fig 2A), significant correlations between the maxSS and the surgeon's qualitative assessment of tumor consistency were obtained (P < .05) (Spearman rank order test) (Fig 3). Regarding all intracranial tumors, both the meanSS and maxSS significantly correlated with the surgeon's grading (P < .05) (Spearman rank order test) (Fig 4). In this study, 29 cases were nonfirm (intraoperative consistency scale, 1∼3), whereas 5 tumors were firm (intraoperative consistency scale, 4 and 5), requiring ultrasonic aspiration at high settings. The meanSS and maxSS of tumors that were not firm were 1.6 ± 2.6 kPa and 2.4 ± 1.2 kPa, respectively. The meanSS and maxSS of tumors that were firm were 3.0 ± 2.6 kPa and 4.2 ± 1.9 kPa, respectively. Although the meanSS for the firm tumors was not significantly higher than that of tumors that were not firm, the maxSS for the firm tumors was significantly higher than that of tumors that were not firm (P < .05, the Mann-Whitney U test) (Fig 5).

Comparison of the meanSS and maxSS determined by using MRE among histopathologically variable intracranial tumors: 13 cases of meningiomas (meanSS = 1.9 ± 0.8 kPa, maxSS = 3.4 ± 1.5 kPa), 11 cases of pituitary adenomas (meanSS = 1.2 ± 0.3 kPa, maxSS = 1.8 ± 0.5 kPa), 6 cases of vestibular schwannomas (meanSS = 2.0 ± 0.4 kPa, maxSS = 2.7 ± 0.8 kPa), and 4 cases of gliomas (meanSS = 1.5 ± 0.2 kPa, maxSS = 2.7 ± 0.8 kPa). The meanSS and maxSS of meningiomas were higher than those of the pituitary adenomas (P < .05). Box-and-whisker plots show the meanSS (A) and maxSS (B). The lower and upper hinges of the boxes denote the 25th and 75th percentiles, respectively. The median (50th percentile) of each distribution is indicated by the line. The whiskers on each side denote the 10th and 90th percentiles.
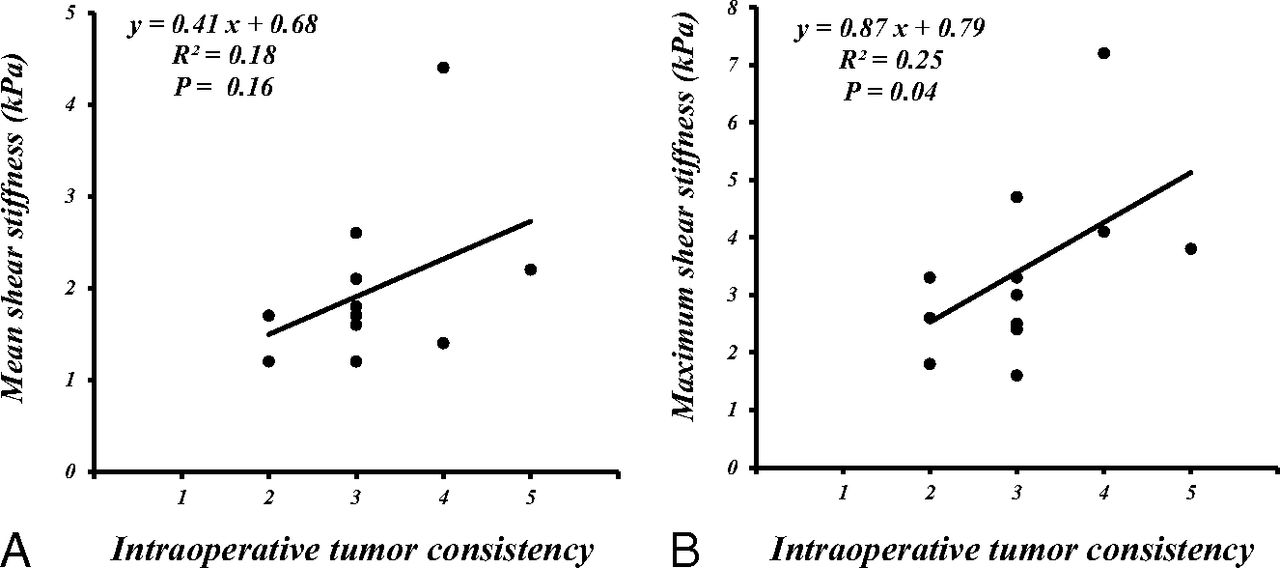
Scatterplot of the meanSS and maxSS (kPa) determined by using MRE and a 5-point scale of intraoperative qualitative assessment of tumor consistency in 13 patients with meningiomas. Although the meanSS did not significantly correlate with the grading (A), significant correlations between the maxSS and the grading were obtained (B) (P < .05) (Spearman rank order test).

Scatterplot of the meanSS and maxSS (kPa) determined by using MRE and a 5-point scale of intraoperative qualitative assessment of tumor consistency in 34 patients with 4 common intracranial tumors. Both the meanSS and maxSS were significantly correlated with the surgeon's grading (P < .05) (Spearman rank order test).

Comparison of the meanSS and maxSS was determined by using MRE among tumors with an intraoperative consistency scale of 1–3 that were nonfirm and those with a scale of 4 and 5 that were firm; there were 29 cases that were nonfirm (meanSS = 1.6 ± 2.6 kPa; maxSS = 2.4 ± 1.2 kPa) and 5 cases that were firm (meanSS = 3.0 ± 2.6 kPa; maxSS = 4.2 ± 1.9 kPa). The maxSS values in firm tumors were higher than those in nonfirm tumors (P < .05; Mann-Whitney U test). Box-and-whisker plots show the meanSS (A) and maxSS (B). The lower and upper hinges of the boxes denote the 25th and 75th percentiles, respectively. The median (50th percentile) of each distribution is indicated by the line. Whiskers on each side denote the 10th and 90th percentiles.
Representative cases of a meningioma (case 44/female, right parasagittal meningothelial meningioma), a pituitary adenoma (case 41/female, follicle-stimulating hormone–producing adenoma), a vestibular schwannoma (case 51/male, left cerebellopontine angle), and a glioma (case 61/female, right insular glioblastoma) involving contrast-enhanced T1-weighted and T2-weighted MRI, wave MRE images, elastograms, and hematoxylin-eosin–stained sections (original magnification, ×100) are shown in Fig 6. Representative cases of firm tumors (case 51/male, left cerebellopontine angle fibrous meningioma; case 63/female, recurrent fibrous nonfunctioning pituitary adenoma) involving contrast-enhanced T1-weighted and T2-weighted MRI, wave MRE images, elastograms, and hematoxylin-eosin–stained sections (original magnification, ×100) are shown in Fig 7.
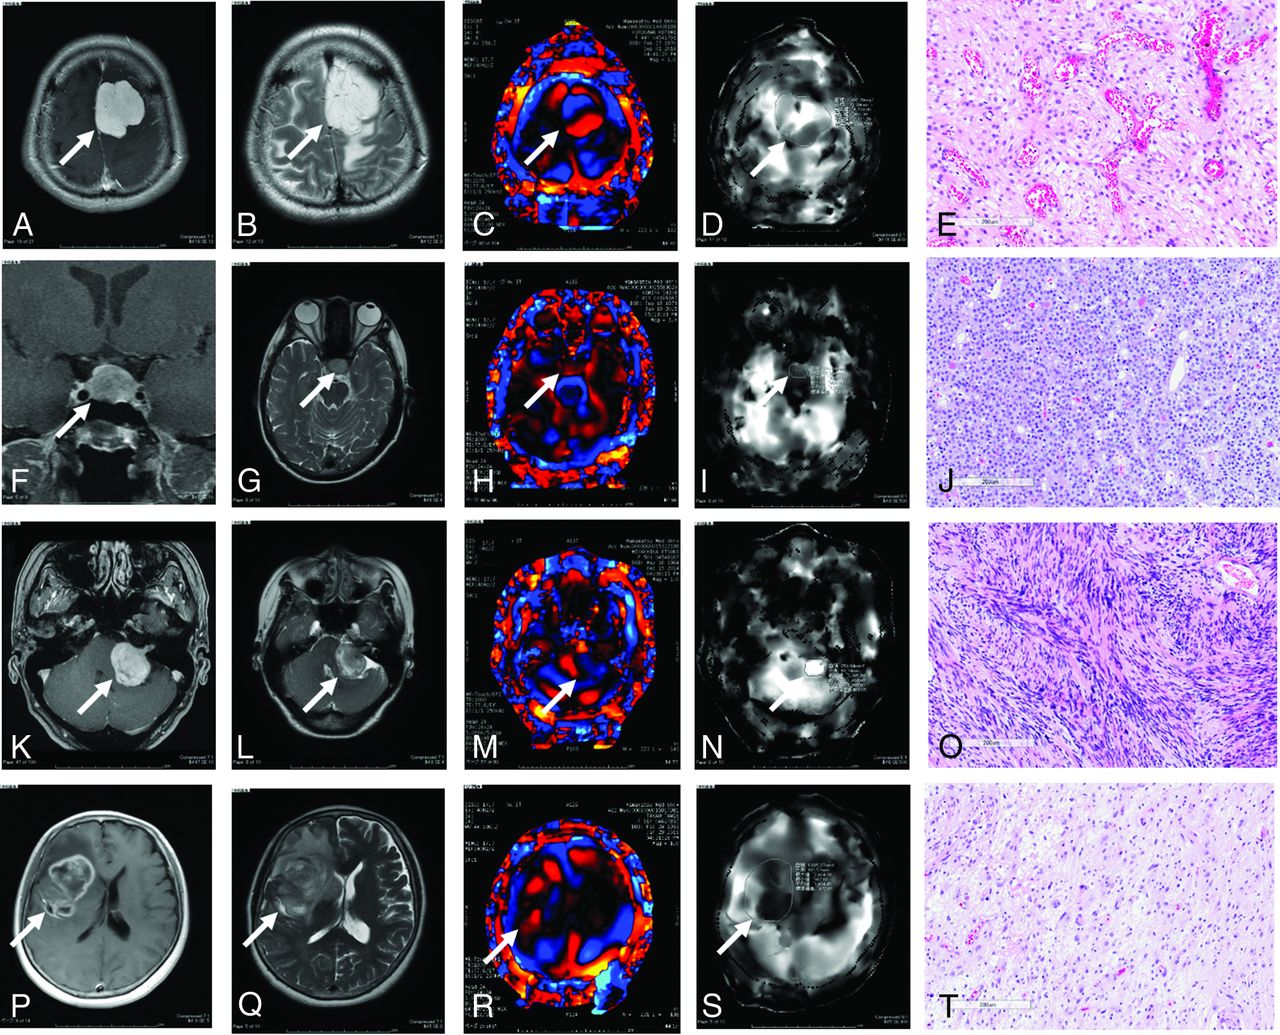
Upper: Left parasagittal meningioma in a 44-year-old woman. A, Axial postcontrast T1-weighted MR imaging shows a strongly enhanced tumor (arrow). B, Axial T2-weighted MR imaging shows a hyperintense tumor (arrow). C, Wave MRE image (arrow). D, Elastogram shows tumor shear stiffness (arrow) (meanSS = 2.1 kPa; maxSS = 4.7 kPa). The intraoperative tumor consistency was intermediate (scale 3). E, Histopathologic examination of the resected tumor indicates meningothelial meningioma (hematoxylin-eosin stain; scale bar, 200 μm). Upper middle: follicle-stimulating hormone–producing adenoma in a 41-year-old woman. F, Axial postcontrast T1-weighted MR imaging shows a weakly enhanced tumor (arrow). G, Axial T2-weighted MR imaging shows an isointense tumor (arrow). H, Wave MRE image (arrow). I, Elastogram shows tumor shear stiffness (arrow) (meanSS = 0.9 kPa; maxSS = 1.1 kPa). The intraoperative tumor consistency was soft (scale 1).J, Histopathologic examination of the resected tumor indicates diffuse adenoma (hematoxylin-eosin stain; scale bar, 200 μm). Lower middle: Left vestibular schwannoma in a 50-year-old woman. K, Axial postcontrast T1-weighted MR imaging shows a strongly enhanced tumor (arrow). L, Axial T2-weighted MR imaging shows a mixed intensity tumor (arrow). M, Wave MRE image (arrow). N, Elastogram shows tumor shear stiffness (arrow) (meanSS = 2.5 kPa; maxSS = 3.3 kPa). The intraoperative tumor consistency was moderate (scale 3). O, Histopathologic examination of the resected tumor indicates a schwannoma with a dominant Antoni A-type region (hematoxylin-eosin stain; scale bar, 200 μm). Lower: Right insular glioma in a 55-year-old woman. P, Axial postcontrast T1WI MR imaging shows a ring-enhanced tumor (arrow). Q, Axial T2-weighted MR imaging shows a mixed intensity tumor (arrow). R, Wave MRE image (arrow). S, Elastogram shows tumor shear stiffness (arrow) (meanSS = 1.5 kPa; maxSS = 2.2 kPa). The intraoperative tumor consistency was moderate (scale 3). T, Histopathologic examination of the resected tumor indicates glioblastoma (hematoxylin-eosin stain; scale bar, 200 μm).

Intraoperative tumors with a firm consistency. Upper: Left cerebellopontine angle meningioma in a 51-year-old man. A, Axial postcontrast T1-weighted MR imaging shows a strongly enhanced tumor (arrow). B, Axial T2-weighted MR imaging shows an isointense tumor (arrow). C, Wave MRE image (arrow). D, Elastogram shows tumor shear stiffness (arrow) (meanSS = 4.4 kPa; maxSS = 7.2 kPa). The intraoperative tumor consistency was mostly firm, requiring ultrasonic aspiration at a high setting (scale 4). E, Histopathologic examination of the resected tumor indicates fibrous meningioma (hematoxylin-eosin stain; scale bar, 200 μm). Lower: Nonfunctioning recurrent pituitary adenoma in a 63-year-old woman. F, Axial postcontrast T1-weighted MR imaging shows a strongly enhanced tumor (arrow). G, Axial T2-weighted MR imaging shows an isointense tumor (arrow). H, Wave MRE image (arrow). I, Elastogram shows tumor shear stiffness (arrow) (meanSS = 1.6 kPa; maxSS = 2.1 kPa). The intraoperative tumor consistency was mostly firm, requiring ultrasonic aspiration at a high setting (scale 4). J, Histopathologic examination of the resected tumor indicates diffuse adenoma with fibrosis (hematoxylin-eosin stain; scale bar, 200 μm).
Discussion
In this study, we measured the shear stiffness of 4 major intracranial tumors, namely meningiomas, pituitary adenomas, vestibular schwannomas, and gliomas by using MRE. Murphy et al13 reported the stiffness of meningiomas. Regarding pituitary adenomas and vestibular schwannomas, this is the first study to describe the direct measurement of shear stiffness by using MRE, to our knowledge. In relation to gliomas, Streitberger et al14 reported that the mean shear stiffness of glioblastomas in 22 patients was 1.32 ± 0.26 kPa; although the number of our glioma cases was small, the mean value of the shear stiffness was similar to their results. A significant difference was observed between the shear stiffness of meningiomas and that of pituitary adenomas. The result was compatible with our intraoperative impression of the consistency of these tumors during excision.
We have evaluated the dominant tissue consistency at tumor resection by using a 5-point scale as previously reported by Murphy et al.13 They found that the relative shear stiffness assessed by using MRE in meningiomas (13 cases) was significantly correlated with the 5-point scale. Although we could not reveal a significant correlation between the meanSS and the grading, we have demonstrated the significant correlation between the maxSS and our stiffness grading. We presume that this was partially the result of the surgeon's judgment of tumor stiffness, in which the scoring tended to be dependent on the hardest portions. It is also presumed that the statistical significance was affected by our coarse spatial resolution, which averaged the stiffness of the tissue. Therefore, the maximum average stiffness result became significant, but the average stiffness was not the result of further averaging.
We also demonstrated significant correlation for both the meanSS and maxSS with the stiffness grading of all of the intracranial tumors.
In addition, we found a significant difference in the maximum shear stiffness between tumors that were firm (intraoperative tumor consistency scale 4 and 5) and tumors that were nonfirm (intraoperative tumor consistency scale, 1∼3). The results suggest that MRE may be able to find firm tumors that may require special care in surgical planning or tumor removal.
In the current study, we demonstrated MRE and histopathologic findings representative of intraoperative firm tumors. In fibrous meningiomas (Fig 7, upper), the shear stiffness correlated with firm consistency intraoperatively. Meningothelial, fibrous, and transitional meningiomas are the most common histopathologic subtypes of meningiomas.19 Using MRE, we might differentiate relatively firm meningiomas such as fibrous and transitional meningiomas from relatively soft meningiomas such as meningothelial meningiomas. Most pituitary adenomas are soft and can be easily resected, preserving the tumor capsule by using suction and curettes with transsphenoidal surgery. However, as shown in Fig 7, lower part, some tumors are firm and fibrous and consequently difficult to resect. In transsphenoidal surgery for such firm pituitary adenomas, excessive maneuvers increase morbidity and mortality related to visual disturbance, panhypophysis, and intra- and extracapsular hemorrhage. Although previous studies have attempted to predict the consistency of pituitary adenomas with conventional MR imaging,1 diffusion-weighted MR imaging,2 and contrast-enhanced 3D FIESTA,3 these methods did not directly measure the shear stiffness of pituitary adenomas. To the best of our knowledge, our study is the first to demonstrate the shear stiffness of pituitary adenomas by using MRE.
The consistency of pituitary adenomas depends on the level of fibrosis that correlates with collagenous contents.20 MRE might be reflecting the collagenous content of pituitary adenomas. As for vestibular schwannomas, differences in the percentage of the Antoni A component (areas of compact, elongated cells with occasional nuclear palisading) and the Antoni B component (less cellular, with loosely textured cells with indistinct processes and variable lipidization) might determine the shear stiffness. Although the preoperative consistency of vestibular schwannoma has not been studied, the difficulties associated with the recently recommended subcapsular tumor dissection for the preservation of facial and cochlear nerve functions in vestibular schwannomas21 are related to tumor consistency. Therefore, as in transsphenoidal surgery for pituitary adenomas, preoperative assessment of vestibular schwannoma consistency would be recognized as being more important. MRE will be one of the choices in predicting the consistency of vestibular schwannomas preoperatively.
Although most brain MRE studies have been performed by using custom-built transducers in various laboratories worldwide, they have not been approved for their reliability and safety. In our study, we adapted a passive pneumatic driver (MR Touch) originally designed for abdominal MRE for introducing shear waves into the brain. Indeed, this was the only commercially available system that could be used for patients in Japan during this study. A higher motion frequency may be useful for superficial tumors, and a lower motion frequency may be useful for deep tumors. In the preliminary study with volunteers, we used the same MEG (60 Hz) and external driver frequency (60 Hz) reported by Murphy et al.13 However, we found that an external driver frequency of 60 Hz was not adequate for our system because the shear waves did not reach the center of the brain. This might be caused by the loose contact between the head and the external driver in our system. With reference to the cross-hatching area, we found that an MEG of 60 Hz, an external driver frequency of 40 Hz, and an amplitude of 50% were optimal in this system. The precise reason why a MEG frequency that is not equal to the external driver frequency works better is unclear; however, this technique has been widely used in the MRE literature as a means to reduce TE22 or to create broadband sensitivity for multifrequency MRE.23⇓⇓–26
Although the spatial resolution in our system was very low because of the low external driver frequency and limited matrix size, the shear stiffness of healthy regions of the brain such as the cerebellum was consistent among patients. Therefore, we used absolute values for both for the mean and maximum shear stiffness (kilopascal) in this study. We speculated that the region with the maximum shear stiffness indicated the region with firm consistency in tumors. However, we observed a case of glioma in which the region with maximum shear stiffness was the center of the cyst in the tumor. Our review of the published literature revealed that the stiffness of the glioma cyst has not been previously reported. The reason for the center of the cyst showing maximum shear stiffness was unclear. Although it is more likely artifacts than anything related to the intracystic pressure, it may be partially explained as follows: Because fluid is a less viscoelastic material, the shear stiffness of the cyst is increased when the intracyst fluid is tensely filled with fluid. Actually, in neurosurgical practice, the tense cyst in tumors is firmer than the surrounding normal brain tissue until it is opened; additionally, when obstructive hydrocephalus is present, the brain surface is firm until ventricular drainage is performed.
The current study had several limitations. First, the spatial resolution of the voxels (3.75 mm in-plane and 5 mm through-plane) used in our study was so coarse that the stiffness presented might include not only tumor tissue but also other surrounding tissue, including brain tissue, bone, and CSF. In a recent study by Murphy et al,23 the use of 2-mm, or at most 3-mm, voxels, with the exclusion of the edge pixels from the analysis in ROIs, was recommended because of errors associated with estimating spatial derivatives in the inversion algorithm and also for the minimization of partial-volume effects.
A higher spatial resolution would allow shear stiffness measurements in smaller tumors and provide more accurate regional shear stiffness measurements in large tumors with heterogeneous consistency. To overcome the low spatial resolution of MRE at the single harmonic driver frequency that we used, Sack et al27 at Charité established a multifrequency MRE to generate high-resolution elastograms.10,11,14,24
The recent development of a 3D multislab, multishot acquisition for whole-brain MRE could achieve high signal-to-noise efficacy.25⇓⇓⇓–29 3D analysis could improve the results if the wave propagation is complicated, especially if there is through-plane oblique wave propagation that a 2D analysis would not visualize correctly.
Second, the scaling of tumor consistency in our study involved a qualitative assessment by surgeons at the time of resection; a quantitative assessment of tumor consistency would be preferable. Third, because of the small sample size, we could not examine the histopathologic components corresponding to tumor consistency in detail. The correlation between shear stiffness measured by using MRE and meningioma subtypes, collagenous contents in pituitary adenomas, and heterogeneity of the Antoni pattern in vestibular schwannomas should be investigated in the future.
Conclusions
The shear stiffness measured by MRE could be used to evaluate histopathologic subtypes of intracranial tumors. MRE may be useful in the preoperative discrimination of firm tumors.
Acknowledgments
The authors thank Masanori Kawate and Kenichi Terashima for their technical assistance.
Footnotes
Naoto Sakai and Yasuo Takehara contributed equally to this study.
Disclosures: Naoto Sakai—RELATED: Grant: JSPS KAKENHI (grant No. 15K10359).
Indicates open access to non-subscribers at www.ajnr.org
References
- Received August 6, 2015.
- Accepted after revision April 11, 2016.
- © 2016 by American Journal of Neuroradiology


