Advertisement

Main menu

  • Home
  • Content
    • Current Issue
    • Accepted Manuscripts
    • Article Preview
    • Past Issue Archive
    • Video Articles
    • AJNR Case Collection
    • Case of the Week Archive
    • Case of the Month Archive
    • Classic Case Archive
  • Special Collections
    • AJNR Awards
    • ASNR Foundation Special Collection
    • Most Impactful AJNR Articles
    • Photon-Counting CT
    • Spinal CSF Leak Articles (Jan 2020-June 2024)
  • Multimedia
    • AJNR Podcasts
    • AJNR SCANtastic
    • Trainee Corner
    • MRI Safety Corner
    • Imaging Protocols
  • For Authors
    • Submit a Manuscript
    • Submit a Video Article
    • Submit an eLetter to the Editor/Response
    • Manuscript Submission Guidelines
    • Statistical Tips
    • Fast Publishing of Accepted Manuscripts
    • Graphical Abstract Preparation
    • Imaging Protocol Submission
    • Author Policies
  • About Us
    • About AJNR
    • Editorial Board
    • Editorial Board Alumni
  • More
    • Become a Reviewer/Academy of Reviewers
    • Subscribers
    • Permissions
    • Alerts
    • Feedback
    • Advertisers
    • ASNR Home

User menu

  • Alerts
  • Log in

Search

  • Advanced search
American Journal of Neuroradiology

American Journal of Neuroradiology

ASHNR American Society of Functional Neuroradiology ASHNR American Society of Pediatric Neuroradiology ASSR
  • Alerts
  • Log in

Advanced Search

  • Home
  • Content
    • Current Issue
    • Accepted Manuscripts
    • Article Preview
    • Past Issue Archive
    • Video Articles
    • AJNR Case Collection
    • Case of the Week Archive
    • Case of the Month Archive
    • Classic Case Archive
  • Special Collections
    • AJNR Awards
    • ASNR Foundation Special Collection
    • Most Impactful AJNR Articles
    • Photon-Counting CT
    • Spinal CSF Leak Articles (Jan 2020-June 2024)
  • Multimedia
    • AJNR Podcasts
    • AJNR SCANtastic
    • Trainee Corner
    • MRI Safety Corner
    • Imaging Protocols
  • For Authors
    • Submit a Manuscript
    • Submit a Video Article
    • Submit an eLetter to the Editor/Response
    • Manuscript Submission Guidelines
    • Statistical Tips
    • Fast Publishing of Accepted Manuscripts
    • Graphical Abstract Preparation
    • Imaging Protocol Submission
    • Author Policies
  • About Us
    • About AJNR
    • Editorial Board
    • Editorial Board Alumni
  • More
    • Become a Reviewer/Academy of Reviewers
    • Subscribers
    • Permissions
    • Alerts
    • Feedback
    • Advertisers
    • ASNR Home
  • Follow AJNR on Twitter
  • Visit AJNR on Facebook
  • Follow AJNR on Instagram
  • Join AJNR on LinkedIn
  • RSS Feeds

AJNR is seeking candidates for the AJNR Podcast Editor. Read the position description.

Research ArticleINTERVENTIONAL

Feasibility of Flat Panel Detector CT in Perfusion Assessment of Brain Arteriovenous Malformations: Initial Clinical Experience

M. Garcia, T.W. Okell, M. Gloor, M.A. Chappell, P. Jezzard, O. Bieri and J.V. Byrne
American Journal of Neuroradiology April 2017, 38 (4) 735-739; DOI: https://doi.org/10.3174/ajnr.A5091
M. Garcia
aFrom the Division of Diagnostic and Interventional Neuroradiology (M. Garcia)
cNuffield Department of Surgical Sciences and Department of Neuroradiology (M. Garcia, J.V.B.)
  • Find this author on Google Scholar
  • Find this author on PubMed
  • Search for this author on this site
  • ORCID record for M. Garcia
T.W. Okell
dCentre for Functional Magnetic Resonance Imaging of the Brain (FMRIB Centre) (T.W.O., M.A.C., P.J.), Nuffield Department of Neurosciences
  • Find this author on Google Scholar
  • Find this author on PubMed
  • Search for this author on this site
  • ORCID record for T.W. Okell
M. Gloor
bDivision of Radiological Physics (M. Gloor, O.B.), Department of Radiology Clinic for Radiology and Nuclear Medicine, University of Basel Hospital, Basel, Switzerland
  • Find this author on Google Scholar
  • Find this author on PubMed
  • Search for this author on this site
  • ORCID record for M. Gloor
M.A. Chappell
dCentre for Functional Magnetic Resonance Imaging of the Brain (FMRIB Centre) (T.W.O., M.A.C., P.J.), Nuffield Department of Neurosciences
eInstitute of Biomedical Engineering (M.A.C.), Department of Engineering, University of Oxford, Oxford, United Kingdom.
  • Find this author on Google Scholar
  • Find this author on PubMed
  • Search for this author on this site
  • ORCID record for M.A. Chappell
P. Jezzard
dCentre for Functional Magnetic Resonance Imaging of the Brain (FMRIB Centre) (T.W.O., M.A.C., P.J.), Nuffield Department of Neurosciences
  • Find this author on Google Scholar
  • Find this author on PubMed
  • Search for this author on this site
  • ORCID record for P. Jezzard
O. Bieri
bDivision of Radiological Physics (M. Gloor, O.B.), Department of Radiology Clinic for Radiology and Nuclear Medicine, University of Basel Hospital, Basel, Switzerland
  • Find this author on Google Scholar
  • Find this author on PubMed
  • Search for this author on this site
  • ORCID record for O. Bieri
J.V. Byrne
cNuffield Department of Surgical Sciences and Department of Neuroradiology (M. Garcia, J.V.B.)
  • Find this author on Google Scholar
  • Find this author on PubMed
  • Search for this author on this site
  • ORCID record for J.V. Byrne
  • Article
  • Figures & Data
  • Info & Metrics
  • Responses
  • References
  • PDF
Loading

Abstract

SUMMARY: The different results from flat panel detector CT in various pathologies have provoked some discussion. Our aim was to assess the role of flat panel detector CT in brain arteriovenous malformations, which has not yet been assessed. Five patients with brain arteriovenous malformations were studied with flat panel detector CT, DSC-MR imaging, and vessel-encoded pseudocontinuous arterial spin-labeling. In glomerular brain arteriovenous malformations, perfusion was highest next to the brain arteriovenous malformation with decreasing values with increasing distance from the lesion. An inverse tendency was observed in the proliferative brain arteriovenous malformation. Flat panel detector CT, originally thought to measure blood volume, correlated more closely with arterial spin-labeling-CBF and DSC-CBF than with DSC-CBV. We conclude that flat panel detector CT perfusion depends on the time point chosen for data collection, which is triggered too early in these patients (ie, when contrast agent appears in the superior sagittal sinus after rapid shunting through the brain arteriovenous malformation). This finding, in combination with high data variability, makes flat panel detector CT inappropriate for perfusion assessment in brain arteriovenous malformations.

ABBREVIATIONS:

ASL
arterial spin-labeling
bAVM
brain arteriovenous malformation
FPD
flat panel detector
pn
perinidal
rCBF
relative CBF
rCBV
relative CBV

Glomerular brain arteriovenous malformations (bAVMs) are characterized by pathologic vessels without intermingled normal brain tissue, whereas proliferative bAVMs are identified by normal brain tissue between dispersed abnormal vessels. The pattern of involved vessels composes the angioarchitecture of the lesion, while the hemodynamic character has been less well-studied.

The redirection of blood flow to the nidus of the AVM at the expense of perilesional tissues is known as “vascular steal”1 and has been studied by xenon-enhanced CT,2 133Xe inhalation with conventional angiography,3 CTP,4 PET,5,6 SPECT,7 DSC-MR imaging,8 and arterial spin-labeling (ASL).9,10 However, these techniques have been inconsistent in demonstrating perinidal hypoperfusion.

Flat panel detector CT (FPD-CT) is a novel technique for brain perfusion assessment, providing parenchymal blood volume maps.11⇓⇓⇓⇓⇓⇓–18 The aim of this study was to investigate the value of FPD-CT in bAVMs, which has not been assessed, yet, to our knowledge. FPD-CT data were compared with DSC-MR imaging and ASL-MR imaging.19,20

Case Series

Five patients with large (>3 cm) bAVMs (4 glomerular bAVMs, patients 1–4; 1 proliferative bAVM, patient 5) underwent FPD-CT and MR imaging with DSC and ASL. None of the patients had undergone prior treatment except patient 1, whose large bAVM had received partial treatment with 1 coil and 0.5 mL of a 1:1 n-BCA/lipiodol mixture with the goal of reducing arteriovenous shunting in a semiemergent situation. The study protocol was approved by the local ethics committee (Oxford University). Written consent was obtained from all patients.

Materials and Methods

Flat Panel Detector CT

FPD-CT was performed on a biplane FPD-angiography system (Axiom Artis dBA; Siemens, Erlangen, Germany). Eighty milliliters of iopamidol (370 mg iodine/mL, Niopam 370; Bracco, Milan, Italy) was applied intravenously (injection rate, 5 mL/s; injection pressure, 300 psi). The acquisition protocol consisted of 2 rotations: a mask run and a contrast-enhanced run. We manually started the latter14 as soon as contrast opacification of the superior sagittal sinus was observed, assuming that this time point represented a steady-state of contrast in the brain parenchyma for ideal collection of the fill run data. The parameters for each rotation run were the following: acquisition time, 8 seconds; matrix, 616 × 480; projection on a 30 × 40 cm flat panel; total angle, 200°; 0.5°/frame with a total of 400 frames. After the C-arm return of the run mask to its starting position, 2D-DSA images at a rate of 2 images per second were acquired for documentation of the contrast passage through the cerebral vasculature.17,18 The acquisition time was approximately 40 seconds.14

The reconstructed mask run and fill run were subtracted from each other. The steady-state value was calculated from an automated histogram analysis of the vessel tree.20 Further postprocessing provided an isotropic volume dataset.

MR Imaging Perfusion

DSC and ASL perfusion were performed on a 3T Tim Verio system (Siemens). An axial T1WI contrast-enhanced sequence served as a reference (acquisition time, 1 minute 46 seconds; TR/TE, 215/2.48 ms; 15 sections; section thickness, 4 mm; matrix, 208 × 320).

DSC perfusion imaging was performed with a gradient-echo echo-planar imaging sequence during the first pass of a 20-mL intravenous bolus of gadoteridol or gadobenate dimeglumine (ProHance or MultiHance; Bracco) at an injection rate of 5 mL/s followed by 40 mL of saline. Imaging parameters were as follows: TR/TE, 1500/30 ms; section thickness, 4 mm; voxel size, 1.6 × 1.2 × 4 mm; matrix, 152 × 202; acquisition time, 1 minute 23 seconds. Fifty measurements were obtained, with the injection occurring at the third image. Postprocessing (syngo.MR Neuro Perfusion Engine; Siemens) generated relative CBF (rCBF) and relative CBV (rCBV) maps. The arterial input function was selected in the middle cerebral artery in the hemisphere opposite to the bAVM.

Quantitative ASL perfusion was performed with a recently described vessel-encoded pseudocontinuous ASL sequence,19,20 allowing encoding of the selected arteries (right/left internal carotid artery, right/left vertebral artery) within the labeling plane on 3D-TOF-MRA and hence providing artery-specific absolute CBF maps. For subsequent vessel-encoded pseudocontinuous ASL acquisitions, 8 paired encoding cycles were obtained as previously described.19⇓⇓–22

The total CBF map was calculated by summing the CBF maps from each artery. A single arrival-time (ASL-arrival time) map, representing the time required for the blood to travel from the neck to the brain tissue, was calculated by summing the arrival-time maps from each artery, weighted by the relative CBF contributed by that artery.

Data Postprocessing and Analysis

After converting the FPD-CT, DSC-MR imaging, ASL-MR imaging, and T1WI contrast-enhanced DICOM data into NIfTI files (FSL, www.fmrib.ox.ac.uk/fsl), we extracted the brain parenchyma by using the FSL Brain Extraction Tool (http://fsl.fmrib.ox.ac.uk/fsl/fslwiki/BET). Each dataset was coregistered to the T1-weighted contrast-enhanced image. Six WM and 2 GM ROIs, which served as a reference, and corresponding contralateral mirror ROIs were drawn as masks on the T1-weighted contrast-enhanced image:

Masks 1 and 2 (WM): perinidal (pn = 0.2–1 cm away from the nidus).

Masks 3 and 4 (WM): vicinity (1–3 cm away from the nidus).

Masks 5 and 6 (WM): remote (>3 cm away from the nidus).

Mask 7 (GM): putamen.

Mask 8 (GM): thalamus.

To minimize partial volume effects, we excluded tissue in the adjacent 2 mm from the bAVM (Fig 1).

Fig 1.
  • Download figure
  • Open in new tab
  • Download powerpoint
Fig 1.

Examples of the different WM (pn1/pn2, vic1/vic2, rem1/rem2) and GM masks (put, thal) selected on the T1WI contrast-enhanced sequence. Each mask has been labeled in either of the 2 hemispheres. The set of masks was loaded on each perfusion map separately, which had previously been coregistered to the T1WI contrast-enhanced dataset. Except for some of the GM masks, almost all masks were drawn as a volume, which explains their delineation on several consecutive sections. Note the different color for the respective mask in the contralateral hemisphere, because the software did not allow the use of the same color for the respective opposite mask. pn indicates perinidal; vic, vicinity; rem, remote; thal, thalamus; put, putamen.

The respective set of masks was overlaid onto each single perfusion map. The mean and SD of the masks were evaluated. The interhemispheric perfusion values (ratios) for each corresponding pair of masks were used for data analysis. Assessment of perfusion correlations among all modalities was performed by aggregating each corresponding mask of all patients and analyzed with the Pearson correlation coefficient (r). The correlation interpretation scheme was the following: none or weak (0.0–0.3), moderate (0.3–0.7), strong (0.7–0.9), and very strong (0.9–1).

Results

The resolution of the FPD-CT proved to be sufficient and artifact-free on visual assessment, and the masks drawn on T1-weighted contrast-enhanced imaging showed a good correspondence with the raw FPD-CT data (Fig 2). The perfusion distribution for all patients is shown in Fig 3.

Fig 2.
  • Download figure
  • Open in new tab
  • Download powerpoint
Fig 2.

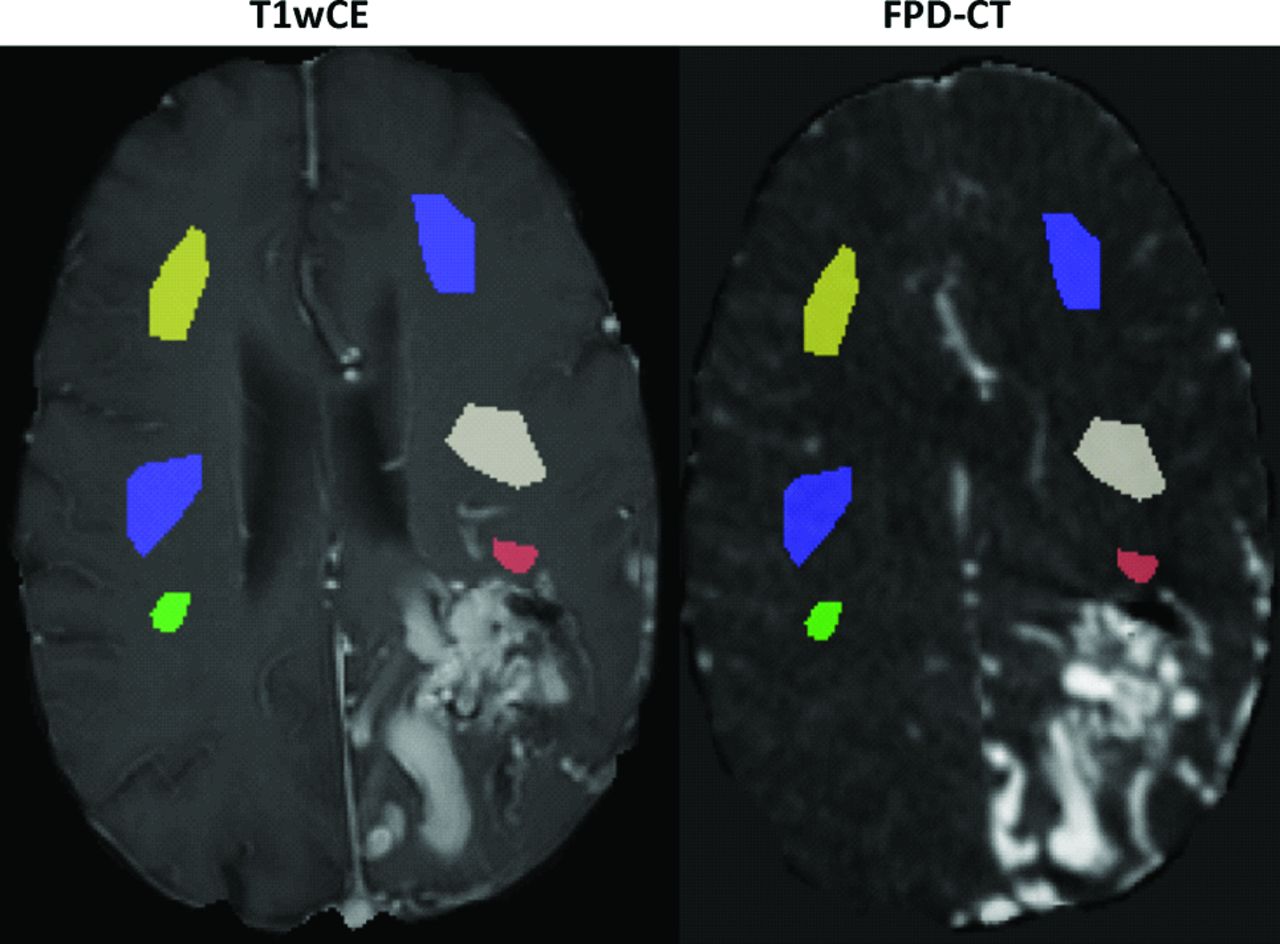
When superimposing the red mask representing the ipsilateral pn1 ROI previously drawn in the T1WI contrast-enhanced dataset (T1wCE; left) on the FPD-CT perfusion dataset (right), a good overlap without contamination from bAVM tissue could be observed.

Fig 3.
  • Download figure
  • Open in new tab
  • Download powerpoint
Fig 3.

Box-and-whisker plots for patients 1–4. The boxes show the median, lower, and upper quartiles. Outliers are displayed as red crosses. The mean and SD across the pixels of each ROI of patient 5 are represented in green. ref indicates reference.

Patients 1 to 4

The interhemispheric perfusion ratios for FPD-CT, ASL, and DSC were highest in the pn regions, with decreasing ratios with increasing distance from the bAVM. The putamen and the thalamus (reference), which were both remote from the glomerular bAVMs, showed similar values in both hemispheres, with interhemispheric ratios close to 1 (Fig 3).

Patient 5

The perfusion ratios of the proliferative bAVM (FPD-CT, ASL-CBF, and DSC-rCBF) showed a slightly increasing tendency from the perinidal to the remote brain tissue, with markedly less abrupt perfusion differences between the adjacent ROIs (Fig 3), whereas almost no changes between the different WM masks could be observed for DSC-rCBV.

In patient 5, the thalamus, which was included within the bAVM, showed a ratio below 1 for FPD-CT, DSC-rCBF, and ASL-CBF. The ratio of the putamen (not included in the bAVM) was markedly positive for FPD-CT, slightly positive for DSC-rCBF and around 1 for ASL-CBF and DSC-rCBV (data not shown).

Data Variability

When we aggregated all masks of patients 1–4 (excluding the only outlier, pn 1 of patient 3), variability of the perfusion data was by far higher for FPD-CT than for ASL. FPD-CT data variability was similar to that of DSC-rCBF and slightly higher than that obtained from DSC-rCBV (Table). When we compared the perfusion data of the pn masks only, perfusion data variability was lower for FPD-CT than for DSC.

View this table:
  • View inline
  • View popup

Coefficients of variation aggregating all masks, excluding the outlier (pn 1 of patient 3), across all patients

Correlations between and within Modalities

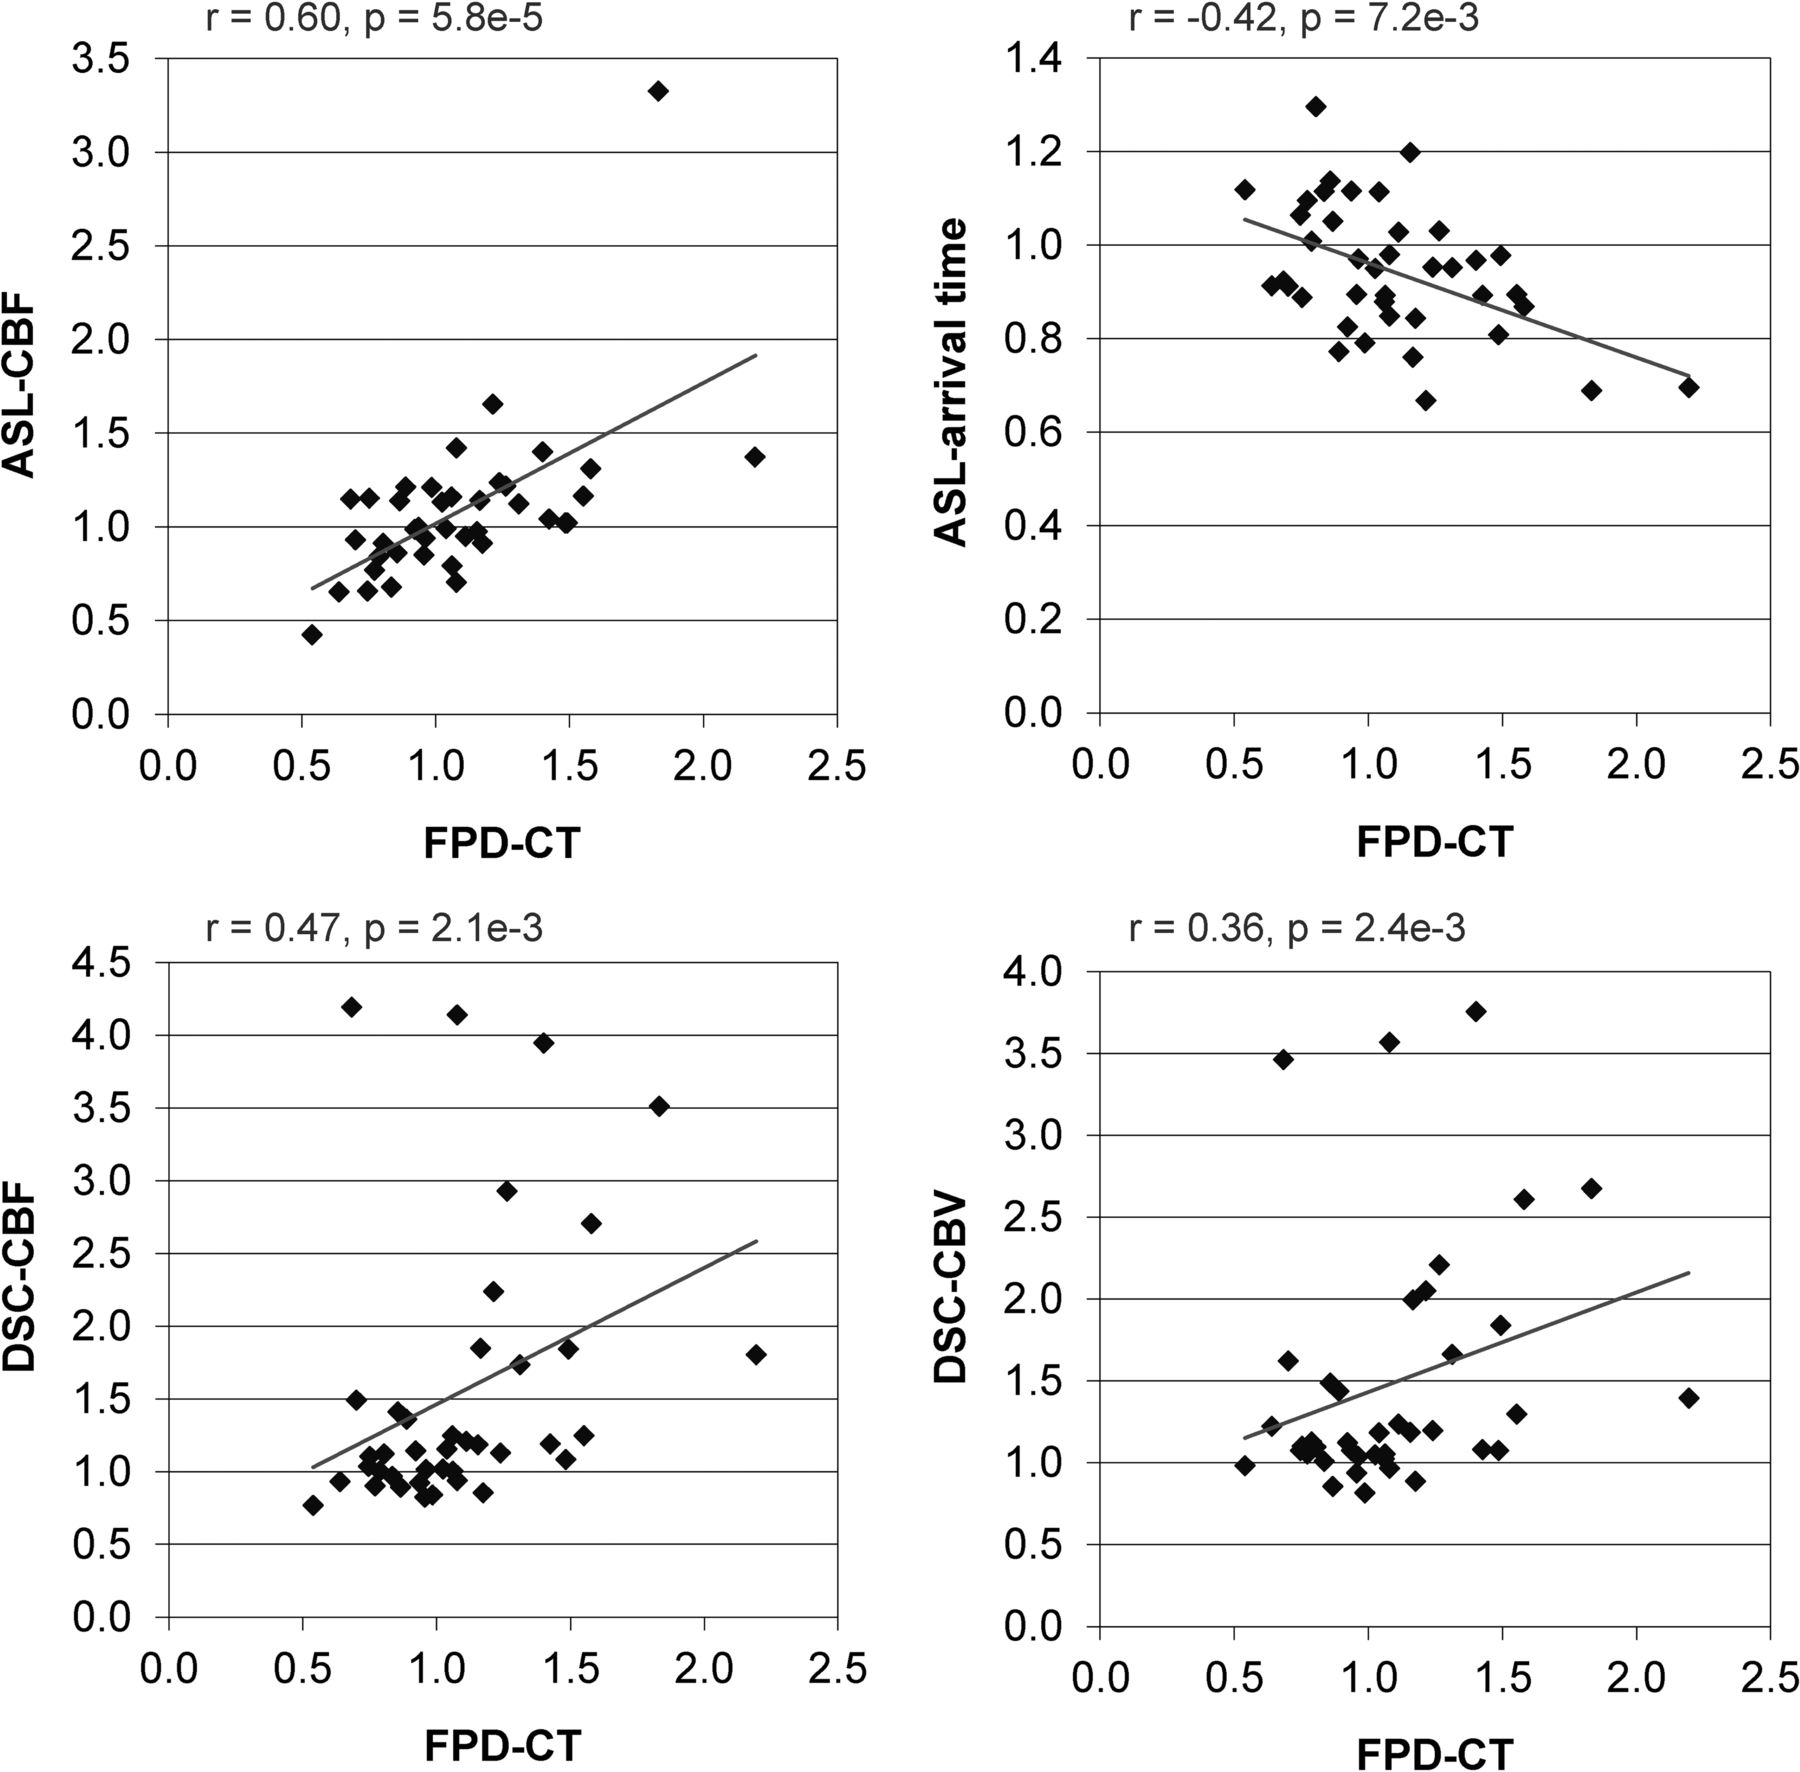
The highest correlation was observed between FPD-CT and ASL-CBF (r = 0.60), followed by a moderate correlation between FPD-CT and DSC-rCBF (r = 0.47). The correlation between FPD-CT and DSC-rCBV was weak (r = 0.36), and it was negative between FPD-CT and ASL-arrival time (r = −0.42) (Fig 4).

Fig 4.
  • Download figure
  • Open in new tab
  • Download powerpoint
Fig 4.

Correlations between different parameters for all patients. The squares represent the ratio for a single pair of masks.

Discussion

Imaging modalities assessing perfusion around bAVMs have provided different findings, which may be ascribed to the limitations of the techniques. The good correlation between parenchymal blood data from FPD-CT and CBV obtained from CTP has been demonstrated in ischemia.12⇓⇓–15 However, recently, it has been shown that in vasospasm, FPD-CT perfusion is both CBV- and CBF-weighted.17,18 Furthermore, parenchymal blood volume maps obtained from CTA source images23 have been reported to be either CBV- or CBF-weighted, depending on the order of CTA/CTP data acquisition.24

In this study, the glomerular bAVMs showed a perinidal hyperperfusion, with a tendency to normalization with increasing distance from the nidus. The perinidal hyperperfusion would, at first glance, disagree with the “vascular steal” theory. However, it is difficult to believe that a vascular steal is absent in the presence of a high-flow lesion. Probably, in these glomerular bAVMs, a certain amount of vascular steal was present but not apparent due to the ability of the brain to maintain CBF within a certain range of perfusion pressure.

In contrast, the regionally more extensive hypoperfusion in the proliferative bAVM suggests that the brain parenchyma may have already reached a chronic state of hypoperfusion, resembling cerebral proliferative angiopathy.25

ASL appeared to be superior to DSC-MR imaging and FPD-CT, showing the lowest data variability, in addition to its lack of need for contrast. A higher and similar variability was observed between FPD-CT and DSC-MR imaging, except in the pn ROI, where data variability was lower for FPD-CT, presumably due to magnetic susceptibility artifacts in the perinidal DSC data.

In the proliferative bAVM, in contrast to ASL-CBF, DSC-rCBV, and DSC-rCBF, the interhemispheric ratio for FPD-CT of the putamen, which was at some distance from the bAVM, showed a marked positive interhemispheric ratio. These divergent observations might be attributed to partial volume effects with FPD-CT, which, in the more remote tissue, might exceed the MR imaging artifacts, the latter being more pronounced next to the bAVMs. However, more studies with larger patient pools are required to explain this finding.

In contrast to FPD-CT studies performed on ischemia12⇓⇓–15 and on vasospasm17,18 in our study on bAVMs, perfusion correlated best with CBF. The strongest correlation was found with ASL-CBF. This observation is because the start of data collection is based on the visualization of the superior sagittal sinus, which may not reflect a “true” steady-state because the rapid transit of contrast through bAVMs may cause early filling of the superior sagittal sinus. This may result in data collection ahead of time, thus explaining the strong correlation of FPD-CT with CBF and the negative correlation with ASL-arrival time, because the FPD-CT signal will not have reached its maximum in brain regions where blood arrives later.

To date, no perfusion method can be regarded as a reference in bAVMs. Although our main aim was not to compare different perfusion techniques, all of the 3 methods investigated showed similar perfusion trends. Nevertheless, the obtained results cannot be extrapolated to other patient groups due to the unique hemodynamic properties of bAVMs. Therefore, it is not surprising that bAVMs show perfusion patterns different from those of other vascular pathologies of the brain.

A comparison of FPD-CT and CTP would also have been of interest. However, because in our institution patients with bAVMs are not routinely investigated with CTP, the additional radiation would not have been justified. Furthermore, for the additional assessment of ASL-MR imaging, DSC-MR imaging seemed a more appropriate reference though we are aware that DSC-MR imaging is not the optimal perfusion reference, either.

Perfusion data obtained with FPD-CT appears to comprise a variable contribution from flow and volume, depending on the type of vascular lesion and the trigger time point chosen for data collection.26 In bAVMs, FPD-CT correlated best with CBF-assessed MR imaging, and the different perfusion patterns between bAVM subtypes might be attributed to differences in the angioarchitecture. To accurately calculate either CBF or CBV with FPD-CT is very challenging in high-flow lesions. In addition to the heterogeneous characteristics of bAVMs and the high data variability, FPD-CT is not appropriate for an acceptable perfusion assessment in bAVMs.

Footnotes

  • Disclosures: Tom W. Okell—UNRELATED: Grant: The Royal Academy of Engineering and the Dunhill Medical Trust, Comments: These funding bodies provided grants for my research position, which enabled me to undertake the work described in this article*; Royalties: Siemens, Comments: royalties received for an exclusive license to a pending US patent relating to the maximum a posteriori Bayesian vessel-encoding analysis technique used in this study. Michael A. Chappell—UNRELATED: Patents (Planned, Pending, or Issued): Siemens, Comments: Principal Investigator relating to vessel-encoded ASL MRI data analysis; Royalties: FSL, Comments: commercial licensing of the FMRIB Software Library for fMRI data analysis. Peter Jezzard—UNRELATED: Patents (Planned, Pending, or Issued): Siemens, Comments: Patent application on data analysis, licensed to Siemens. Oliver Bieri—UNRELATED: Grants/Grants Pending: Siemens,* Comments: I receive research support from Siemens Healthineers (formerly Siemens). James V. Byrne—UNRELATED: Provision of Writing Assistance, Medicines, Equipment, or Administrative Support: Siemens, Comments: loan to department of analysis software and computer by Siemens. *Money paid to the institution.

  • Thomas W. Okell and Michael A. Chappell are authors of a pending US patent licensed to Siemens (Erlangen, Germany) relating to the maximum a posteriori (MAP) processing technique used in this study. The royalties went to the coauthors (T.W.O. and M.A.C.).

REFERENCES

  1. 1.↵
    1. Taylor CL,
    2. Selman WR,
    3. Ratcheson RA
    . Steal affecting the central nervous system. Neurosurgery 2002;50:679–88; discussion 688–89 doi:10.1097/00006123-200204000-00002 pmid:11904017
    CrossRefPubMed
  2. 2.↵
    1. Van Roost D,
    2. Schramm J
    . What factors are related to impairment of cerebrovascular reserve before and after arteriovenous malformation resection? A cerebral blood flow study using xenon-enhanced computed tomography. Neurosurgery 2001;48:709–16; discussion 716–17 pmid:11322430
    CrossRefPubMed
  3. 3.↵
    1. Young WL,
    2. Pile-Spellman J,
    3. Prohovnik I, et al
    . Evidence for adaptive autoregulatory displacement in hypotensive cortical territories adjacent to arteriovenous malformations: Columbia University AVM Study Project. Neurosurgery 1994;34:601–10; discussion 610–11 doi:10.1227/00006123-199404000-00006 pmid:8008157
    CrossRefPubMed
  4. 4.↵
    1. Kim DJ,
    2. Krings T
    . Whole-brain perfusion CT patterns of brain arteriovenous malformations: a pilot study in 18 patients. AJNR Am J Neuroradiol 2011;32:2061–66 doi:10.3174/ajnr.A2659 pmid:21885720
    Abstract/FREE Full Text
  5. 5.↵
    1. Fink GR
    . Effects of cerebral angiomas on perifocal and remote tissue: a multivariate positron emission tomography study. Stroke 1992;23:1099–105 doi:10.1161/01.STR.23.8.1099 pmid:1636185
    Abstract/FREE Full Text
  6. 6.↵
    1. Tyler JL,
    2. Leblanc R,
    3. Meyer E, et al
    . Hemodynamic and metabolic effects of cerebral arteriovenous malformations studied by positron emission tomography. Stroke 1989;20:890–98 doi:10.1161/01.STR.20.7.890 pmid:2787547
    Abstract/FREE Full Text
  7. 7.↵
    1. Ueda M,
    2. Kamiya T,
    3. Sakamoto S, et al
    . Abnormally distributed regional cerebral blood flow in brain malformations detected by single photon emission computed tomography [in Japanese]. Rinsho Shinkeigaku 1997;37:99–105 pmid:9164139
    PubMed
  8. 8.↵
    1. Guo WY,
    2. Wu YT,
    3. Wu HM, et al
    . Toward normal perfusion after radiosurgery: perfusion MR imaging with independent component analysis of brain arteriovenous malformations. AJNR Am J Neuroradiol 2004;25:1636–44 pmid:15569724
    Abstract/FREE Full Text
  9. 9.↵
    1. Fiehler J,
    2. Illies T,
    3. Piening M, et al
    . Territorial and microvascular perfusion impairment in brain arteriovenous malformations. AJNR Am J Neuroradiol 2009;30:356–61 doi:10.3174/ajnr.A1351 pmid:19001537
    Abstract/FREE Full Text
  10. 10.↵
    1. Wolf RL,
    2. Wang J,
    3. Detre JA, et al
    . Arteriovenous shunt visualization in arteriovenous malformations with arterial spin-labeling MR imaging. AJNR Am J Neuroradiol 2008;29:681–87 doi:10.3174/ajnr.A0901 pmid:18397967
    Abstract/FREE Full Text
  11. 11.↵
    1. Kamran M,
    2. Nagaraja S,
    3. Byrne JV
    . C-arm flat detector computed tomography: the technique and its application in interventional neuro-radiology. Neuroradiology 2010;52:319–27 doi:10.1007/s00234-009-0609-5 pmid:19859702
    CrossRefPubMed
  12. 12.↵
    1. Mordasini P,
    2. El-Koussy M,
    3. Brekenfeld C, et al
    . Applicability of tableside flat panel detector CT parenchymal cerebral blood volume measurement in neurovascular interventions: preliminary clinical experience. AJNR Am J Neuroradiol 2012;33:154–58 doi:10.3174/ajnr.A2715 pmid:21960501
    Abstract/FREE Full Text
  13. 13.↵
    1. Struffert T,
    2. Deuerling-Zheng Y,
    3. Kloska S, et al
    . Cerebral blood volume imaging by flat detector computed tomography in comparison to conventional multislice perfusion CT. Eur Radiol 2011;21:882–89 doi:10.1007/s00330-010-1957-6 pmid:20857117
    CrossRefPubMed
  14. 14.↵
    1. Struffert T,
    2. Deuerling-Zheng Y,
    3. Engelhorn T, et al
    . Feasibility of cerebral blood volume mapping by flat panel detector CT in the angiography suite: first experience in patients with acute middle cerebral artery occlusions. AJNR Am J Neuroradiol 2012;33:618–25 doi:10.3174/ajnr.A2839 pmid:22207301
    Abstract/FREE Full Text
  15. 15.↵
    1. Blanc R,
    2. Pistocchi S,
    3. Babic D, et al
    . Intravenous flat-detector CT angiography in acute ischemic stroke management. Neuroradiology 2012;54:383–91 doi:10.1007/s00234-011-0893-8 pmid:21625990
    CrossRefPubMed
  16. 16.↵
    1. Fiorella D,
    2. Turk A,
    3. Chaudry I, et al
    . A prospective, multicenter pilot study investigating the utility of flat detector derived parenchymal blood volume maps to estimate cerebral blood volume in stroke patients. J Neurointerv Surg 2014;6:451–56 doi:10.1136/neurintsurg-2013-010840 pmid:23943817
    Abstract/FREE Full Text
  17. 17.↵
    1. Kamran M,
    2. Downer J,
    3. Corkill R, et al
    . Non-invasive assessment of vasospasm following aneurysmal SAH using C-arm FDCT parenchymal blood volume measurement in the neuro-interventional suite: technical feasibility. Interv Neuroradiol 2015;21:479–89 doi:10.1177/1591019915582376 pmid:26017197
    CrossRefPubMed
  18. 18.↵
    1. Kamran M,
    2. Byrne JV
    . C-arm flat detector computed tomography parenchymal blood volume imaging: the nature of parenchymal blood volume parameter and the feasibility of parenchymal blood volume imaging in aneurysmal subarachnoid haemorrhage patients. Neuradiology 2015;57:937–49 doi:10.1007/s00234-015-1545-1 pmid:26022353
    CrossRefPubMed
  19. 19.↵
    1. Okell TW,
    2. Chappell MA,
    3. Kelly ME, et al
    . Cerebral blood flow quantification using vessel-encoded arterial spin labeling. J Cereb Blood Flow Metab 2013;33:1716–24 doi:10.1038/jcbfm.2013.129 pmid:23921895
    CrossRefPubMed
  20. 20.↵
    1. Wong EC
    . Vessel-encoded arterial spin-labeling using pseudocontinuous tagging. Magn Reson Med 2007;58:1086–91 doi:10.1002/mrm.21293 pmid:17969084
    CrossRefPubMed
  21. 21.↵
    1. Chappell MA,
    2. Okell TW,
    3. Jezzard P, et al
    . Vascular territory image analysis using vessel encoded arterial spin labeling. Med Image Comput Comput Assist Interv 2009;12(pt 2):514–21 pmid:20426151
    PubMed
  22. 22.↵
    1. Chappell MA,
    2. Okell TW,
    3. Payne SJ, et al
    . A fast analysis method for non-invasive imaging of blood flow in individual cerebral arteries using vessel-encoded arterial spin labelling angiography. Med Image Anal 2012;16:831–39 doi:10.1016/j.media.2011.12.004 pmid:22322066
    CrossRefPubMed
  23. 23.↵
    1. Sharma M,
    2. Fox AJ,
    3. Symons S, et al
    . CT angiographic source images: flow- or volume-weighted? AJNR Am J Neuroradiol 2011;32:359–64 doi:10.3174/ajnr.A2282 pmid:21051518
    Abstract/FREE Full Text
  24. 24.↵
    1. Dorn F,
    2. Liebig T,
    3. Muenzel D, et al
    . Order of CT stroke protocol (CTA before or after CTP): impact on image quality. Neuroradiology 2012;54:105–12 doi:10.1007/s00234-011-0840-8 pmid:21344216
    CrossRefPubMed
  25. 25.↵
    1. Fierstra J,
    2. Spieth S,
    3. Tran L, et al
    . Severely impaired cerebrovascular reserve in patients with cerebral proliferative angiopathy. J Neurosurg Pediatr 2011;8:310–15 doi:10.3171/2011.6.PEDS1170 pmid:21882924
    CrossRefPubMed
  26. 26.↵
    1. Kloska SP
    . CT angiography source images with modern multisection CT scanners: attention to technical principles is crucial. Cerebrovasc Dis 2011;32:94 doi:10.1159/000327042 pmid:21709405
    CrossRefPubMed
  • Received August 28, 2016.
  • Accepted after revision December 1, 2016.
  • © 2017 by American Journal of Neuroradiology
View Abstract
PreviousNext
Back to top

In this issue

American Journal of Neuroradiology: 38 (4)
American Journal of Neuroradiology
Vol. 38, Issue 4
1 Apr 2017
  • Table of Contents
  • Index by author
  • Complete Issue (PDF)
Advertisement
Print
Download PDF
Email Article

Thank you for your interest in spreading the word on American Journal of Neuroradiology.

NOTE: We only request your email address so that the person you are recommending the page to knows that you wanted them to see it, and that it is not junk mail. We do not capture any email address.

Enter multiple addresses on separate lines or separate them with commas.
Feasibility of Flat Panel Detector CT in Perfusion Assessment of Brain Arteriovenous Malformations: Initial Clinical Experience
(Your Name) has sent you a message from American Journal of Neuroradiology
(Your Name) thought you would like to see the American Journal of Neuroradiology web site.
CAPTCHA
This question is for testing whether or not you are a human visitor and to prevent automated spam submissions.
Cite this article
M. Garcia, T.W. Okell, M. Gloor, M.A. Chappell, P. Jezzard, O. Bieri, J.V. Byrne
Feasibility of Flat Panel Detector CT in Perfusion Assessment of Brain Arteriovenous Malformations: Initial Clinical Experience
American Journal of Neuroradiology Apr 2017, 38 (4) 735-739; DOI: 10.3174/ajnr.A5091

Citation Manager Formats

  • BibTeX
  • Bookends
  • EasyBib
  • EndNote (tagged)
  • EndNote 8 (xml)
  • Medlars
  • Mendeley
  • Papers
  • RefWorks Tagged
  • Ref Manager
  • RIS
  • Zotero
0 Responses
Respond to this article
Share
Bookmark this article
Feasibility of Flat Panel Detector CT in Perfusion Assessment of Brain Arteriovenous Malformations: Initial Clinical Experience
M. Garcia, T.W. Okell, M. Gloor, M.A. Chappell, P. Jezzard, O. Bieri, J.V. Byrne
American Journal of Neuroradiology Apr 2017, 38 (4) 735-739; DOI: 10.3174/ajnr.A5091
del.icio.us logo Twitter logo Facebook logo Mendeley logo
  • Tweet Widget
  • Facebook Like
  • Google Plus One
Purchase

Jump to section

  • Article
    • Abstract
    • ABBREVIATIONS:
    • Materials and Methods
    • Results
    • Discussion
    • Footnotes
    • REFERENCES
  • Figures & Data
  • Info & Metrics
  • Responses
  • References
  • PDF

Related Articles

  • No related articles found.
  • PubMed
  • Google Scholar

Cited By...

  • One-Stop Management with Perfusion for Transfer Patients with Stroke due to a Large-Vessel Occlusion: Feasibility and Effects on In-Hospital Times
  • Crossref (4)
  • Google Scholar

This article has been cited by the following articles in journals that are participating in Crossref Cited-by Linking.

  • One-Stop Management with Perfusion for Transfer Patients with Stroke due to a Large-Vessel Occlusion: Feasibility and Effects on In-Hospital Times
    A. Brehm, I. Tsogkas, I.L. Maier, H.J. Eisenberger, P. Yang, J.-M. Liu, J. Liman, M.-N. Psychogios
    American Journal of Neuroradiology 2019 40 8
  • Diagnostic accuracy of flat-panel computed tomography in assessing cerebral perfusion in comparison with perfusion computed tomography and perfusion magnetic resonance: a systematic review
    Ernst L. Stille, Ilaria Viozzi, Mark ter Laan, Frederick J.A. Meijer, Jurgen J. Futterer, Maroeska M. Rovers
    Neuroradiology 2019 61 12
  • Flat Detector CT with Cerebral Pooled Blood Volume Perfusion in the Angiography Suite: From Diagnostics to Treatment Monitoring
    Thijs van der Zijden, Annelies Mondelaers, Maurits Voormolen, Tomas Menovsky, Maarten Niekel, Thomas Jardinet, Thomas Van Thielen, Olivier D’Archambeau, Paul Parizel
    Diagnostics 2022 12 8
  • Usefulness of Flat Detector Computed Tomography Perfusion for Neuroendovascular Therapies
    Keiichiro MAEDA, Takashi OCHI, Yoshiaki GOTO, Shohei NANBU, Kei ARISAWA
    Surgery for Cerebral Stroke 2018 46 4

More in this TOC Section

  • SAVE vs. Solumbra Techniques for Thrombectomy
  • Contrast-Induced Encephalopathy after NeuroIR
  • CT Perfusion&Reperfusion in Acute Ischemic Stroke
Show more Interventional

Similar Articles

Advertisement

Indexed Content

  • Current Issue
  • Accepted Manuscripts
  • Article Preview
  • Past Issues
  • Editorials
  • Editor's Choice
  • Fellows' Journal Club
  • Letters to the Editor
  • Video Articles

Cases

  • Case Collection
  • Archive - Case of the Week
  • Archive - Case of the Month
  • Archive - Classic Case

Special Collections

  • AJNR Awards
  • ASNR Foundation Special Collection
  • Most Impactful AJNR Articles
  • Photon-Counting CT
  • Spinal CSF Leak Articles (Jan 2020-June 2024)

More from AJNR

  • Trainee Corner
  • Imaging Protocols
  • MRI Safety Corner

Multimedia

  • AJNR Podcasts
  • AJNR Scantastics

Resources

  • Turnaround Time
  • Submit a Manuscript
  • Submit a Video Article
  • Submit an eLetter to the Editor/Response
  • Manuscript Submission Guidelines
  • Statistical Tips
  • Fast Publishing of Accepted Manuscripts
  • Graphical Abstract Preparation
  • Imaging Protocol Submission
  • Evidence-Based Medicine Level Guide
  • Publishing Checklists
  • Author Policies
  • Become a Reviewer/Academy of Reviewers
  • News and Updates

About Us

  • About AJNR
  • Editorial Board
  • Editorial Board Alumni
  • Alerts
  • Permissions
  • Not an AJNR Subscriber? Join Now
  • Advertise with Us
  • Librarian Resources
  • Feedback
  • Terms and Conditions
  • AJNR Editorial Board Alumni

American Society of Neuroradiology

  • Not an ASNR Member? Join Now

© 2025 by the American Society of Neuroradiology All rights, including for text and data mining, AI training, and similar technologies, are reserved.
Print ISSN: 0195-6108 Online ISSN: 1936-959X

Powered by HighWire