
Abstract
BACKGROUND AND PURPOSE: Leksell stereotactic radiosurgery is an effective option for patients with vestibular schwannomas. Some centers use a combination of stereotactic CT fused with stereotactic MR imaging to achieve an optimal target definition as well as minimize the radiation dose delivered to adjacent structures that correlate with hearing outcomes. The present prospective study was designed to determine whether there is cochlear dose variability between MR imaging and CT.
MATERIALS AND METHODS: Fifty consecutive patients underwent stereotactic radiosurgery for vestibular schwannomas. Dose-planning was performed using high-definition fused stereotactic MR imaging and stereotactic CT images. The 3D cochlear volume was determined by delineating the cochlea on both CT and T2-weighted MR imaging. The mean radiation dose, maximum dose, and 3- and 4.20-Gy cochlear volumes were identified using standard Leksell Gamma Knife software.
RESULTS: The median mean radiation dose delivered to the cochlea was 3.50 Gy (range, 1.20–6.80 Gy) on CT and 3.40 Gy (range, 1–6.70 Gy) on MR imaging (concordance correlation coefficient = 0.86, r2 = 0.9, P ≤ .001). The median maximum dose delivered to the cochlea was 6.7 Gy on CT and 6.6 Gy on MR imaging (concordance correlation coefficient = 0.89, r2 = 0.90, P ≤ .001). Dose-volume histograms generated from CT and MR imaging demonstrated a strong level of correlation in estimating the 3- and 4.20-Gy volumes (concordance correlation coefficient = 0.81, r2 = 0.82, P ≤ .001 and concordance correlation coefficient = 0.87, r2 = 0.89, P ≤ .001).
CONCLUSIONS: Both MR imaging and CT provide similar cochlear dose parameters. Despite the reported superiority of CT in identifying bony structures, high-definition MR imaging alone is sufficient to identify the radiation doses delivered to the cochlea.
ABBREVIATIONS:
- CCC
- concordance correlation coefficient
- SRS
- stereotactic radiosurgery
- VS
- vestibular schwannomas
Vestibular schwannomas (VS), also known as acoustic neuromas, are benign tumors that most commonly arise from the vestibular portion of cranial nerve VIII, the vestibulocochlear nerve. The most common presenting symptoms of VS are hearing loss, tinnitus, and imbalance.1 Depending on the presentation, the options currently available for the management of this tumor include observation with serial imaging, surgical resection, and radiosurgery. Leksell gamma knife stereotactic radiosurgery (SRS) (Elekta Instruments, Stockholm, Sweden) is a widely accepted treatment technique for VS.2⇓–4 SRS involves delivering highly focused radiation to the 3D tumor volume in a single session, with rapid radiation fall-off in the structures surrounding the tumor target. The aim of SRS is tumor control with minimal collateral damage to adjacent cranial nerve and brain stem structures. Multiple reports demonstrate successful long-term SRS outcomes.5,6
Factors such as patient age at the time of SRS, hearing status before the procedure, tumor size, the interval between diagnosis and treatment, and cochlear radiation dose have been found to influence hearing preservation rates.6⇓⇓–9 Cochlear dose remains the only variable that can be modified during treatment planning to improve hearing-preservation rates.
The use of MR imaging for dose-planning in SRS for VS has been shown to be safe and efficient.10 However, the concern that MR imaging accuracy may be affected by magnetic susceptibility issues has led many centers to use both stereotactic CT and stereotactic MR imaging to achieve a more accurate target as well as cochlear definition.11⇓–13 Whether bone window CT provides superior resolution of the cochlea compared with high-definition T2 MR imaging is not known.14,15
In this study, we compared the definition of the cochlear volume determined by MR imaging with the cochlear volume defined by CT to detect whether any variance in the radiation dose delivered to the cochlea was detectable.
Materials and Methods
Patient Population
Between May 2016 and October 2017, fifty consecutive patients with VS underwent MR imaging and CT-guided SRS at the University of Pittsburgh Medical Center. There were 26 men and 24 women with a median age of 60 years (range, 28–77 years) at the time of SRS. The most common presentation was unilateral hearing loss (94%). The median duration of symptoms before SRS was 18 months. The median speech discrimination score and pure-tone average at the time of SRS were 64% and 37 dB, respectively. Hearing level was classified as Gardner Robertson grades I and II in 32 patients (64%). SRS was the primary management in 46 patients (92%). Three patients had SRS for residual tumor after surgery, and 1 patient, for recurrent tumor after prior SRS.
Radiosurgery Technique
Radiosurgery was performed using the Perfexion or ICON gamma knife models (Elekta). Our radiosurgical technique has been previously described.16 The procedure begins by applying the Leksell stereotactic skull frame (Elekta) with the patient under conscious intravenous sedation and local anesthesia. After attachment of the fiducial system, patients undergo a high-resolution 3D spoiled gradient-recalled-acquisition axial MR imaging (slice thickness = 1 mm, TE/TR = 4/16.7 ms, flip angle = 20°, FOV = 250 mm/100%, matrix = 256 × 256) after administration of IV contrast. Both 1-mm axial fast spin-echo T2-weighted MR images through the internal auditory canal and 3-mm T2 axial whole-head images are acquired to evaluate tumor extent and inner ear structures. Additionally, to better define the bony canal of the internal acoustic meatus, stereotactic non-contrast-enhanced spiral CT is performed (120 kV, 185 mA, full helical current, slice thickness = 1.25 mm, display FOV = 300 mm, matrix = 512 × 512). All imaging is obtained in stereotactic conditions using the appropriate fiducial box for either MR imaging or CT.
Dose-planning was performed using the high-definition stereotactic MR imaging axial plane T2 volume 1-mm images and was refined using the stereotactic 1.25-mm axial plane bone window CT images. Cochlear volume was obtained by windowing and then tracing the volume of the cochlea on each axial plane image where it could be identified. Planning was by means of the standard Leksell Gamma Knife software. Volumetric stereotactic conformal planning of the tumor volume was completed by the responsible neurosurgeon. A single radiation oncologist performed tumor, cochlea, trigeminal nerve, and brain stem delineation independently on the CT and MR images. The cochlear volumes were independently drawn as well by the responsible neurosurgeon. Ultimately the CT and MR images were fused using the Leksell GammaPlan software (Electa) to optimize the final treatment plan. Selective sector beam-blocking (generally 1 sector of 28 beams) was used to limit the radiation dose to the brain stem, the trigeminal nerve, and the cochlea. 3D volumes of the cochlea were generated from the available CT and T2 images, and the mean and maximum doses were obtained for each patient. Additionally, the cochlear volume receiving 3- and 4.2-Gy radiation doses was obtained using the dose-volume histogram generated by the software. After the treating neurosurgeon, radiation oncologist, and the medical physicist approved the treatment plan, the treatment began. The median gross tumor volume as determined by postgadolinium T1 MR imaging was 0.97 cm3 (range, 0.02–16.5 cm3). The median margin dose was 12 Gy (range, 11–12.50 Gy), and the median maximum dose was 24 Gy (range, 15.5–25 Gy). The median prescription isodose was 50% (range, 50%–70%). After the procedure, all patients were given 20- to 40-mg of IV methylprednisolone. All patients were discharged on the same day. Only 4-mm isocenters were used in the internal auditory canal.
Statistical Analysis
Continuous features were summarized using median and range. The Pearson r2 and the Lin concordance correlation coefficient (CCC) were used to assess the correlation of volumes and doses between the 2 imaging modalities. The CCC ranged between −1 and 1, with values indicating perfect negative or positive concordance, respectively. Statistical analysis was performed with SPSS Statistics 24 (IBM, Armonk, New York). A P value < .05 was set for statistical significance.
Results
Cochlear Dose Parameters
The median cochlear volume identified by CT was 36.8 mm3 (range, 4.90–77 mm3). The median cochlear volume as identified on T2-weighted MR imaging was 41 mm3 (range, 4.90–70 mm3). On the basis of CCC analysis, we found a poor correlation in cochlear volume between CT and MR imaging (CCC = 0.16, r2 = 0.17, P = .245) (Fig 1).

CCC plot comparing the cochlear volume as identified on CT and MR imaging. A CCC score of 0.16 indicates a poor correlation between the 2 imaging modalities in identifying cochlear volume.
The median of the average radiation dose delivered to the cochlea was 3.50 Gy (range, 1.20–6.80 Gy) on CT and 3.40 Gy (range, 1–6.70 Gy) on MR imaging (CCC = 0.86, r2 = 0.90, P ≤ .001) (Fig 2). The median maximum dose delivered to the cochlea was 6.70 Gy on CT and 6.60 Gy on MR imaging (CCC = 0.89, r2 = 0.90, P ≤ .001) (Fig 3). Based on CCC analysis, an almost perfect correlation was observed between CT and MR imaging in estimating the mean and maximum doses of radiation delivered to the cochlea.

CCC plot comparing the mean radiation dose delivered to the cochlea as identified on CT and MR imaging. A CCC score of 0.86 indicates an almost perfect relationship in identifying the mean cochlear dose between CT and MR imaging.

CCC plot comparing the maximum radiation dose delivered to the cochlea as identified on CT and MR imaging. A CCC score of 0.89 indicates an almost perfect relationship in identifying the mean cochlear dose between CT and MR imaging.
The median cochlear volume receiving a 3-Gy radiation dose as identified on CT was 25 mm3 (range, 0–47 mm3), and on MR imaging, it was 25 mm3 (range, 0–55.40 mm3). Dose-volume histograms generated from CT and MR imaging demonstrated an almost perfect level of correlation in estimating the cochlear volume receiving a 3-Gy radiation dose (CCC = 0.81, r2 = 0.82, P ≤ .001).
The median cochlear volume receiving a 4.2-Gy radiation dose as identified on CT was 12.7 mm3 (range, 0–63 mm3), and on MR imaging, it was 7.60 mm3 (range, 0–46 mm3). Based on CCC analysis, an almost perfect correlation was observed between CT and MR imaging in estimating the cochlear volume receiving a 4.2-Gy radiation dose (CCC = 0.87, r2 = 0.89, P ≤ .001) (Fig 4).
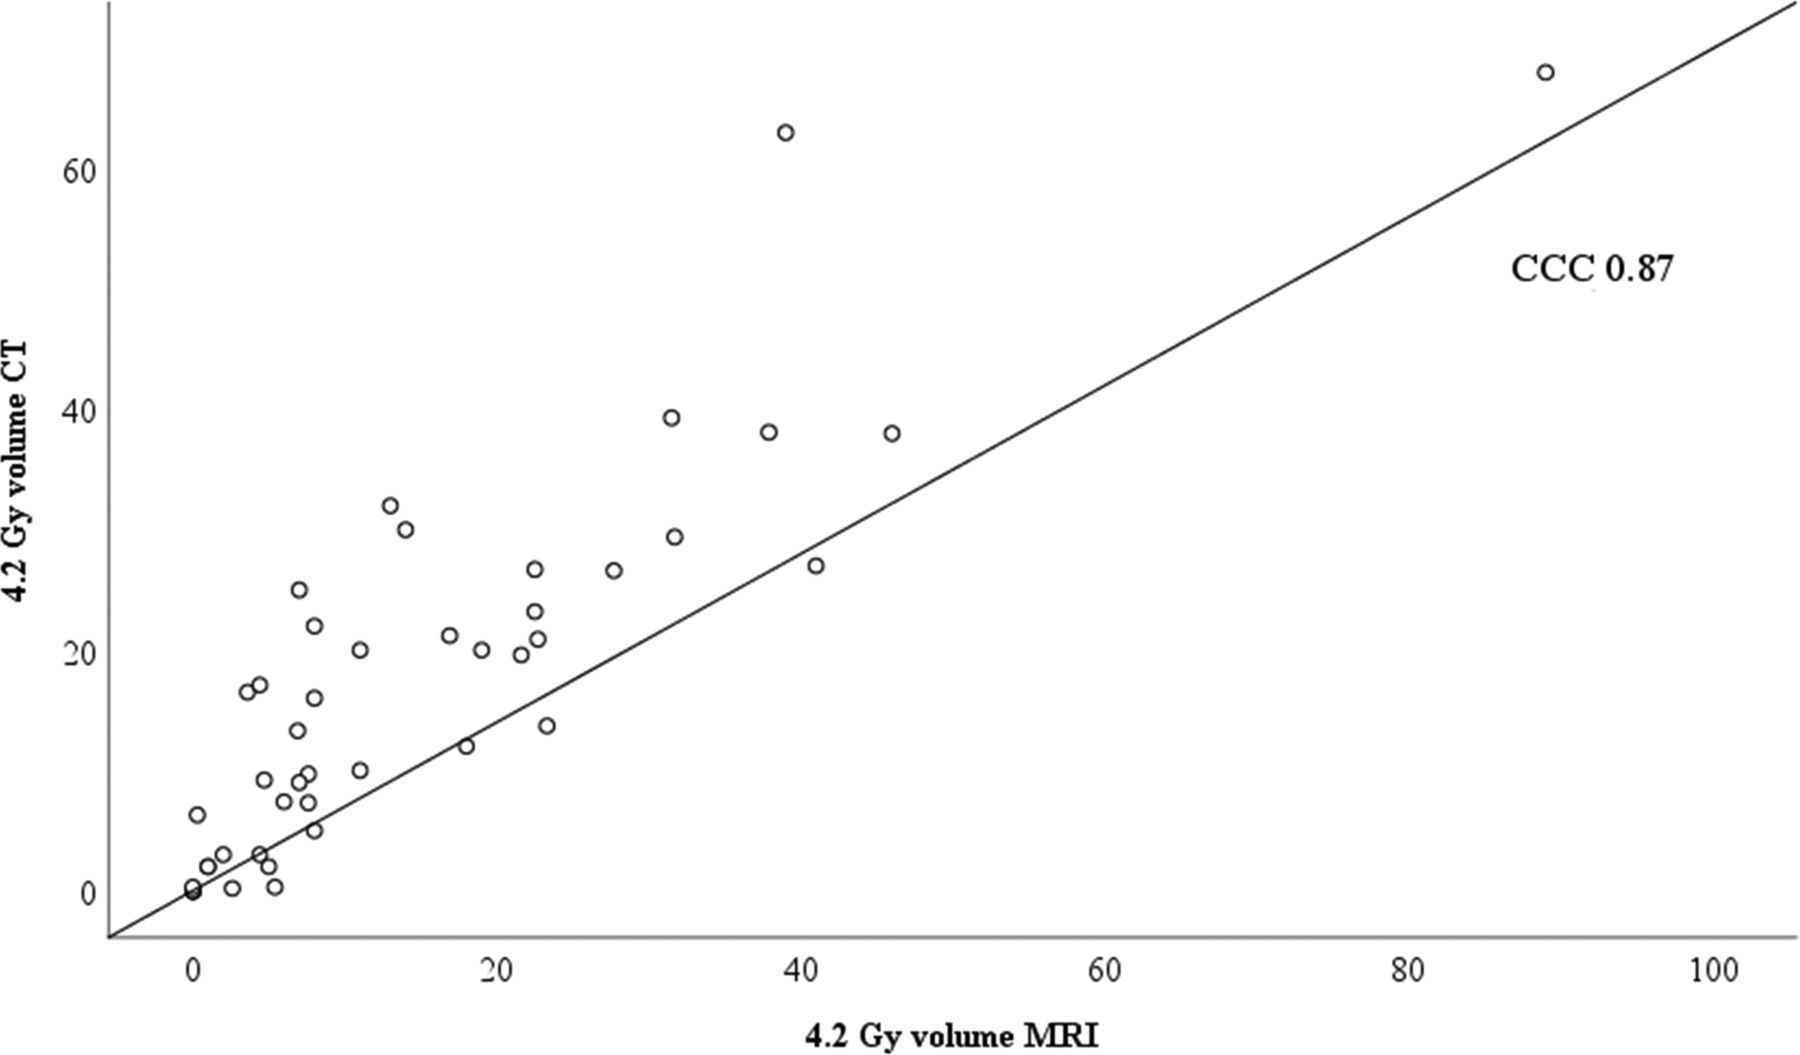
CCC plot comparing the volume of the cochlea receiving 4.2-Gy volume as identified on CT and MR imaging. A CCC score of 0.87 indicates an almost perfect correlation between CT and MR imaging in identifying the cochlear volume receiving 4.2 Gy.
Discussion
Prevention of further tumor growth and the preservation of cranial nerve function are the main goals of SRS management of VS. During the past several years, multiple factors have been found to influence hearing-preservation rates. These include the age of the patient, hearing status using scales such as the Gardner Robertson classification, length of the time between diagnosis and treatment, difference in the pure-tone average between the tumor and nontumor ear, and estimated length of the vestibulocochlear nerve.6,9,17,18 The correlation between cochlear dose and hearing preservation has been studied extensively. Multiple reports have demonstrated that a higher radiation dose to the cochlea is associated with a higher chance of hearing decline during long-term follow-up.19⇓–21 In a review of the outcomes of 53 patients who underwent SRS for the management of vestibular schwannomas, Brown et al8 found that patient age and the percentage of the cochlea that receives >5.30 Gy are the main predictors of hearing preservation. Kano et al18 found that patients who received an average cochlear dose of ≤4.20 Gy to the center of the cochlea had better hearing preservation rates.
Hearing preservation is an important consideration in patients undergoing management. Yang et al22 performed a literature review looking at the hearing-preservation rates in patients who underwent SRS for the management of VS. In their review, among 4234 patients with VS treated with SRS, there was a 51% chance of hearing preservation at pre–gamma knife levels at a mean follow-up of 3 years. Yomo et al23 retrospectively reviewed the outcomes of 154 patients who underwent SRS for the management of vestibular schwannomas. After a mean audiologic follow-up of 52 months post-SRS, a maximum cochlear dose of <4 Gy was found to be the sole prognostic factor for hearing preservation. Hasegawa et al24 reported hearing outcomes in 92 patients who underwent SRS for the management of vestibular schwannomas at a median follow-up of 83 months. They found that the mean cochlear radiation dose and pre-SRS pure-tone average were the main predictors of hearing preservation.
Both MR imaging and CT are commonly used in treatment planning. However, it is widely accepted that MR imaging is superior when it comes to identifying soft-tissue structures, whereas CT provides superior resolution of bony structures.14,25 Using CCC analysis, we found a poor correlation in cochlear volume identification between CT and MR imaging. This variance may also relate to the windowing level used to define the cochlea using both CT and MR imaging. Kulkarni et al25 performed a comparison of gross target volumes as delineated independently on contrast-enhanced CT and T1- and T2-weighted MR imaging in vestibular schwannomas. In their analysis, they found that cochlear volume as identified on T2 images was significantly larger (23.9 mm3) than the cochlear volume identified on CT (15 mm3). Jacob et al14 compared CT- and MR imaging–based modiolus point dose measurements and found a moderate level of correlation between CT and MR imaging in identifying the dose point of the cochlear modiolus. Treatment planning is performed after the fusion of CT and MR images. This may explain how, despite the significant difference in cochlear volumes between the 2 modalities, the dose delivered to the cochlea was found to be the same.
The importance of accurately identifying the mean and maximum doses received by the cochlea is related to the fact that multiple reports observed that the radiation dose of 3–5.3 Gy was associated with better preservation of hearing status.7,8,14,20,26 We found that both imaging modalities provide almost perfect values when determining the mean dose, maximum dose, and 3- and 4.20-Gy volumes.
The rationale for using multiple imaging modalities during radiosurgery is to enable the accurate delivery of a high radiation dose to the identified target, while, at the same time, sparing doses delivered to adjacent critical structures. Despite the previously reported advantage of CT in more accurately identifying the cochlea, we found that MR imaging provides similar dose-parameter estimates compared with CT.
During the 31 years that we have performed SRS using each of 6 models of the Leksell gamma knife, we have studied outcomes in 1956 patients. While age, hearing status, the interval between diagnosis and treatment, and tumor volume cannot be controlled by the surgeon, tumor margin and maximum doses and the dose delivered to the cochlea can be controlled. The finding that doses delivered to the cochlea as estimated by both CT and MR imaging in the same patient are not different indicates that we can eliminate the need for additional radiation delivered by spiral CT in patients with VS undergoing Leksell gamma knife SRS.
Weaknesses of the Present Study
The overall findings of this report may be limited by the small number of patients included in the analysis. In this study, both the responsible surgeon and the radiation oncologist independently found that the cochlear volume drawn by each had no impact on the dose delivered to the cochlea. Future studies may allow a more robust analysis of variance. Windowing of the cochlear volume by CT may influence the tracing of the cochlear volume in each axial slice. Variation in the slice thickness of CT (1.25 mm) and T2 volume MR imaging (1 mm) may also affect these results.
Conclusions
In this study, both CT and MR imaging provided similar cochlear dose parameters during Leksell radiosurgery for VS. Despite the differences in cochlear volume identified by either CT or MR imaging, the dose delivered to the cochlea in this study was not different. In patients undergoing Leksell gamma knife SRS for VS, high-definition MR imaging alone provides superior 3D tumor volume definition and a satisfactory depiction of cochlear volume.
Footnotes
Disclosures: Hideyuki Kano—UNRELATED: Comments: supported by Elekta AB. L. Dade Lunsford—UNRELATED: Consultancy: Insightec, Data and Safety Monitoring Board; Stock/Stock Options: Elekta AB.
References
- Received December 7, 2017.
- Accepted after revision July 1, 2018.
- © 2018 by American Journal of Neuroradiology


Jump to section
Related Articles
Cited By...
- No citing articles found.