
Abstract
BACKGROUND AND PURPOSE: The 2010 McDonald criteria are designed to sensitively detect MS; however, the low specificity of these criteria can occasionally lead to the misdiagnosis of MS. The purpose of this study was to determine whether a novel double inversion recovery MR imaging technique has the potential to increase the specificity of diagnostic criteria distinguishing MS from non-MS white matter lesions.
MATERIALS AND METHODS: This was a cross-sectional observational study. MR imaging data were acquired between 2011 and 2016. A novel double inversion recovery sequence that suppresses CSF and GM signal was used (GM-double inversion recovery). We compared WM lesions in a group of patients with multiple sclerosis and in a second group of positive controls with white matter lesions who did not have a diagnosis of MS. The presence of a rim on the GM-double inversion recovery MR imaging sequence was combined with the 2001 and 2010 McDonald disseminated-in-space criteria. Multiple MR imaging markers, including lesion location, size, and the presence of a rim, were compared between groups as well as a quantitative measure of lesion T1 hypointensity.
RESULTS: MR images from 107 patients with relapsing-remitting MS (median age, 32 years) and 36 positive control (median age, 39 years) subjects were analyzed. No significant differences were found in age and sex. In patients with MS, 1120/3211 lesions (35%) had a rim on GM-double inversion recovery; the positive control group had only 9/893 rim lesions (1%). Rims were associated with a decrease in the lesion T1 ratio. Using the 2010 MR imaging criteria plus the presence of rims on GM-double inversion recovery, we achieved 78% and 97% specificity in subjects with ≥1 and ≥2 rim lesions, respectively.
CONCLUSIONS: The addition of a novel GM-double inversion recovery technique enhanced specificity for diagnosing MS compared with established MR imaging criteria.
ABBREVIATIONS:
- DIR
- double inversion recovery
- DIS
- dissemination in space
- EDSS
- Expanded Disability Status Scale
- IQR
- interquartile range
- PC
- positive control
MR imaging has had a central role in the early diagnosis of multiple sclerosis. When applied in the appropriate clinical context, the McDonald criteria1 are able to sensitively detect MS, especially compared with the prior diagnostic criteria.2 The 2010 revisions to the McDonald criteria were intended to capture MS earlier, because studies revealed that early conversion from clinically isolated syndrome to MS could be predicted by simplification and additional weighting of the MR imaging criteria.3
Despite these well-validated diagnostic criteria, their specificity remains suboptimal, especially when the pretest probability is low: for example, when the clinical presentation is atypical, when radiologic criteria are inappropriately applied to scenarios in which the clinical presentation is inconsistent with clinically isolated syndrome, or in cases of radiologically isolated syndrome. This low specificity can lead to the potential misdiagnosis of MS, which has been identified as a significant clinical problem.4 A survey reported that misdiagnosis and subsequent treatment of MS had been seen in at least 1 case in the previous year by >90% of participating neurologists.4 Another recent study reviewed the spectrum of 110 possible cases of misdiagnosed MS.5
These studies found that a significant contributing factor to the misdiagnoses was overreliance on the interpretation of abnormal findings on MR imaging. MR imaging–based studies in patients presenting with abnormal findings on MRIs revealed that when 2001 and/or 2010 MR imaging dissemination-in-space (DIS) criteria were (perhaps inappropriately) applied, the specificity of these criteria was not as robust as the sensitivity.6,7 Therefore, while the diagnostic MR imaging criteria are helpful and sensitive, they were not designed to facilitate the differentiation of MS from other conditions, and specificity remains a significant concern in the clinic.
To address this problem, prior studies have added MR imaging sequences to conventional MR imaging protocols,8 including SWI, T2* imaging,9 and 7T field strength,10,11 yielding interesting sequences for future studies. Recently proposed revisions to the existing MRI criteria12 may further enhance diagnostic accuracy, still to be confirmed in larger studies. Despite these revisions, the clinical need for a reliable imaging marker specific for MS remains unmet.
In the current study, we applied a novel inversion recovery sequence (gray matter double inversion recovery [GM-DIR]) designed to suppress MR signal from both gray matter and CSF. This was used in conjunction with a clinical routine DIR, which suppresses white matter and CSF signal. We observed that white matter lesions in subjects with MS have dark rims on the GM-DIR. We specifically addressed the question of whether the presence of a “rim lesion” on GM-DIR can differentiate patients with MS from those without MS who have white matter lesions of other etiologies.
Materials and Methods
Subjects
After institutional review board approval, subjects seen at our MS center (Mayo Clinic, Rochester, Minnesota) were enrolled. All subjects provided written informed consent. The inclusion criteria for the MS subject cohort were patients of any age with relapsing-remitting MS, applying the 2010 McDonald criteria. Effort was made to recruit those with early MS, but disease duration was not used as an exclusion criterion. The inclusion criteria for the positive control (PC) subject cohort were the presence of T2 hyperintensities noted on an available routine clinical MR imaging scan and no clinical diagnosis of MS. To better match subjects with MS, we restricted positive controls with small-vessel disease to younger than 65 years of age. The exclusion criterion for both cohorts was the inability to obtain a nonsedated MR image.
Clinical Information
Patient characteristics at MR imaging were obtained by performing a comprehensive review of the medical record. PC subjects were identified via automated review of radiology reports and neurology clinics. Abstracted clinical information included the reason for performing the MR imaging, differential diagnostic considerations, and final diagnosis. In some cases, demyelinating disease remained in the differential diagnosis, but subjects did not meet the clinical criteria for MS. Therefore, we split the 2 positive control groups: 1) “definite” PCs, in which demyelinating disease was ruled out, and 2) “indeterminate” PCs, in which clinical, laboratory, or imaging findings suggested possible demyelinating disease, not fitting the MS criteria. After enrollment, 3 indeterminate subjects had converted to MS. However, for the analysis, they remained in the PC-indeterminate category (as opposed to reclassifying them as having MS).
MR Imaging Acquisition
Dedicated MR imaging research scans were prospectively acquired on either a 3T Discovery MR750 (8-channel head coil) (GE Healthcare, Milwaukee, Wisconsin) or a 3T Skyra scanner (32-channel head coil) (Siemens, Erlangen, Germany). Volumetric 1.0-mm isotropic-resolution sequences included GM-DIR, MPRAGE, and standard DIR (representative images are shown in Fig 1). Detailed sequence parameters are listed in On-line Table 1.
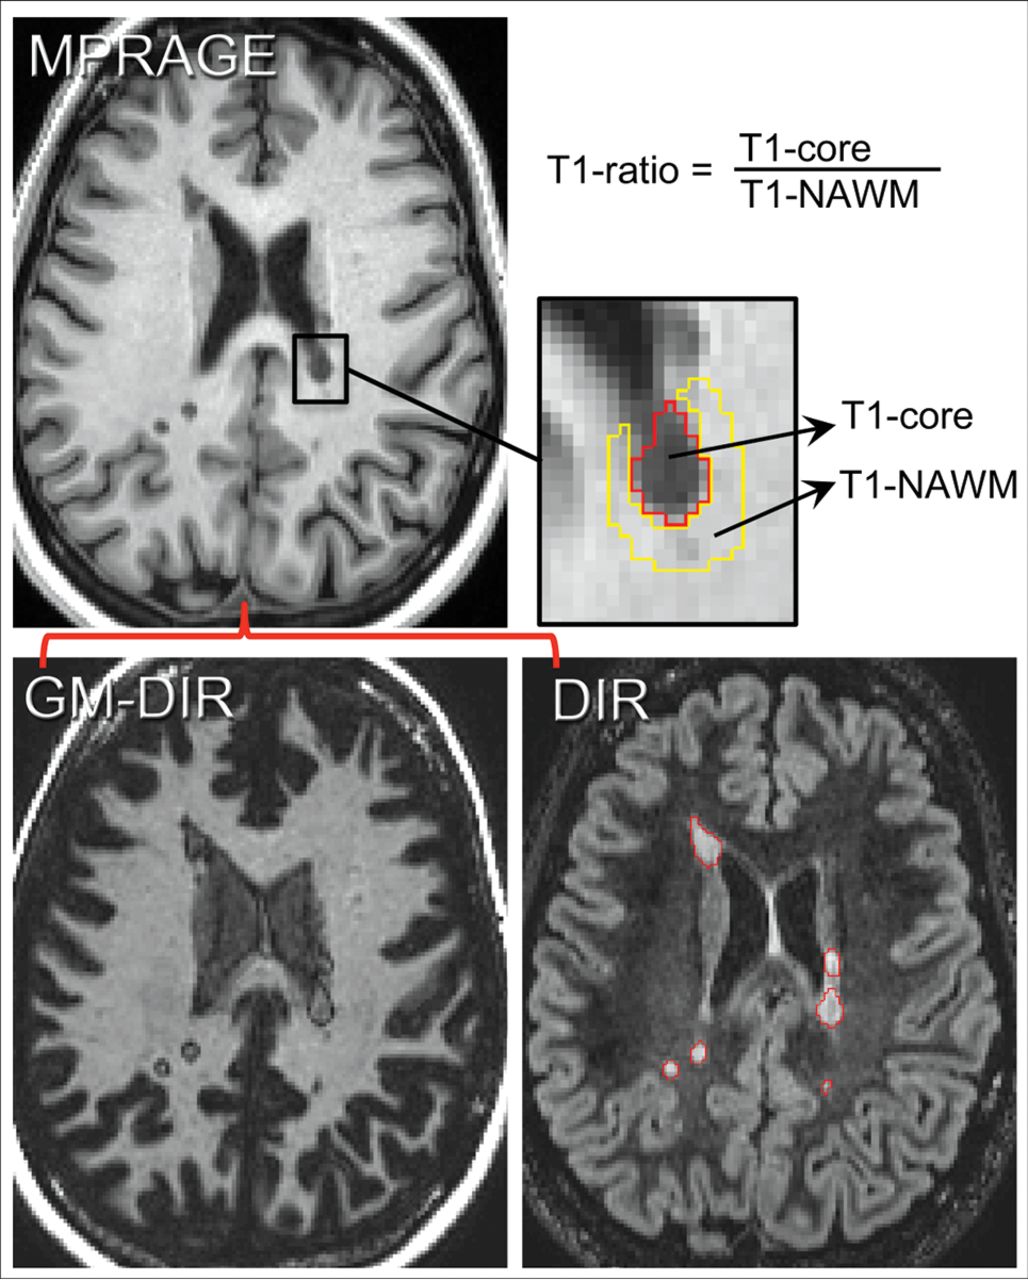
Method for determining the T1 ratio. First GM-DIR and DIR images are coregistered to the MPRAGE images. Next, lesions are manually segmented on DIR images (red lines surround individual lesions). The signal intensity within the lesion (T1 core) and outside of the lesion (T1 normal-appearing WM) is measured, and the T1 ratio is computed from those intensity values as shown.
MR Imaging Processing
All steps were completed using FreeSurfer (Version 5.3.0; http://surfer.nmr.mgh.harvard.edu),13,14 FSL (Version 5.0.8; http://www.fmrib.ox.ac.uk/fsl),15,16 and in-house-created lesion-scoring software. Processing steps included the following: 1) registration of standard DIR and GM-DIR images to MPRAGE (boundary-based registration),16 2) detecting and outlining white matter lesions on the T2-weighted standard DIR imaging, 3) obtaining quantitative lesion metrics from both DIR and T1-weighted MPRAGE imaging (volume, T1-signal change), and 4) scoring lesion characteristics (location and GM-DIR rim).
All lesions were detected and measured on standard DIR images using a seed-growing semiautomated approach in MRIcron (http://www.nitrc.org/projects/mricron/),17 saving binary masks for each lesion. Next, for each individual lesion, volume and T1 hypointense signal change were abstracted from the T1-weighted MPRAGE images, and a T1 ratio was calculated (methods detailed in Fig 1). Briefly, the mean T1 signal intensity within the lesion (T1 core) was measured by eroding 1 voxel. If eroding left no core volume (eg, very small lesions), the lesion was omitted from correlation analysis between the T1 measure and rim presence but was incorporated in the final lesion counts. The T1 normal-appearing WM measure was from surrounding white matter by 2 cycles of dilating the outer border of the lesion, restricted to white matter only. T1 ratios were calculated by dividing the T1 core by T1 normal-appearing WM values, reflecting the amount of lesion T1 hypointensity.
Lesion-Characteristic Scoring
Each lesion was reviewed and independently scored by 2 raters blinded to the diagnosis (J.-M.T., J.D.P.), using in-house-created lesion-scoring software. We recorded lesion location (juxtacortical, deep white matter, periventricular, infratentorial) and the presence/absence of GM-DIR rims. “Lesion rim” was defined as having a thin hypointense rim around the lesion that was complete and visible in all 3 planes; incomplete rims were tabulated as “no rim.” Consensus was met on all lesions in a joint reviewing session.
Statistical Analysis
Descriptive statistics were used to summarize patient demographics and MR imaging measures. We analyzed MR imaging characteristics by calculating patient-level summary statistics: the total number and volume of lesions, median lesion volume, and number and fraction of rim lesions. Sensitivity, specificity, and predictive values were obtained using the 2001 and 2010 McDonald MR imaging criteria,1,2 both without and with the addition of the presence of rims. In subjects in whom the DIS criteria were not met, clinically obtained spinal cord imaging (available in all) was reviewed to assure that no additional lesions would make those subjects fulfill the DIS criteria. Similarly, each case meeting the 2001 MRI criteria was reviewed for additional strict radiologically isolated syndrome criteria by an experienced reviewer (O.H.K.).18
In patients with MS, rank correlations were calculated between the Expanded Disability Status Scale (EDSS) and the number of rim lesions per patient. A penalized logistic regression model with clinical group as the outcome (MS versus PC) was used to obtain overall and region-specific estimates of the relative odds of MS for those with-versus-without rims. Models were adjusted for age, sex, total number of lesions, and median lesion size. We used penalization to stabilize odds ratio estimates and to reduce potential sparse-data bias.19
Results
Subjects
One hundred eight patients with relapsing-remitting MS and 38 positive controls were enrolled. One of the subjects with MS was excluded because the clinical course fit that of primary-progressive disease. Excessive motion was present in 2 PC subjects, leaving 107 relapsing-remitting MS and 36 PC subjects.
Demographic and clinical information is summarized in Tables 1 and 2. The PC group had a slightly higher median age (39 versus 32 years), but no significant differences were found in age and sex. A comparable number of pediatric patients (defined as 18 years of age or younger) were in both the MS and PC groups (29% versus 36%, P = .42), and age distribution was not significantly different. Of the PCs, 26 were classified as definite and 10 as indeterminate. The most likely diagnostic consideration was reported (multiple diagnoses possible), most commonly including “nonspecific” leukoaraiosis or possible migraine-related changes. Of the possible demyelinating cases, 3 had solitary lesions. These were either periventricular or juxtacortical with imaging characteristics suggestive of demyelinating disease. None of the PCs fulfilled the strictly applied more extensive radiologically isolated syndrome criteria.18
Demographic and clinical features
Diagnosis distribution for positive control subjects
We reviewed 4104 lesions: 3211 lesions in 107 subjects with MS subjects and 893 lesions in the PC group (n = 36). In the MS group, 1120/3211 lesions (35%) had a rim, but only 9/893 lesions (1%) in the PC group had a rim. Figures 2 and 3 show representative rim lesion images.

Examples of typical white matter lesions in subjects with MS. DIR images (A–C) and GM-DIR images (D–F) are shown for 2 different subjects with MS (A, B, D, E; C and F). Note the thin, single-pixel-wide dark rim surrounding most lesions on the GM-DIR images. Rims appear the same regardless of location (infratentorial, white arrows; juxtacortical, open arrows; periventricular, unlabeled).
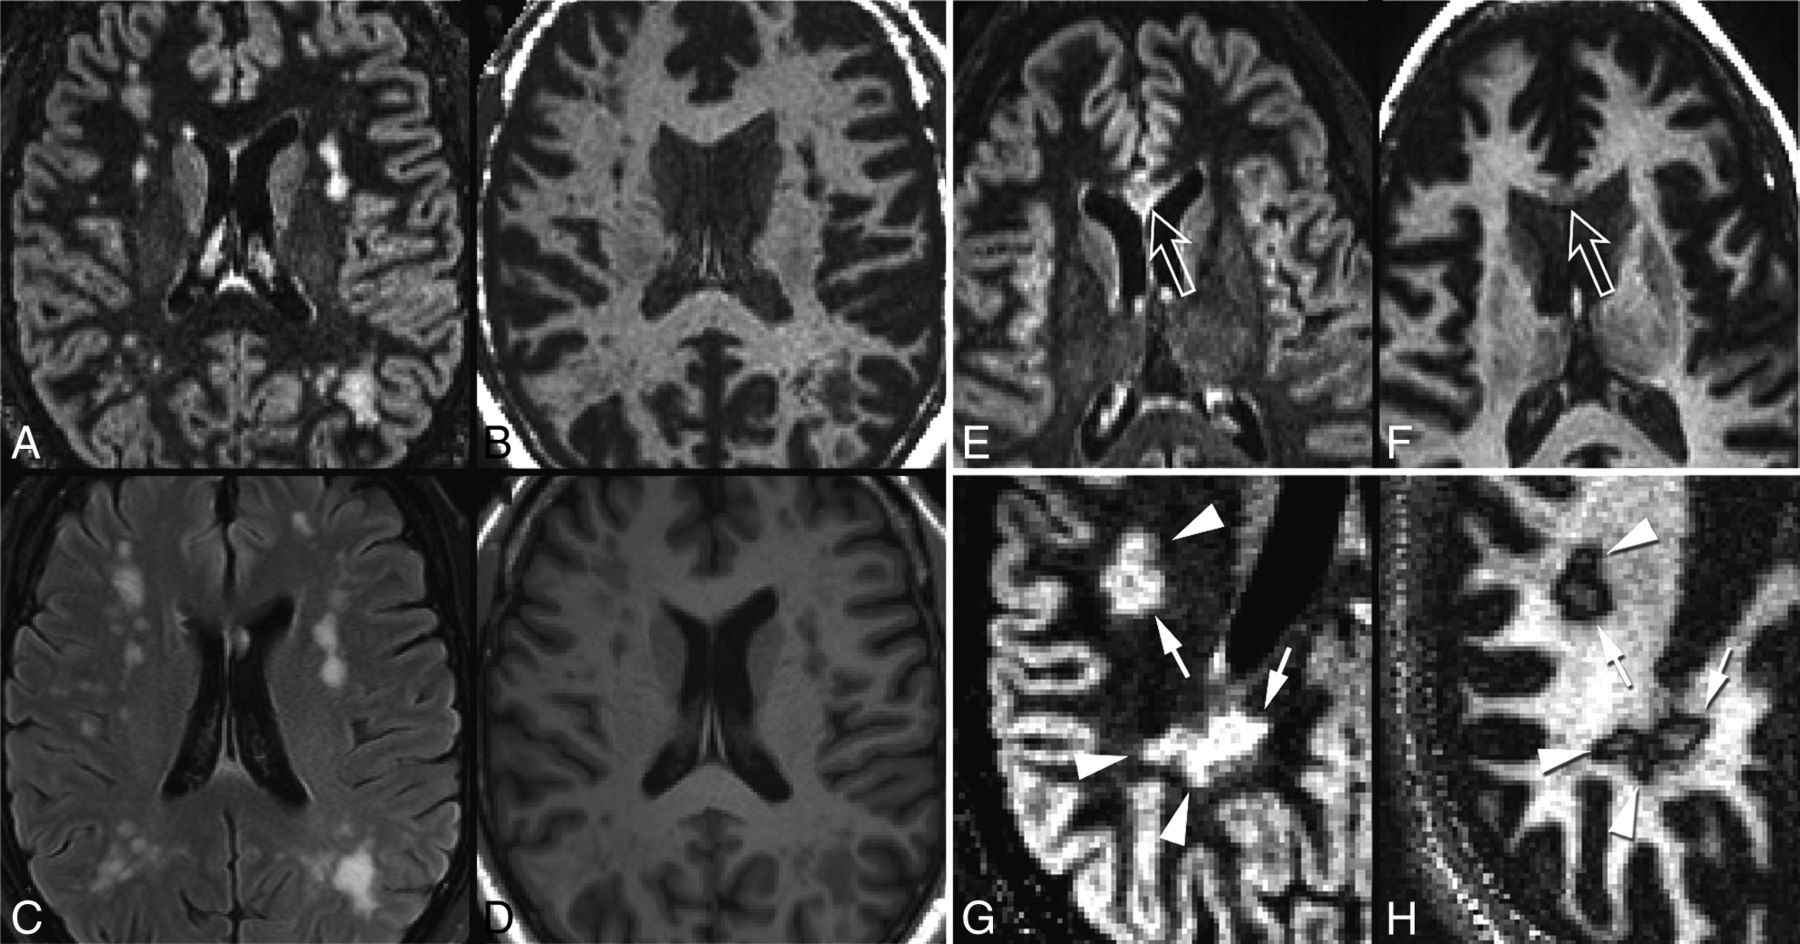
Examples of PC subjects without rim lesions, and “daughter lesions.” One PC subject with small-vessel disease (A, DIR; B, GM-DIR; C, T2 FLAIR; D, T1) shows typical juxtacortical and deep white matter lesions. Note the lack of rims around these lesions on GM-DIR. Another PC subject (E, DIR; F, GM-DIR) with neuromyelitis optica has a demyelinating corpus callosum lesion (open arrows) that also lacks a rim. One subject with MS (G, DIR; H, GM-DIR) shows typical conglomerate lesions on DIR imaging. GM-DIR imaging better demonstrates the separation and outline of smaller lesions (arrowheads) from larger lesions (arrows).
The On-line Figure shows lesion volumes and T1 ratios in both groups. Rim lesions were larger than non-rim lesions: median lesion volume, 130 mm3 (interquartile range [IQR], 73–285 mm3) for rim lesions versus 40 mm3 (IQR, 23–76 mm3) for non-rim lesions (P < .001). The median T1 ratio in MS lesions without a rim was 0.85 (IQR, 0.80–0.89) versus 0.72 (IQR, 0.67–0.78) in MS lesions with a rim (P < .001). PC rim lesions, though only 9 in total, had a median T1 ratio of 0.77 (IQR, 0.73–0.79) compared with 0.86 (IQR, 0.82–0.90) without a rim. Rims were more likely in larger lesions and cases with a higher lesion load (rank correlation, 0.77 and 0.78, respectively; both, P < .001).
Subject-level lesion distribution is summarized in On-line Table 2. No significant differences were seen in lesion count (20 lesions for both groups; P = .22) or lesion volume per subject (2.6 cm3 for MS versus 2.1 cm3 for PC, P = .79). Median lesion size in MS was larger, also not significant (62 versus 48 mm3, P = .08). Subjects with MS had a median of 5 lesions (IQR, 2–13 lesions) with rims per subject versus 0 (IQR, 0–0) in PCs (P < .001). None of the definite PC subjects had a rim lesion. In the indeterminate group, 7/10 subjects had a single rim lesion and 1 subject had 2 rim lesions. The median fraction of lesions that were rim lesions per patient was 33% in MS, but <1% in PC subjects. At least 1 rim lesion was found in 104/107 (97%) subjects with MS and only 8/36 (22%) PC subjects.
On-line Table 3 shows the regional distribution of lesions. In positive controls, rim lesions were found only in the juxtacortical and periventricular white matter, and none in deep white matter, the most common (48%) site of PC lesions. Having ≥1 rim lesion was associated with a >10-fold increase in the odds of MS after accounting for age, sex, total number of lesions, and the subject's median lesion size. These greatly elevated odds ratios were calculated using penalized logistic regression, a method that was chosen to provide more reliable estimates by reducing bias and artifactual associations.
Table 3 summarizes the potential diagnostic use of rim lesions by comparing them with the sensitivity of the standard diagnostic DIS criteria. The presence of ≥1 rim lesion had a sensitivity of 97% and specificity of 78%; the presence of ≥2 rim lesions decreased the sensitivity to 88%, while specificity increased to 97%. In contrast, applying standard MR imaging criteria alone had a low specificity (56% for the 2001 criteria, 17% for the 2010 criteria). Adding the requirement of ≥1 rim to the 2001 criteria improved the specificity to 94%, while adding this to the 2010 criteria kept the high sensitivity (97%) and increased the specificity to 83%. Most important, the positive and negative predictive values were greatly increased when rim information was added to the MR imaging DIS criteria: The positive predictive value increased from 75% to 94% with the 2010 criteria plus ≥1 rim lesion, and negative predictive value increased from 35% to 91% with this addition.
Sensitivity and specificity for various MRI criteria with or without rim lesions
During the study, 3 of the indeterminate PC subjects eventually developed a diagnosis of MS. One developed a progressive course, and the other 2 patients developed new lesions on follow-up MR imaging. The only subject in the PC group with 2 rim lesions had an imaging pattern that was thought atypical for MS, with predominantly deep white matter lesions. Despite having 30 lesions, this subject did not meet the 2001 radiologically isolated syndrome criteria and had no other CSF/spinal cord abnormalities.
Not all lesions in patients with MS had a rim. We performed correlations between the EDSS score and rim presence, despite relatively early disease (median disease duration, 3 years) and disability (median EDSS score, 1.5). The rank correlation was only weakly positive at 0.20 for the EDSS score and the number of rim lesions (P = .04). Disease duration had no significant effect on the presence of rim lesions.
Discussion
Our findings strongly suggest that the rim lesions detected using our novel GM-DIR MR imaging sequence could improve the specificity of an MS diagnosis. Specifically, the presence of a hypointense rim around demyelinating lesions was highly sensitive and specific for MS. Only 3/107 patients with MS lacked lesions with a typical rim, but all had typical attacks and lesions. In contrast, the PC cohort included only a single case with 2 rim lesions; no subject had more. Overall, the addition of this MR imaging marker increased the specificity from 17% to 78% when ≥1 rim lesion was present and to 97% when ≥2 lesions were present.
This MR imaging marker could be very helpful in clinical scenarios in which differentiation of MS from other conditions is not straightforward. The current MR imaging criteria for dissemination in space and time are highly sensitive for detecting MS and reliably diagnosing patients who present with an initial demyelinating event (clinically isolated syndrome). However, in less clear-cut clinical presentations, the question often arises as to whether the presentation fits that of demyelinating disease. The misdiagnosis of MS is not entirely uncommon, and overreliance on MR imaging measures is often a culprit.4,5 Better and more reliable MR imaging markers therefore could not only prevent unnecessary treatment but could also potentially limit subsequent MR imaging studies and unnecessary anxiety.6,20
GM-DIR rims have a characteristic “pencil thin” appearance at the junction of the lesion and adjacent normal-appearing white matter (Figs 2 and 3). We hypothesized that rims arise from a well-known artifact of inversion recovery sequences, the opposed-magnetization (or bounce point) artifact.21,22 This phenomenon creates a 1-pixel-wide dark band at the boundaries of tissues with significantly different T1 relaxation times. This idea is supported by the fact that the T1 ratios in our subjects were lower in lesions with rims (On-line Figure), indicating a significant difference in T1 relaxation times between the core of the lesion and the surrounding normal-appearing WM. Detecting these rim “artifacts” on GM-DIR images is straightforward and would be quite practical in a busy clinical setting.
Others have detected rims around MS lesions using various MR imaging techniques (eg, susceptibility-weighted imaging, 7T MR imaging),10,23,24 albeit not at the numbers and magnitude we report. These previous studies have postulated that iron or other metals accumulate within microglia and macrophages on the edge of slowly expanding (or smoldering) lesions.23 This phenomenon could very well be another explanation of the rims seen in our study, but most of our data are from the early MS course when smoldering lesions are typically not expected.25 Unfortunately, we did not have SWI available in all cases. Prior studies have shown that 10%–15% of MS lesions have iron accumulation at the edge,23,26 which is lower than the frequency of our rim detection. Additional studies are needed to determine whether detected rims are the consequence of opposed magnetization effects due to iron deposition or explained by other mechanisms. We noted heterogeneity of the signal change within lesions on GM-DIR but no presence of a central vein sign that has been described in SWI and T2* techniques.9,11,27⇓⇓–30 If the rim we observed was suspected to be due to the opposed magnetization effect, in the future, one could optimize the GM-DIR parameters to further enhance this phenomenon.
There are several limitations to our study. We did not have longitudinal follow-up on all patients to confirm the diagnostic accuracy. The diagnostic criterion standard used for this study was the clinical impression. When consideration of demyelinating disease persisted but the clinical criteria for MS could not be met, we placed patients in the indeterminate PC group. Thus, the indeterminate group could have included some patients with preclinical disease despite not fulfilling the radiologically isolated syndrome criteria. In fact, 3 of the 10 cases of indeterminate PC were diagnosed with MS at follow-up. Two of these 3 had clear rim lesions on GM-DIR, and in a post hoc analysis, the specificity was increased further when taking into account their conversion status.
Another limitation is the lack of longitudinal imaging to accurately assess marker reliability across time as well as different MR imaging scanner vendors. Furthermore, we do not have other measures such as SWI, T2*, or 7T MR imaging to see whether these measures would similarly distinguish cases. Because contrast-enhanced images were not obtained as part of our study, it is unknown whether rims on GM-DIR are associated with lesion stage. It would be unlikely in our study setting that 35% of all MS lesions were enhancing.
Finally, most of our study cohort consisted of patients with early MS; therefore, whether our findings can be extrapolated to progressive or long-standing MS remains to be determined. Given that rim lesions were present in both early and longer disease duration in our cohort, it is more likely that rims are a lesion-specific phenomenon rather than a disease stage phenomenon. T1 hypointense lesions are commonly encountered very early in the demyelinating process when significant edematous change is present. The persistence of the T1 hypointense lesion is subsequently correlated with a more destructive “black hole” lesion, as has been shown in prior studies. The strong correlation of the rim marker with T1 signal will need to be explored in longitudinal studies. The persistence of T1 hypointensities (black holes) has been associated with poor recovery and more pronounced tissue damage in MS.31⇓⇓–34 If the rim marker is a result of opposed magnetization artifacts arising from the differences in T1 signal change across a lesion, the rim lesions could serve as an additional important marker in quantitative studies on WM lesion damage severity and repair.
Conclusions
The addition of a novel GM-DIR technique to routine clinical imaging significantly enhanced specificity for diagnosing MS compared with the established criteria. As always, the use of these criteria should be in the context of the clinical presentation. However, the addition of the GM-DIR sequence provides a potentially important MR imaging marker to enhance the clinical diagnostic approach to MS, especially in patients in whom the disease course is not entirely clear.
Acknowledgments
The authors recognize and acknowledge the major contribution of our colleague Dr Istvan Pirko, who died during this study. Dr Pirko was instrumental in the entire study. He initiated the groundwork for the development of this sequence in late 2011, made the powerful initial observations of the rim pattern on white matter lesions, and obtained grant funding to initiate this study.
The authors wish to also acknowledge Mandie Maroney-Smith for her assistance managing the imaging protocol and scheduling research subjects, Dan Rettmann and Peter Kollasch for their guidance in helping to configure the sequences on our MR imaging scanners, and Josh Trzasko for his insight in the bounce point artifact.
Footnotes
Disclosures: Jan-Mendelt Tillema—RELATED: Grant: KL2 TR000136 (National Center for Advancing Translational Sciences).* Stephen D. Weigand—RELATED: Grant: Department of Defense.* Claudia F. Lucchinetti—UNRELATED: Grant: Novartis, Biogen, National MS Society, Mallinckrodt. John D. Port—RELATED: Grant: Department of Defense.* Orhun H. Kantarci—UNRELATED: Grants/Grants Pending: Biogen, Comments: funding for CHAMPS and CHAMPIONS data reanalyses*; Payment for Lectures Including Service on Speakers Bureaus: Biogen, Comments: invited professorship to Biogen, Boston; Travel/Accommodations/Meeting Expenses Unrelated to Activities Listed: Novartis, Comments: Istanbul MS Days meeting travel and accommodation, 2017. *Money paid to the institution.
Mayo Clinic has filed a patent on behalf of J.-M.T., Y.S., C.F.L., and J.D.P. that is broadly relevant to this work. Specifically, the GM-DIR sequence described in the patent was used for this study.
This publication was supported by grant No. KL2 TR000136 (National Center for Advancing Translational Sciences) and W81XWH-13–1-0098 (Department of Defense).
The views herein are solely the responsibility of the authors and do not necessarily represent the official views of the National Institutes of Health.
Indicates open access to non-subscribers at www.ajnr.org
REFERENCES
- Received October 27, 2017.
- Accepted after revision February 10, 2018.
- © 2018 by American Journal of Neuroradiology


Jump to section
Related Articles
Cited By...
- No citing articles found.