
Abstract
BACKGROUND: Accurate diagnosis of high-grade glioma and solitary brain metastasis is clinically important because it affects the patient's outcome and alters patient management.
PURPOSE: To evaluate the diagnostic performance of DWI and DTI for differentiating high-grade glioma from solitary brain metastasis.
DATA SOURCES: A literature search of Ovid MEDLINE and EMBASE was conducted up to November 10, 2017.
STUDY SELECTION: Studies evaluating the diagnostic performance of DWI and DTI for differentiating high-grade glioma from solitary brain metastasis were selected.
DATA ANALYSIS: Summary sensitivity and specificity were established by hierarchic logistic regression modeling. Multiple subgroup analyses were also performed.
DATA SYNTHESIS: Fourteen studies with 1143 patients were included. The individual sensitivities and specificities of the 14 included studies showed a wide variation, ranging from 46.2% to 96.0% for sensitivity and 40.0% to 100.0% for specificity. The pooled sensitivity of both DWI and DTI was 79.8% (95% CI, 70.9%–86.4%), and the pooled specificity was 80.9% (95% CI, 75.1%–85.5%). The area under the hierarchical summary receiver operating characteristic curve was 0.87 (95% CI, 0.84–0.89). The multiple subgroup analyses also demonstrated similar diagnostic performances (sensitivities of 76.8%–84.7% and specificities of 79.7%–84.0%). There was some level of heterogeneity across the included studies (I2 = 36%); however, it did not reach a level of concern.
LIMITATIONS: The included studies used various DWI and DTI parameters.
CONCLUSIONS: DWI and DTI demonstrated a moderate diagnostic performance for differentiation of high-grade glioma from solitary brain metastasis.
ABBREVIATIONS:
- FA
- fractional anisotropy
- HSROC
- hierarchic summary receiver operating characteristic
- MD
- mean diffusivity
- PRISMA
- Preferred Reporting Items for Systematic Reviews and Meta-Analyses
- QUADAS-2
- Quality Assessment of Diagnostic Accuracy Studies-2
The accurate diagnosis of high-grade glioma and solitary brain metastasis is clinically important because it affects the patient's outcome and alters patient management.1,2 Because high-grade glioma and solitary brain metastasis have similar findings on conventional MR imaging, the clinical context or patient history could be helpful. In addition, advanced MR imaging techniques have been introduced to assist in their differentiation.
Multiple studies report on the use of DWI and DTI for differentiating high-grade glioma from solitary brain metastasis.3⇓⇓⇓⇓⇓⇓⇓⇓⇓⇓⇓⇓–16 High-grade glioma typically shows an infiltrative growth pattern with invasion of the surrounding brain tissues, whereas brain metastasis shows an expansive growth pattern causing displacement of the surrounding brain tissue.17,18 In addition, high-grade glioma cells tend to produce large amounts of extracellular matrix, which play an important role in tumor growth and infiltration.19,20 Therefore, assessment of the enhancing tumor and perienhancing area with DWI and DTI parameters has been introduced. However, the results have been quite varied, and the utility of these techniques is still an issue under debate.7,9,12 Some studies have reported a high diagnostic performance for DWI or DTI; however, other studies have reported a low diagnostic performance or no added value of DWI or DTI compared with conventional MR imaging.
Therefore, we considered it appropriate to assess the diagnostic performance of DWI and DTI for differentiating high-grade glioma from solitary brain metastasis using the currently available published resources. We thus performed a systematic review and meta-analysis evaluating the diagnostic performance of DWI and DTI for differentiating high-grade glioma from solitary brain metastasis.
Materials and Methods
The current systematic review and meta-analysis are reported according to the Preferred Reporting Items for Systematic Reviews and Meta-Analyses (PRISMA) guidelines.21 The following research question was established21: What are the diagnostic performances of DWI and DTI for differentiating high-grade glioma from solitary brain metastasis?
Literature Search
A literature search of Ovid MEDLINE and EMBASE was conducted to find relevant original articles up to November 10, 2017. The search query combined equivalents for “glioma,” “brain metastasis,” “DWI,” and “DTI” as follows: ((brain metastasis) OR (brain metastases) OR (metastatic brain tumor*) OR (intraaxial metastatic tumor*) OR (cerebral metastasis) OR (cerebral metastases) OR (solitary metasta*)) AND ((glioblastoma) OR (glioma)) AND ((diffusion-weighted imaging) OR (diffusion-weighted imaging) OR (DWI) OR (“apparent diffusion coefficient”) OR (diffusion tensor imaging) OR (DTI)). The literature search was restricted to English language publications. Any additional relevant articles identified were also investigated.
Literature Selection
Inclusion Criteria.
We used the following inclusion criteria: 1) population: patients with a solitary enhancing brain lesion; 2) index test: DWI and DTI scans available; 3) reference standard: histopathologic diagnosis; 4) outcomes: differentiation of high-grade glioma (glioblastoma and/or anaplastic astrocytoma) from solitary brain metastasis, with sufficient data provided to establish 2 × 2 tables for sensitivity and specificity; and 5) articles published as original articles.
Exclusion Criteria.
We applied the following exclusion criteria: 1) case reports/series (a sample size of <10 patients), conference abstracts, reviews, and notes; 2) studies including patients with low-grade gliomas; 3) studies including patients with recurrent brain metastasis; 4) insufficient information for reconstruction of 2 × 2 tables; and 5) a partially overlapping patient population. In the case of an overlapping study population, the study with the largest study population was selected. When 2 × 2 tables could not be established, authors of the eligible studies were contacted for further data.
Data Extraction and Quality Assessment
The following data were extracted from the included studies: 1) study characteristics: authors, year of publication, institution, duration of patient recruitment, study design (prospective versus retrospective), study enrollment (consecutive versus nonconsecutive), and reference standard; 2) patient characteristics: number of patients, number of patients with high-grade glioma, mean age, age range, and male/female ratio; 3) MR imaging characteristics: magnet field strength, scanner vendor, scanner model, channels of head coil, and MR imaging techniques including DWI, DTI, b-value (s mm−2), ROI placement, parameters, and cutoff values; and 4) MR imaging interpretation: number of readers, experience of readers, and blinding of readers to the reference standard.
The study quality was assessed using the Quality Assessment of Diagnostic Accuracy Studies-2 (QUADAS-2) tool.22 The literature search, literature selection, data extraction, and quality assessment were performed independently by 2 reviewers (C.H.S. and H.S.K.).
Data Synthesis and Statistical Analysis
The primary aim of this study was to determine the diagnostic performance of DWI and DTI for differentiating high-grade glioma from solitary brain metastasis. We obtained 2 × 2 tables from the studies to identify their individual sensitivities and specificities. Summary sensitivity and specificity were established by hierarchic logistic regression modeling (bivariate random-effects model and hierarchic summary receiver operating characteristic [HSROC] model).23⇓–25 An HSROC curve with 95% confidence and prediction regions was obtained, and the area under the HSROC curve was also calculated. Publication bias was investigated using the Deeks asymmetry test.26
Heterogeneity across the studies was evaluated as follows: 1) Cochran Q test (P < .05 indicating the presence of heterogeneity); 2) Higgins inconsistency index (I2 test)27 (I2 = 0%–40%, heterogeneity might not be important; 30%–60%, moderate heterogeneity may be present; 50%–90%, substantial heterogeneity may be present; and 75%–100%, considerable heterogeneity); 3) visual assessment of a coupled forest plot or a Spearman correlation coefficient (>0.6 indicating a threshold effect) to assess a threshold effect (positive correlation between sensitivity and the false-positive rate)28; and 4) visual assessment of the difference in the 95% confidence and prediction regions in the HSROC.
Multiple subgroup analyses were performed as follows: 1) studies using DWI, 2) studies using DTI, 3) studies including glioblastoma only, 4) studies including both glioblastoma and anaplastic astrocytoma, 5) studies using enhancing tumor for ROI placement, 6) studies using perienhancing area for ROI placement, 7) studies using fractional anisotropy (FA), 8) studies using mean diffusivity (MD), and 9) studies using perienhancing ADC or MD. Statistical analyses for the meta-analysis were performed by one of the reviewers (C.H.S., with 4 years of experience in performing systematic reviews and meta-analyses), using the metandi and midas modules in STATA 15.0 (StataCorp, College Station, Texas) and the mada package in R statistical and computing software, Version 3.4.1 (http://www.r-project.org/). P < .05 indicated statistical significance.
Results
Literature Search
The detailed literature-selection process is illustrated in Fig 1. The literature search identified 215 articles. After we removed 54 duplicate articles, screening of the titles and abstracts of the remaining 161 articles yielded 44 potentially eligible articles. Full-text reviews were performed, and 30 studies were excluded because of the following: 1) twelve studies because the 2 × 2 table could not be obtained29⇓⇓⇓⇓⇓⇓⇓⇓⇓⇓–40; 2) seven studies not in the field of interest41⇓⇓⇓⇓⇓–47; 3) five studies with a partially overlapping patient cohort48⇓⇓⇓–52; 4) four studies with mixed brain tumors53⇓⇓–56; 5) one study with a low-grade glioma57; and 6) one case series.58 Fourteen studies evaluating the diagnostic performance of DWI and DTI for differentiating high-grade glioma from solitary brain metastasis,3⇓⇓⇓⇓⇓⇓⇓⇓⇓⇓⇓⇓–16 covering 1143 patients, were included in the analyses.
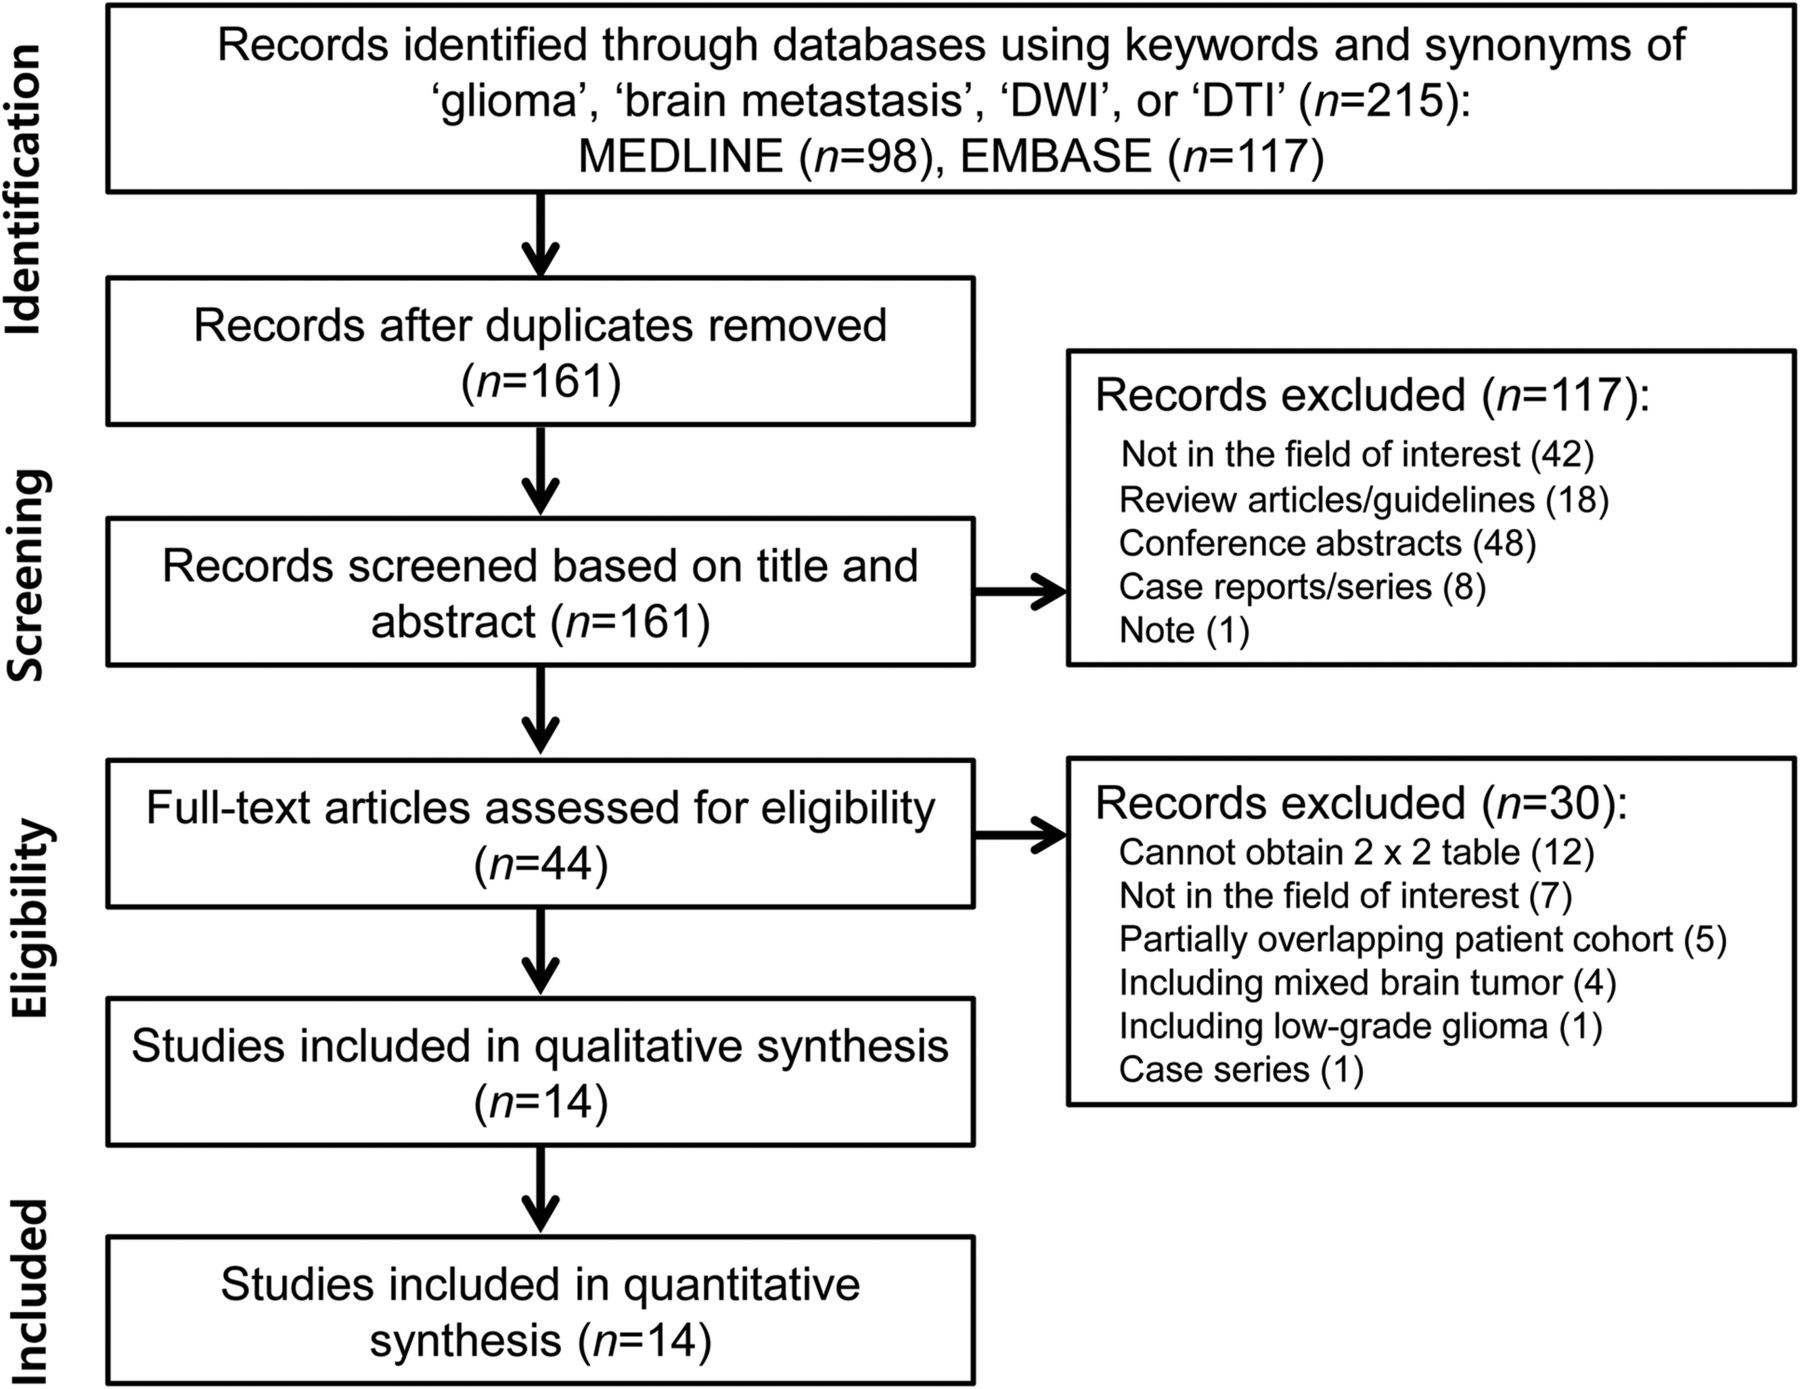
Flow diagram illustrating the study-selection process for the systematic review and meta-analysis.
Characteristics of the Included Studies
The detailed study and patient characteristics are shown in On-line Table 1. Nine studies enrolled patients with glioblastoma only,3⇓⇓⇓–7,10⇓–12,15 while 5 studies enrolled patients with high-grade gliomas.8,9,13,14,16 Twelve studies used histopathology as the reference standard,3⇓–5,7⇓⇓⇓⇓⇓–13,15,16 and 1 study used histopathology and clinical diagnosis only for brain metastasis.14
The detailed MR imaging characteristics are described in On-line Table 2. DWI was used in 7 studies6,8,10⇓⇓–13,16; and DTI, in 7 studies.3⇓–5,7,9,14,15 A quantitative ADC value was used in 7 studies using DWI.6,8,10⇓⇓–13,16 Five of the 7 DTI studies used both FA and MD,3,5,9,14,15 whereas 2 studies used FA only.4,7 In terms of ROI placement, both enhancing tumor and perienhancing area were selected in 12 studies3,5⇓⇓⇓⇓⇓–11,13⇓⇓–16; enhancing tumor only, in 1 study4; and perienhancing area only, in 1 study.12
Quality Assessment
The results of the quality assessment are illustrated in On-line Fig 1. In the patient-selection domain, 10 studies revealed an unclear risk of bias because of nonconsecutive enrollment.3,5⇓–7,9,11⇓⇓⇓–15 In the index test domain, 6 studies revealed an unclear risk of bias because it was unclear whether imaging analysis had been conducted blinded to the reference standard.3,5,7,9,15,16 In the reference standard domain, 2 studies revealed a high risk of bias, with 1 study not mentioning the reference standard6 and 1 study using both histopathology and clinical diagnosis.14 In the flow and timing domain, 13 studies revealed an unclear risk of bias because the time intervals between MR imaging and the reference standard were not mentioned.3,4,6⇓⇓⇓⇓⇓⇓⇓⇓⇓–16 However, there were no concerns regarding the applicability of all 3 domains.
Diagnostic Accuracy
The individual sensitivities and specificities of the 14 included studies showed a wide variation, ranging from 46.2% to 96.0% for sensitivity and 40.0% to 100.0% for specificity. The pooled sensitivity was 79.8% (95% CI, 70.9%–86.4%), and the pooled specificity was 80.9% (95% CI, 75.1%–85.5%) (Fig 2 and On-line Table 3). The area under the HSROC curve was 0.87 (95% CI, 0.84–0.89; On-line Fig 2). The Deeks funnel plot demonstrated that no publication bias was present (P = .98; On-line Fig 3).

Coupled forest plots of pooled sensitivity and specificity. Numbers are pooled estimates with 95% confidence intervals in parentheses.
In the investigation of heterogeneity, a Cochran Q test showed that heterogeneity was not present (Q = 3.117, df = 2, P = .104), and there was some level of heterogeneity across the included studies (I2 = 36%); however, it did not reach a level of concern. Visual assessment of the coupled forest plots revealed no threshold effect (Fig 2), and the Spearman correlation coefficient was 0.188 (95% CI, −0.653–0.381), also indicating no threshold effect. The HSROC curve illustrated a small difference between the 95% confidence prediction regions, indicating a low possibility of heterogeneity (On-line Fig 2).
Multiple Subgroup Analyses
On-line Table 4 shows the results of multiple subgroup analyses. In the subgroup analysis according to MR imaging technique, those studies using DWI showed a pooled sensitivity of 81.4% (95% CI, 70.6%–88.9%) and a pooled specificity of 81.8% (95% CI, 69.5%–89.9%).6,8,10⇓⇓–13,16 Studies using DTI showed a pooled sensitivity of 77.0% (95% CI, 62.3%–87.1%) and a pooled specificity of 80.3% (95% CI, 73.5%–85.7%).3⇓–5,7,9,14,15 There was no statistical difference between DWI and DTI (P = .59). In the subgroup analysis according to study population, the studies including glioblastoma showed only a pooled sensitivity of 82.2% (95% CI, 71.9%–89.3%) and a pooled specificity of 81.4% (95% CI, 74.8%–86.6%).3⇓–5,13⇓⇓–16 Studies including both glioblastoma and anaplastic astrocytoma showed a pooled sensitivity of 76.8% (95% CI, 61.45%–87.4%) and a pooled specificity of 81.2% (95% CI, 69.9%–88.9%).6⇓⇓⇓⇓⇓–12
In the subgroup analysis according to the ROI placement, studies using enhancing tumor showed a pooled sensitivity of 72.6% (95% CI, 63.4%–80.3%) and a pooled specificity of 77.0% (95% CI, 71.7%–81.6%).3,4,7,11,13,15 Studies using a perienhancing area showed a pooled sensitivity of 80.1% (95% CI, 69.1%–87.9%) and a pooled specificity of 81.0% (95% CI, 70.6%–88.3%).3,6,8⇓–10,12,14,16 In the subgroup analysis according to DTI parameters, studies using FA showed a pooled sensitivity of 70.8% (95% CI, 61.0%–79.0%) and a pooled specificity of 74.5% (95% CI, 69.0%–79.3%).3,4,7,9,14,15 MD showed a pooled sensitivity of 84.5% (95% CI, 71.7%–92.1%) and a pooled specificity of 81.3% (95% CI, 72.0%–88.1%).3,9,14,15 Studies using perienhancing ADC or MD showed a pooled sensitivity of 84.7% (95% CI, 73.6%–91.6%) and a pooled specificity of 84.0% (95% CI, 71.8%–91.6%).3,6,8,10,14,16
Discussion
We identified 14 studies providing the diagnostic performance of DWI and DTI for differentiating high-grade glioma from solitary brain metastasis. DWI and DTI showed not only a wide range of individual sensitivities and specificities but also only a moderate diagnostic performance (ie, a pooled sensitivity of 79.8% [95% CI, 70.9%–86.4%] and a pooled specificity of 80.9% [95% CI, 75.1%–85.5%]). Multiple subgroup analyses also demonstrated similar diagnostic performances (sensitivities of 76.8%–84.7% and specificities of 79.7%–84.0%). DWI and DTI are rarely used as a single sequence, whereas DWI and DTI are usually part of a multiparametric MR imaging protocol for differentiating high-grade glioma from solitary brain metastasis. Therefore, DWI and DTI could actually be helpful in the context of multiparametric MR imaging.
High-grade glioma typically shows an infiltrative growth pattern with invasion of the surrounding brain tissues. However, brain metastasis shows an expansive growth pattern and displaces the surrounding brain tissue.10 Therefore, many researchers have used various advanced MR imaging techniques in attempts to differentiate the infiltrative edema of glioma from metastatic vasogenic edema. DWI and DTI have been used for testing the perienhancing area of solitary enhancing brain lesions; however, the results are conflicting. Two studies reported that the mean minimum perienhancing ADC values in high-grade glioma were significantly higher than those in brain metastases,6,8 whereas 1 study reported lower mean minimum perienhancing ADC values in high-grade glioma.10 Two studies also reported that perienhancing MD was significantly lower in high-grade glioma than in brain metastasis.3,14
The current meta-analysis revealed a moderate diagnostic performance in 6 studies that used perienhancing ADC or MD as a parameter to determine optimal cutoff values, with a pooled sensitivity of 84.7% (95% CI, 73.6%–91.6%) and a pooled specificity of 84.0% (95% CI, 71.8%–91.6%).3,6,8,10,14,16 Assessment of the perienhancing area with DWI or DTI presents several limitations or challenges. First, primary (de novo) glioblastoma shows minimal microscopic tumor infiltration in the perienhancing area. Therefore, a differentiation from brain metastasis could be challenging. Second, secondary glioblastoma, anaplastic astrocytoma, and oligodendroglioma generally show definite microscopic tumor infiltration in the perienhancing area, even on conventional MR imaging sequences such as FLAIR. Therefore, the added value of advanced MR imaging is controversial. Third, when it comes to extensive peritumoral edema, microscopic tumor infiltration in the perienhancing area could be overestimated on advanced MR imaging.
Glioma cells tend to produce large amounts of extracellular matrix components.19,20 This extracellular matrix serves as a substrate for adhesion and subsequent migration of the tumor cells along the enlarged extracellular space.19 These molecules are concentrated and are oriented in the extracellular matrix, which results in high FA.15,59 In the current meta-analysis, 3 studies demonstrated that high-grade glioma showed higher FA values in enhancing tumor than brain metastases; in 2 of these studies, the difference was statistically significant,4,15 though the difference did not reach statistical significance in the other one.3 However, 2 further studies did not show any meaningful differences between the 2 groups.9,14 A recent systematic review also revealed no significant changes in the FA of enhancing tumor between high-grade glioma and brain metastasis.60 The underlying mechanism for this discrepancy is not fully understood, and further studies are required.
Although all the studies using DWI used ADC, the exact parameters varied and included minimum ADC, ADC ratio, gradient of ADC, or a combination of these. Despite the use of these various parameters, DWI is available in most institutions with MR imaging facilities, and the benefit is fast acquisition and easy image processing.11 A variety of parameters were also used for DTI, including perienhancing MD and FA of the enhancing tumor. DTI had several drawbacks, including low spatial resolution and image distortion.61 Therefore, considerable effort is required to achieve standardization, and further studies are needed.
This study has several limitations. First, only 21.4% (3 of 14) of the included studies were prospective.5,13,16 However, the included studies are the only currently available ones. Second, we combined the MR imaging techniques used for diagnostic performance (ie, DWI and DTI). Third, the included studies used various parameters. However, we demonstrated the absence of heterogeneity across the included studies. In addition, we also performed multiple subgroup analyses. Furthermore, we conducted this study using robust methodology (hierarchic logistic regression modeling23) and have reported the results in accordance with several guidelines (PRISMA,21 the Handbook for Diagnostic Test Accuracy Reviews published by the Cochrane Collaboration,62 and the Agency for Healthcare Research and Quality63). Nevertheless, caution is required in applying our results to daily clinical practice.
Conclusions
DWI and DTI demonstrated a moderate diagnostic performance for differentiating high-grade glioma from solitary brain metastasis.
Footnotes
This study was supported by a grant from the National R&D Program for Cancer Control, Ministry of Health and Welfare, Republic of Korea (1720030).
Indicates open access to non-subscribers at www.ajnr.org
References
- Received December 15, 2017.
- Accepted after revision March 7, 2018.
- © 2018 by American Journal of Neuroradiology


