
Abstract
BACKGROUND AND PURPOSE: Much has been written about the initial radiologic features of cavernous malformations, but less known are the radiologic natural history and evolution of the lesions, particularly when they initially present with hemorrhage. We aimed to describe the typical evolution of a sporadic, hemorrhagic brain cavernous malformation with time.
MATERIALS AND METHODS: From our institutional review board–approved cavernous malformation registry, we assessed initial clinical and radiologic features and the subsequent MR imaging evolution of 51 patients with sporadic, hemorrhagic brain cavernous malformations (with follow-up brain MRIs available for review).
RESULTS: The initial MR imaging demonstrated mostly Zabramski type I lesions (94.2%) with T1 hyperintensity (94.2%) and associated edema (76.5%). Eight patients (15.6%) rebled in the first year with lesions characterized by new T1 hyperintensity (100%), edema (61.5%), and growth (median, 4 mm). By 90 days, most lesions had changed from Zabramski type I to type II or III (65.2%). While 76.5% had edema associated with the acute hemorrhage, none had persistent edema beyond 90 days unless rebleeding occurred. Across time, the frequency of T1 hyperintensity decreased from 94.2% at baseline to 73.9%, 57.1%, and 50.0% at <90, 91–365, and >365 days. DWI intensity at baseline and <90, 91–365, and >365 days was hypointense at 53.1%, 56.5%, 70.1%, and 81.2%, respectively.
CONCLUSIONS: Hemorrhagic cavernous malformation demonstrates a characteristic pattern of evolution on follow-up imaging. Knowing this evolution helps to analyze the timing of imaging in relation to the clinical presentation and may help distinguish true cavernous malformation hemorrhagic evolution from mimics and guide appropriate timing of interval-imaging follow-up after symptomatic bleeds in untreated patients.
ABBREVIATIONS:
- CM
- cavernous malformation
- DVA
- developmental venous anomaly
Cavernous malformations (CMs) are angiographically occult vascular malformations that appear in the brain, spinal cord, and rarely nerve roots. Pathologically, they comprise endothelial-lined caverns containing defective tight junctions that predispose these lesions to hemorrhage.1
A typical CM has a reticulated appearance on T2 MR imaging, often likened to mulberries or popcorn. This appearance reflects the underlying pathology in which the caverns may be filled with blood, thrombosis, and calcification.2⇓⇓⇓⇓–7 However, after an acute hemorrhagic episode, the appearance of a CM is less distinctive and can be difficult to diagnose initially.8 While many clinical natural history studies exist,9⇓⇓–12 few reports have detailed the radiographic evolution of hemorrhagic CM lesions.
We aimed to describe the initial clinical and radiologic features of patients with sporadic, hemorrhagic CMs of the brain. We further aimed to describe the typical evolution of these lesions in patients with multiple MRIs across time.
Materials and Methods
Patient Population and Study Design
Our institution has maintained an institutional review board–approved prospective cavernous malformation registry since 2014. Demographic and clinical data are collected at the initial visit and then every 1 or 2 years. Data include clinical presentation features and comorbidities. For this study, we included patients with the following: 1) an initial clinical presentation with hemorrhagic CM on MR imaging associated with symptoms as defined per standard guidelines,13 2) a presumed sporadic form of CM, and 3) follow-up MR imaging from at least 1 time point following discovery of the lesion.
MR Imaging Studies
The initial diagnostic MR imaging of the brain in each patient was reviewed in detail, and the location and size of the CM on T2 sequences were recorded. The number of CMs recorded was based on hemosiderin-sensitive sequences (gradient recalled-echo or SWI) when available. If a hemosiderin sequence was not available, the total number of CMs was counted from a standard T2 sequence. We only included patients with multiple CMs if the CMs were clustered around a developmental venous anomaly (DVA). Cavernous malformations were based on Zabramski typing.14 We recorded the presence of high T1 signal, perilesional high T1 signal,15 edema, and gadolinium enhancement. Increased T1 signal was considered mild, moderate, or severe if <one-third, one-third to two-thirds, or all of the lesion demonstrated increased T1 signal. Edema, measured on FLAIR sequences, was considered mild, moderate, or significant if <one-third, one-third to two-thirds, or the entire lesion was surrounded by edema on FLAIR sequences, respectively. Characteristics (hypointense, mixed, hyperintense) on DWI and ADC imaging were also collected. Follow-up MR images were reviewed in a similar manner.
Outcomes
The primary outcome of this study was the temporal evolution of hemorrhagic cavernous malformations. Outcomes of interest were changes in the Zabramksi classification, the presence of persistent edema, change in T1 hyperintensity, and the appearance on DWI/ADC. Patients had subsequent MRIs per clinical practice at varying time frames after the initial hemorrhage. We chose to group the subsequent MRIs into those performed <90 days after the hemorrhage, 91–365 days after the initial hemorrhage, and >365 days after hemorrhage. If a patient's follow-up MR imaging demonstrated rebleeding, we noted it but did not include those patients in the data regarding size change, persistent enhancement, persistent T1 hyperintensity, and edema.
Statistical Analysis
We used descriptive statistics with means, medians, and frequencies for the initial clinical and radiologic features. All statistical analyses were performed using JMP 13.0 (SAS Institute, Cary, North Carolina).
Results
Patient Population
We identified 54 of 196 patients in our registry with sporadic brain CMs who had presented with a symptomatic hemorrhage; 51 underwent at least 1 follow-up MR imaging of the brain. The demographics, clinical presentation, and initial MR imaging data for this cohort are presented in Table 1. The median age at presentation was 38.3 years (range, 17.7–70.5 years). Most patients (72.0%) presented with a focal neurologic deficit.
Demographics of patients with sporadic, brain CMs (n = 51)
Baseline MR Imaging
The initial, diagnostic MR imaging of the brain was performed 4 days after initial symptoms (range, 0–30 days). The average size at presentation was 12.7 mm (range, 4.7–34.7 mm). The initial, diagnostic MR imaging demonstrated type I lesions with high T1 signal intensity in nearly all patients (94.2%). Thirty-nine (76.5%) had associated edema. Seventeen (33.3%) had high perilesional T1 signal. The DWI and ADC intensity was low or mixed signal in most patients at baseline.
Follow-Up MR Imaging
While all 51 patients had at least 2 consecutive MR imaging scans, 35 (68.7%) had ≥3 MR imaging scans for review. In the first year, 8 (15.7%) patients had a rebleed. Of these, all lesions showed new areas of T1 hyperintensity and 8 (61.5%) demonstrated edema, and there was an average 4-mm increase in size (range, 0–15 mm) with the new clinical hemorrhage. The median time from the first-to-last MR imaging available for review was 341 days (range, 27–3022 days).
Twenty-eight patients had repeat MR imaging within the first 90 days following the initial brain hemorrhage (Table 2). Five had a recurrent, symptomatic hemorrhage as the indication for the follow-up MR imaging. Within the first 90 days, it was common (73.9%) to have persistent T1 hyperintensity, but most lesions had changed from Zabramski type I to type II or III (65.2%). The average decrease in size was 1.4 mm (range, −1.65 to +1.7 mm). While 76.5% had edema associated with the acute hemorrhage on the initial MR imaging, only 2 patients (8.7%) had persistent edema by 90 days if they had not rebled.
Evolution of MRI changes on follow-up imaging at specific time intervalsa
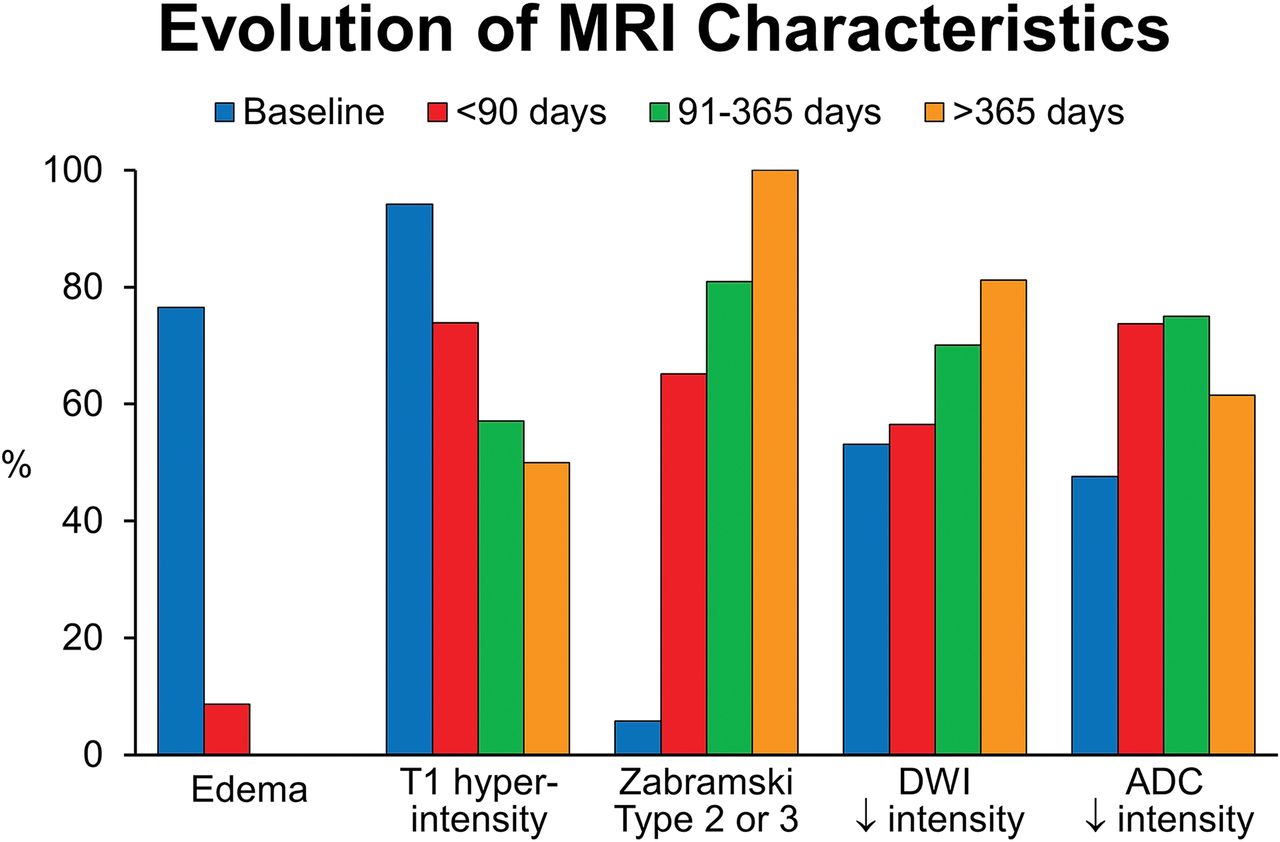
Between 91 and 365 days, 24 patients underwent MR imaging, and 3 of these had a recurrent bleed. Twenty-three patients had MRIs >365 days after the initial bleed. Six patients had a hemorrhage in this time frame. The median time to MR imaging of >365 days was 1136 days (range, 382–3022 days). With time, the frequency of increased T1 hyper intensity decreased from 94.1% at baseline to 73.9%, 57.1%, and 50.0% at <90, 91–365, and >365 days. With time, 100% of the hemorrhagic lesions that did not rebleed evolved to type II or III lesions, and no patient had persistent edema beyond 90 days.
DWI intensity at baseline and <90, 91–365, and >365 days was low at 53.1%, 56.5%, 70.1%, and 81.2%, respectively. The ADC map intensity was low in 45.2%, 73.7%, 75.0%, and 61.5% at baseline and <90, 91–365, and >365 days. Gadolinium enhancement, often mild, within the lesion was variable throughout the course with 16.7%, 27.3%, 35.0%, and 56.2% at baseline and <90, 91–365, and >365 days, respectively.
Table 3 takes data from Table 2 and divides it into patients with MRI imaging at <1 year and >1 year. If a patient had an MR imaging in both the <90- and 91- to 365-day time frame, the first MR imaging was used in the analysis. In Figs 1 and 2, we show patient examples of the typical evolution of a CM hemorrhage with time. Figure 3 shows the evolutionary features in graphic form.
Evolution of MRI changes on follow-up brain imaging <1 year versus >1 yeara

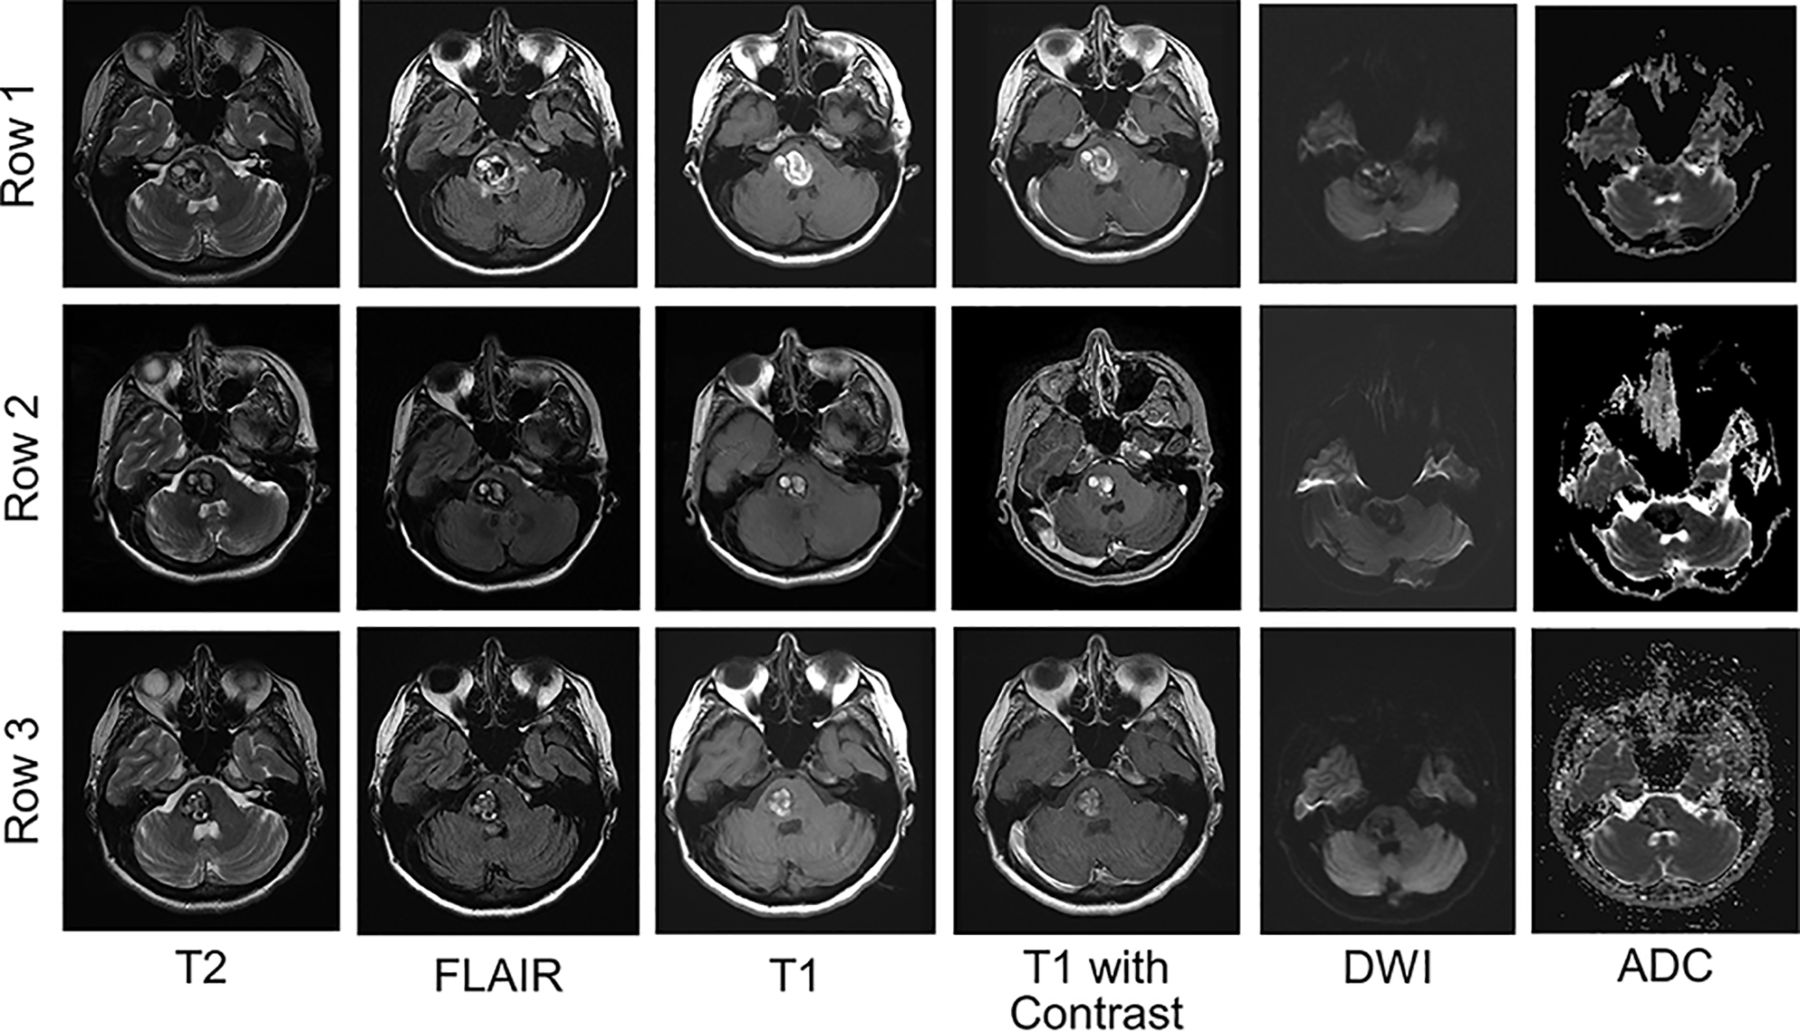
Typical evolution of a hemorrhagic CM on MR imaging with time. Row 1, A hemorrhagic CM in the pons at the time of acute focal symptoms. MR imaging demonstrates subacute hemorrhage with increased T1 and T2 signal, with surrounding edema on FLAIR. In this patient, there was no enhancement of the lesion. DWI and ADC maps demonstrate low signal intensity. Rows 2 and 3, The evolution of the lesion 1 and 8 months later, respectively. The edema is reduced by 1 month and absent at 8 months. The lesion decreases in size, but there remains an increased T1 signal. DWI remains low signal intensity throughout. The ADC map demonstrates low or mixed intensity by 8 months.

Radiologic evolution of hemorrhagic cavernous malformations. Row 1, An acute hemorrhage into a medullary cavernous malformation with surrounding FLAIR hyperintensity. There is a small developmental venous anomaly on contrast imaging. A follow-up MR imaging (row 2) was performed 3 months later. The cavernous malformation has evolved from a Zabramski type I to type III lesion. There is no persistent edema, and the ADC and DWI demonstrate hypointensity.

Overview of the evolutionary MR imaging changes of hemorrhagic CM with time. This graphic display shows the percentage of patients with particular MR imaging characteristics at baseline and ≤90 days, 91–365 days, and >365 days.
Discussion
We found that the 1-year symptomatic rebleed risk was similar to that previously reported in the literature9,10,12,16 and was associated with new areas of T1 hyperintensity, edema, and growth. We found that a typical, sporadic, brain hemorrhagic CM decreases in size and evolves to a type II or III lesion if it does not rebleed. Among lesions that did not rebleed, edema resolved within 90 days in all cases. On DWI, about half of the lesions had low signal intensity on the initial presentation, and 80% had low signal intensity at >365 days. ADC map intensity was generally low in more than half of patients. While T1 signal evolved from high-to-low intensity, almost half of patients continued to demonstrate some degree of hyperintensity. Recognizing the distinguishing features of a hemorrhagic CM at presentation and its evolution with time is useful in distinguishing these lesions from other non-CM pathologies with similar initial clinical and radiologic characteristics such as tumors and other vascular malformations. In addition, understanding the evolution of an untreated hemorrhagic CM is important in assessing the need and ideal interval for future scheduled radiologic follow-ups in the absence of new clinical events. On the basis of our experience, we recommend a follow-up MR imaging within 3 months after the original bleed. After an initial baseline study, further imaging follow-up is recommended if any new clinical event is suspicious for an interval bleed, in patients with CM growth of >5 mm, and in those patients with risk factors (eg, older age, history of systemic cancer) of a CM mimic.
Prior studies have described CM evolution but typically in patients with and without hemorrhage (mixture of types), and the number of patients was small.8,14,16⇓⇓⇓–20 Moreover, few series have reported modern MR imaging sequences. Willinsky et al8 followed 30 patients with initial hemorrhage due to a CM. Seven of these patients had follow-up MR imaging demonstrating a rebleed (n = 1), regression (decrease in size by 20%; n = 5), and stability (n = 1). Similarly, they found edema and mass effect to be strictly associated with Zabramski type I lesions or an acute-to-subacute hemorrhage. Other studies, while limited in the number of symptomatic hemorrhages, have suggested a decrease in size and a predictable evolution from Zabramski type I to II and II to III.16,19,20 Kazawa and Shibamoto18 assessed DWI characteristics in patients with CMs (with or without bleeding) and showed that most CMs demonstrate low-intensity signal. This study did not look at the evolution of these characteristics.
Decreases in edema and enhancement of CMs with time make sense because the hemorrhagic cavity retracts and disruption in the blood-brain barrier abates. Likewise, one might expect a typical evolution of hemorrhage to isointensity on T1 with time. However, that is not the case in at least half of patients from our study. This finding may be due to the persistent slow flow or thrombosis within the caverns or ongoing asymptomatic, intralesional hemorrhage. Incomplete reabsorption of blood within the boundaries (“intracapsular” blood) of the CM is a peculiar feature of CMs, probably related to their pathogenesis and morphologic structure. Dammann et al16 reported that about 19% of 199 patients followed had radiographic evidence of hemorrhage. The article did not specify whether those with or without prior hemorrhage were among the 19%.
These lesions also have an interesting evolution on DWI and ADC. In 50% of cases, lesions were hypointense on both ADC and DWI. ADC maps represent the true diffusion signal, and one would expect a lesion that is hypointense on ADC to be bright on DWI. However, this feature was not found in many cases due to a T2 blackout effect. T2 blackout effect is a phenomenon whereby lesions with actual diffusion restriction on ADC appear dark on DWI due to the presence of very low T2 signal, and it is the reverse of T2 shine through. Most interesting, the T2 blackout effect increased with time because >80% of lesions had low signal on DWI at >365 days, likely related to deposition of hemosiderin in the CM.
Limitations
Our current study is limited by tertiary care referral bias, inconsistent timing of follow-up MR imaging, and small numbers. Our study was a convenience sample of already completed MR imaging scans, often at facilities outside our institution. Thus, there was no standard imaging protocol. In addition, while some patients went on to have surgery and pathologically proved etiology, others had presumptive cavernous malformations. However, this is the largest series to report specifically on the evolution of Zabramski type I CM lesions and, to our knowledge, the first to detail temporal changes in DWI and ADC MR imaging sequences in a large series.
Conclusions
Hemorrhagic CM demonstrates a characteristic pattern of evolution on follow-up imaging studies. Knowing this evolution is helpful to analyze the timing of imaging in relation to clinical presentation, distinguish true CM hemorrhagic evolution from that of CM mimics, and guide the appropriate timing of interval imaging follow-up after a symptomatic bleed in untreated patients. On the basis of these findings, we recommend that the first follow-up MR imaging be performed within 3 months after a presenting hemorrhagic episode. If patients have further symptoms or demonstrate significant growth, further repeat MR imaging studies may be indicated thereafter.
Footnotes
Disclosures: Giuseppe Lanzino—UNRELATED: Board Membership: Superior Medical Editing.
This publication work was supported by grant No. UL1 TR002377 from the National Center for Advancing Translational Sciences.
The contents are solely the responsibility of the authors and do not necessarily represent the official views of the National Institutes of Health.
Indicates open access to non-subscribers at www.ajnr.org
REFERENCES
- Received February 11, 2019.
- Accepted after revision April 21, 2019.
- © 2019 by American Journal of Neuroradiology


Jump to section
Related Articles
Cited By...
- No citing articles found.