
Abstract
BACKGROUND AND PURPOSE: CTA is the imaging modality of choice in many institutions for the evaluation of the supraaortic vessels, but radiation exposure remains a matter of concern. Our aim was to evaluate a 70-kV protocol for CT angiography of the carotid arteries with respect to image quality and radiation exposure compared with automated tube voltage adaption.
MATERIALS AND METHODS: A total of 90 consecutive patients were included in this prospective study and randomized to the study group (n = 45, 70 kV) or control group (n = 45, automated tube voltage adaptation). Volume CT dose indices and dose-length products were recorded in the examination protocol. Image quality was assessed as arterial vessel contrast, signal-to-noise ratio, contrast-to-noise ratio, and contrast-to-noise ratio in reference to the radiation dose. Subjective overall image-quality analysis, image-artifact analysis, and diagnostic evaluation were performed by 2 observers by using a 4-point Likert scale.
RESULTS: Radiation exposure was significantly lower in the study group (volume CT dose index reduced by 22%, dose-length product reduction by 20%; each P < .001). Contrast (P = .15), SNR (P = .4), and contrast-to-noise ratio (P = .5) did not show significant differences between the groups. The contrast-to-noise ratio in reference to the radiation dose was not significantly increased using the study protocol (P = .2). Subjective image quality and visualization of pathologic findings did not differ significantly between the groups.
CONCLUSIONS: Carotid CTA using the lowest available voltage (70 kV) is feasible at very-low-dose levels, while overall image quality is comparable with protocols using automated tube voltage selection.
ABBREVIATIONS:
- A
- relative attenuation
- BMI
- body mass index
- C
- contrast
- CNR
- contrast-to-noise ratio
- CNRD
- contrast-to-noise ratio in reference to the radiation dose
- CTDIvol
- volume CT dose index
- DLP
- dose-length product
Besides screening with Doppler sonography, CT angiography is an established second-line technique in imaging of extracranial carotid artery disease.1 Following its technologic evolution and the increasing availability, the number of CT examinations has been steadily rising in the past years, though CT is the main factor accounting for medical x-ray exposure. Increasing knowledge of the potential risks of even relatively low radiation doses has led to increased concern about CT as a screening tool, as well as in serial use.2⇓⇓–5 Biologic experiments have demonstrated that the number of DNA double-strand breaks is closely related to the applied radiation dose, and according to the as low as reasonably achievable (ALARA) principle, the applied radiation dose should be as low as reasonably achievable.3 To lower radiation exposure, automated attenuation-based tube current modulation or automatic exposure control protocols are widely established.6,7
In addition to minimizing tube current, lowering the tube voltage is a good option for reducing the overall radiation dose. A drawback of low-kilovolt scanning is increased image noise, which needs to be partially compensated for by raising the milliampere-second setting. In examinations with contrast media, a low kilovolt enables scanning closer to the k-edge of iodine. This feature strongly increases the image contrast so that despite the increased image noise, the contrast-to-noise ratio can be kept constant or even increased compared with conventional imaging protocols. Therefore, the radiation dose efficiency is increased. This effect has already been described earlier in phantom studies and has also been used in several clinical studies to reduce contrast agent or radiation dosages compared with conventional tube voltage settings.8⇓⇓–11 The need for complex manual adaption of tube voltage and tube current to individual patient anatomy has precluded its widespread use in the past.
Recently, fully automatic algorithms adapting the setting of tube potential (kilovolt) and the tube current time product (milliampere-second) by attenuation information from a scout scan have made low-kilovolt scanning popular for various indications.12⇓⇓⇓–16 For the carotid arteries, an automated, attenuation profile–based kilovolt-selection algorithm has been established as being beneficial for reducing radiation exposure while maintaining a high image quality.17 Spearman et al18 reported an average radiation dose reduction of 36.4% for this state-of-the-art technique in a worldwide meta-analysis. Study protocols for carotid or cerebral CT angiographies used 100 kV (19% of all cases), 120 kV (79%), or 140 kV (2%) before the use of automated tube voltage selection, which was considerably reduced to 80 kV (9%), 100 kV (74%), 120 kV (16%), or 140 (1%) after its implementation. However, it remains unclear whether this positive effect could be further exploited by aggressively using the lowest available tube voltage for all patients, regardless of their anatomy. Recent x-ray tubes are especially tuned into this low-kilovolt range for high-tube-current supply.
Therefore, our aim was to evaluate the effects on radiation exposure and image quality in CTA of the carotid arteries using a fixed 70-kV protocol in comparison with the established protocol with automated kilovolt selection.
Materials and Methods
A total of 90 consecutive patients scheduled for CTA of the carotid arteries were enrolled in this prospective study and randomized for examination following either the study or the reference protocol. Body mass index (BMI) was calculated for all patients using the following formula: Weight (kg) / [Height (m)]2. Indications included stenosis of the carotid arteries as well as cervical CTA in patients undergoing reconstructive operations due to head and neck malignancies. The study protocol was approved by the institutional review board (University Hospital Erlangen) and complies with the Declaration of Helsinki. All examinations were performed on a third-generation dual-source CT scanner in a single-source mode (Somatom Force; Siemens, Erlangen, Germany).
A total of 45 patients were enrolled in the study group. CTA was performed using a protocol with a fixed 70-kV setting and activated automated exposure control (167 reference milliampere-second), corresponding to an image quality of 120 reference kilovolts with 85 reference milliampere-seconds. The full detector collimation was used (192 × 0.6 mm by a z-flying focal spot), the pitch factor was set to 0.85, and the rotation time was 0.25 seconds.
Another 45 patients were assigned to the control group and examined with activated automated tube voltage selection (CARE kV; Siemens) using the same reference values. All other parameters were identical to those in the study protocol.
Circulation time was individually calculated for both groups using a test-bolus injection with 10 mL of iodinated contrast medium (iopamidol, Imeron 350; Bracco, Milan, Italy) at a flow rate of 5 mL/s chased by a 50-mL saline bolus at the same flow rate using a power injector (Accutron CT-D; Medtron, Saarbrücken, Germany). The ROI to measure the time to peak was placed in the aortic arch. Two seconds were added as a start delay of the diagnostic scan after injecting 50 mL of iodinated contrast medium and 50 mL of saline chaser, both at a flow rate of 5 mL/s.
Image reconstruction was performed in the axial plane using filtered back-projection with a smooth vascular kernel (Bv 36) and 3-mm slice thickness for basic image-quality evaluation in this study. Thin slices (Bv 36, 0.6 mm) were reconstructed for 3D evaluations.
Radiation Exposure
Values for effective milliampere-second, volumetric CT dose index (CTDIvol), and the dose-length product (DLP) were recorded in the patient protocol, allowing a direct comparison of radiation dose exposure in the study and the control groups. The effective dose was calculated using the published conversion factor for neck CT at 80 kV, which is usually indicated as the most appropriate value in the literature for this type of imaging (effective dose = DLP × 0.0052 mSv / mGy × cm).19 BMI-dependent subgroups below and above 27 kg/m2 were used to evaluate the previously reported effect of body size on low-tube-voltage protocols.20
Objective Image Quality
Objective assessment of the image quality was performed on a standard PACS workstation on 3-mm images in the axial plane. For each examination, 2 ROIs were manually placed in the carotid arteries on both sides, in the muscles of the neck, and in the air right and left anterior to the neck. Calcifications of the carotid walls were carefully excluded to avoid false iodine relative attenuation values. ROIs were not placed in slices with severe artifacts (ie, due to dental hardware or motion).
Mean relative attenuation (A) and its SD were obtained for each measurement in Hounsfield units. The SD was considered as a measure of image noise. Vessel contrast (C) was defined as the difference between the attenuation of the carotid artery and the muscle (C = Acarotid − Amuscle). Signal-to-noise ratio (SNR = Acarotid / SDcarotid), and contrast-to-noise ratio [CNR = (Acarotid − Amuscle)/SDmuscle] were calculated for the carotid artery. CNR in reference to the radiation dose exposure (CNRD) was calculated using the following formula: CNRD = CNR × √CTDIvol−1/2.
Subjective Image Quality
Subjective image quality of all examinations was assessed on a 4-point Likert scale (4, excellent; 3, good; 2, moderate; 1, not diagnostic). Artifacts were grouped into 4 categories of strength (4, no artifacts; 3, mild artifacts, not affecting diagnostic value; 2, artifacts, affecting diagnostic value; 1, strong artifacts, nondiagnostic) and assessed in 3 locations: 1) in the environment of the highly concentrated inflowing contrast media in the subclavian vein, 2) at the level of the shoulder girdle, and 3) at the level of the skull base. Regions affected by metal artifacts (eg, due to dental implants) were not considered due to strong interindividual differences. Artifacts of dental implants were assessed using a 4-point scale (4, no dental hardware; 3, dental implants, not affecting vessel evaluation; 2, dental hardware, mildly affecting vessel imaging, not affecting diagnostic confidence; 1, dental hardware with severe artifacts affecting diagnostic accuracy in the affected slices). Image quality and the presence of artifacts were independently evaluated by 2 observers (both with >8 years of experience in carotid CTA).
Diagnostic Evaluation
All examinations were independently evaluated by the same 2 experienced radiologists with respect to image quality of the surgically important branches of the external carotid artery (lingual, facial, and superior thyroid arteries) as well as with respect to calcification and stenotic disease of the common and internal carotid arteries on a 3D postprocessing console (syngo.via VB20; Siemens). Visualization of the branches of the external carotid artery was assessed on a 4-point Likert scale as following: 4, complete visualization; 3, slightly suboptimal visualization; 2, only segmental visualization; 1, not visible. Calcification of the carotids was assessed as follows: 1, no calcification; 2, mild calcification; 3, moderate calcification; 4, severe calcification.
Stenotic disease was evaluated according to the NASCET style and grouped as follows: 0, no stenosis; 1, mild (0%–49%); 2, moderate (50%–69%); 3, severe (70%–99%); 4, obstruction.21
Diagnostic confidence was assessed independently by both observers as follows: 4, excellent; 3, substantial; 2, limited; 1, poor.
Statistical Analysis
All statistical analyses were performed using a dedicated software package (SPSS 15.0; IBM, Armonk, New York). The presence of normally distributed data was tested using the Kolmogorov-Smirnov test. The Student t test was used for radiation-dose comparisons, and the Mann-Whitney U test was used to evaluate the subjective image-quality scores as well as the diagnostic evaluation. Subgroup analysis of the different kilovolt settings of the control group and BMI subgroups of the study group was performed using Kruskal-Wallis analysis. A P value < .05 was considered statistically significant. The Cohen κ was used to assess interobserver agreement in rating image quality, diagnostic confidence, and artifacts. κ values above 0.41 were interpreted as moderate; above 0.61, as substantial; and above 0.81, as almost perfect agreement.
Results
Patient Characteristics
In the study group, the mean age was 64 ± 12 years, the range was 35–84 years, and 28 patients were men and 17 were women. The mean age in the control group was 65 ± 13 years with a range of 24–87 years, and 29 patients were men and 16 were women. There was no significant difference in the BMI between the study and the control groups. The BMI in the kilovolt subgroups of the reference differed statistically significantly (P < .001).
Radiation Exposure
Radiation exposure was significantly lower in the study group, with a CTDIvol reduction of 22% (P < .001) and a DLP and effective dose reduction of 20% (P = .001). Subgroup analyses showed significant differences between the study group and the 70-kV examinations of the control group, with a significantly lower dose exposure in the 70-kV subgroup of the control group (P = .03). In the 80- and 90-kV subgroups, all radiation dose parameters were significantly higher compared with the study group (each, P < .001). The radiation dose for patients of the study group below 27 kg/m2 was significantly lower than that for patients above it (P = .001). Both BMI-related subgroups of the study group had significantly lower radiation dose values than the corresponding BMI-related subgroups of the control group (P = .007 for BMI < 27 kg/m2 and P = .01 in BMI > 27 kg/m2). Detailed results are shown in Table 1.
Results of measurements and dose exposurea
Objective Image Quality
Attenuation of the carotids was comparable in the study and the control groups. Differences in image noise was discrete but statistically significant in ROI measurements of the vessels, with higher values in the study group (P = .02). No significant differences were found in contrast, SNR, and CNR. The CNRD was not significantly increased using the 70-kV protocol (26.9 ± 15.2 mGy−1/2 versus 22.4 ± 17 mGy−1/2, P = .2). A (P < .001), SD (P = .01), and C (P < .001) were significantly higher in the 70-kV subgroup of the control group compared with the 70-kV examinations of all patients of the study group, but differences in SNR and CNR were nonsignificant. CNRD values were highest in the 70-kV subgroup of the control group (29.7 ± 12 mGy−1/2), but not significantly higher than the CNRD in the study group (P = .24). A, SD, C, SNR, and CNR in the 80-kV subgroup were comparable with those of the study group, but at the expense of significantly decreased CNRD (19.8 ± 6.7 mGy−1/2, P = .03). Results of the 90-kV subgroup were significantly lower compared with those of the study group, with an intensive drop in CNRD (8.8 ± 4.2 mGy−1/2, P = .003). A and SD in the muscles and air were comparable between both groups, with a significant drop in Amuscle in the 80-kV subgroup in comparison with the study group (P = .02). No significant differences in SNR, CNR, and CNRD were found for the BMI subgroups of the study group (all, P > .1). Detailed results are shown in Table 1.
Subjective Image Quality
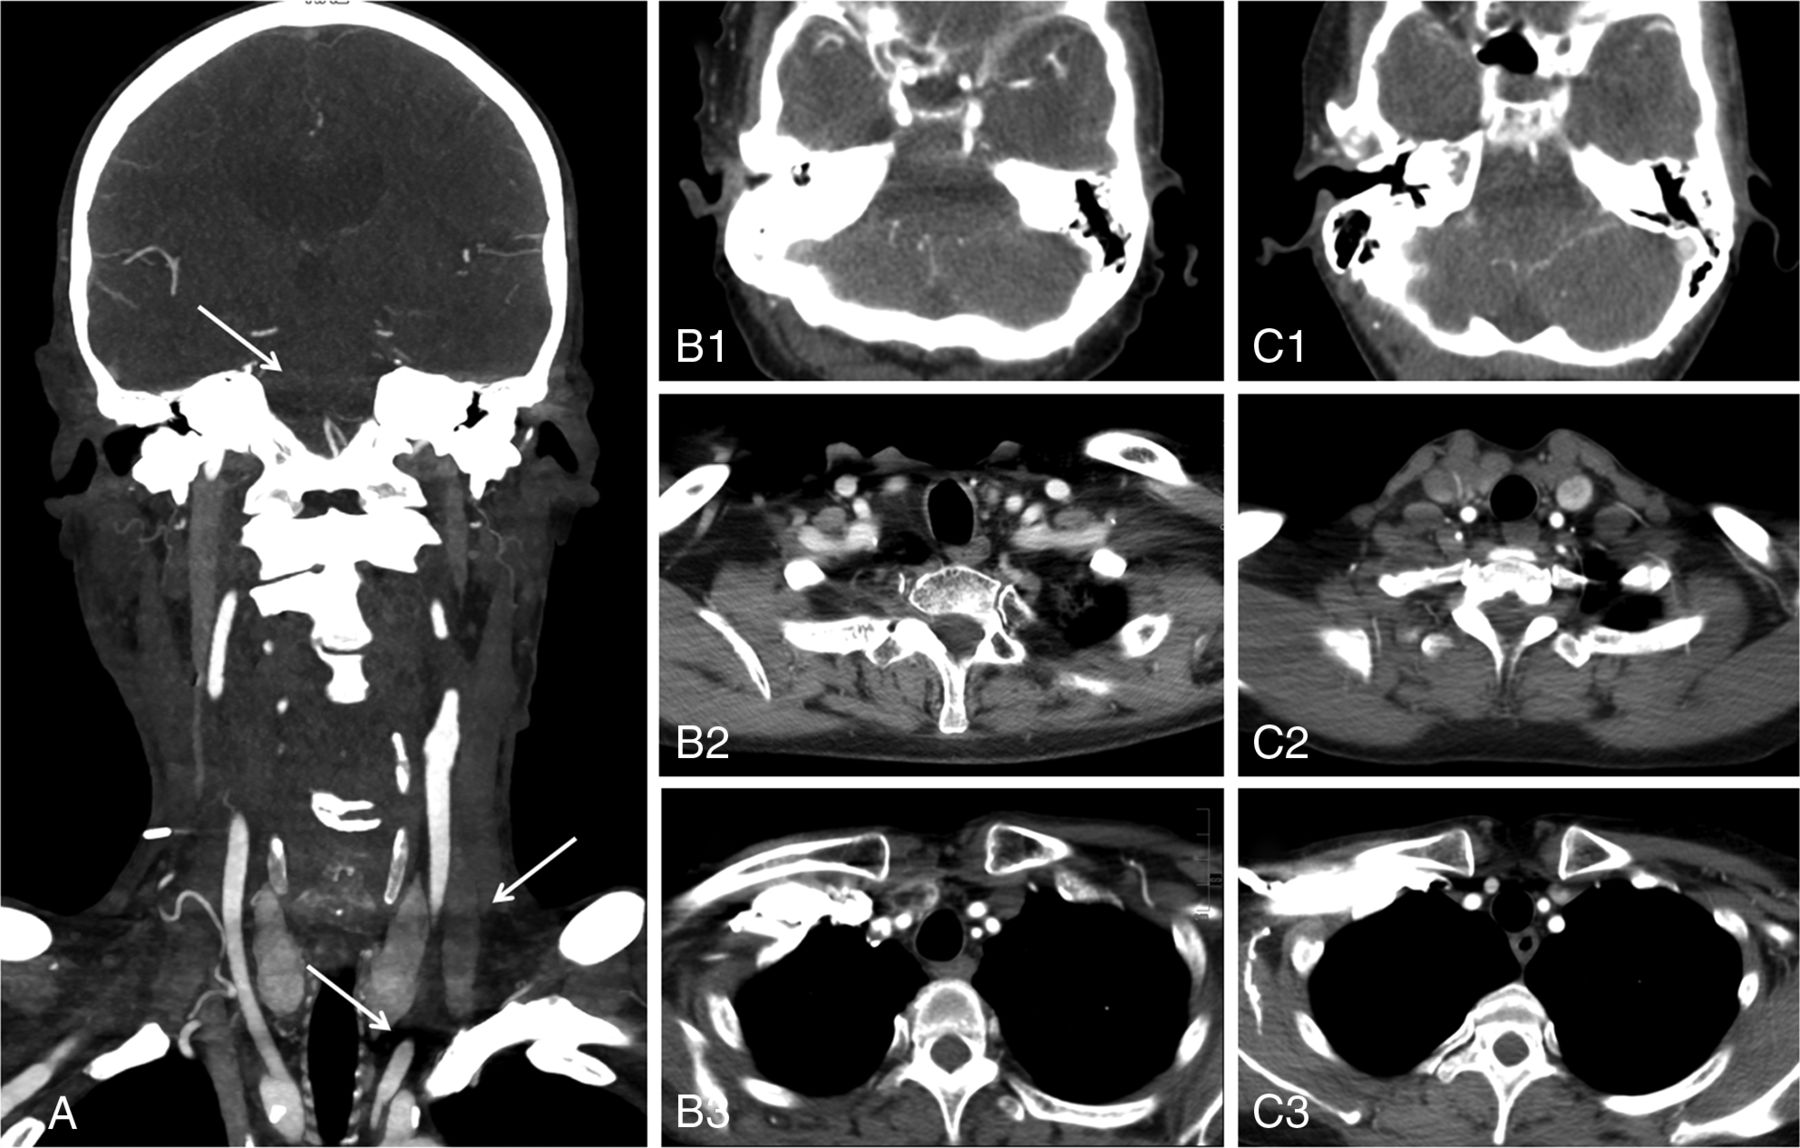
Subjective overall image quality was without significant differences between the 2 groups (P = .56). Also, artifacts were evaluated with no significant differences between the study and control groups (Fig 1), but slightly higher ratings of artifacts that might affect the image quality were found in the study group. Mean ranks of artifacts around the highly concentrated contrast influx in the height of the subclavian vein were 3.00 in the study group and 3.18 in the control group (P = .23); at the shoulder girdle, they were 2.98 in the study group and 3.00 in the control group (P = .36); and at the level of the skull base, they were 2.93 in the study and 2.96 in the control group (P = .65). No significant differences were found for artifacts in the BMI-related subgroup analysis of the study and control groups. Interobserver agreement was 0.93 in evaluating image quality and 0.87 for artifact analysis. Detailed results are shown in Table 2.

Coronal maximum intensity projection (5 mm) of a patient with obesity from the study group (BMI, 30.4 kg/m2; 70 kV) provides an overview of the evaluated artifacts (arrows) at the level of the skull base, shoulders, and venous contrast agent inflow (A). Axial examples of mild artifacts not affecting the diagnosis (Likert 3) in patients from the study (70 kV, B1–B3) and the control group (80 kV, C1–C3). Note the distinct increase at the lowest tube voltages that did not affect the rating.
Grading numbers in the subjective image analysisa
Metal artifacts due to dental implants were found in 31 (69%) subjects in the study group and were rated as follows: 3 (n = 3; 7%), 2 (n = 27; 60%), and 1 (n = 1; 2%). In the control group, dental implants occurred in 32 (71%) subjects, and they were rated as 3 (n = 5, 11%), 2 (n = 25, 56%), and 1 (n = 2, 4%).
Diagnostic Findings
The mean values of the diagnostic evaluation are given in Table 3; image examples are given in Figs 2⇓–4. The ratings for pathologic findings were not significantly different between the study and reference groups (all, P > .308). Mean subjective confidence was 3.89 (observer 1) and 3.86 (observer 2) in the study group and 3.91 (observer 1) and 3.89 (observer 2) in the control group, with an overall κ value of 0.66. No significant differences were found.
Results of the diagnostic evaluation

CT of a 51-year-old female patient of the study group (BMI, 25.4 kg/m2): curved MPR of the right side in 3 planes; 2.5-mm slice thickness; window level, 900 HU, and center, 200 HU. High vessel contrast with excellent overall image quality (Likert 4), moderate stenosis of the internal carotid artery (NASCET 2), and artifacts from dental implants not affecting the diagnosis (Likert 2). CTDIvol was 2.92 mGy, and DLP was 108 mGy × cm.

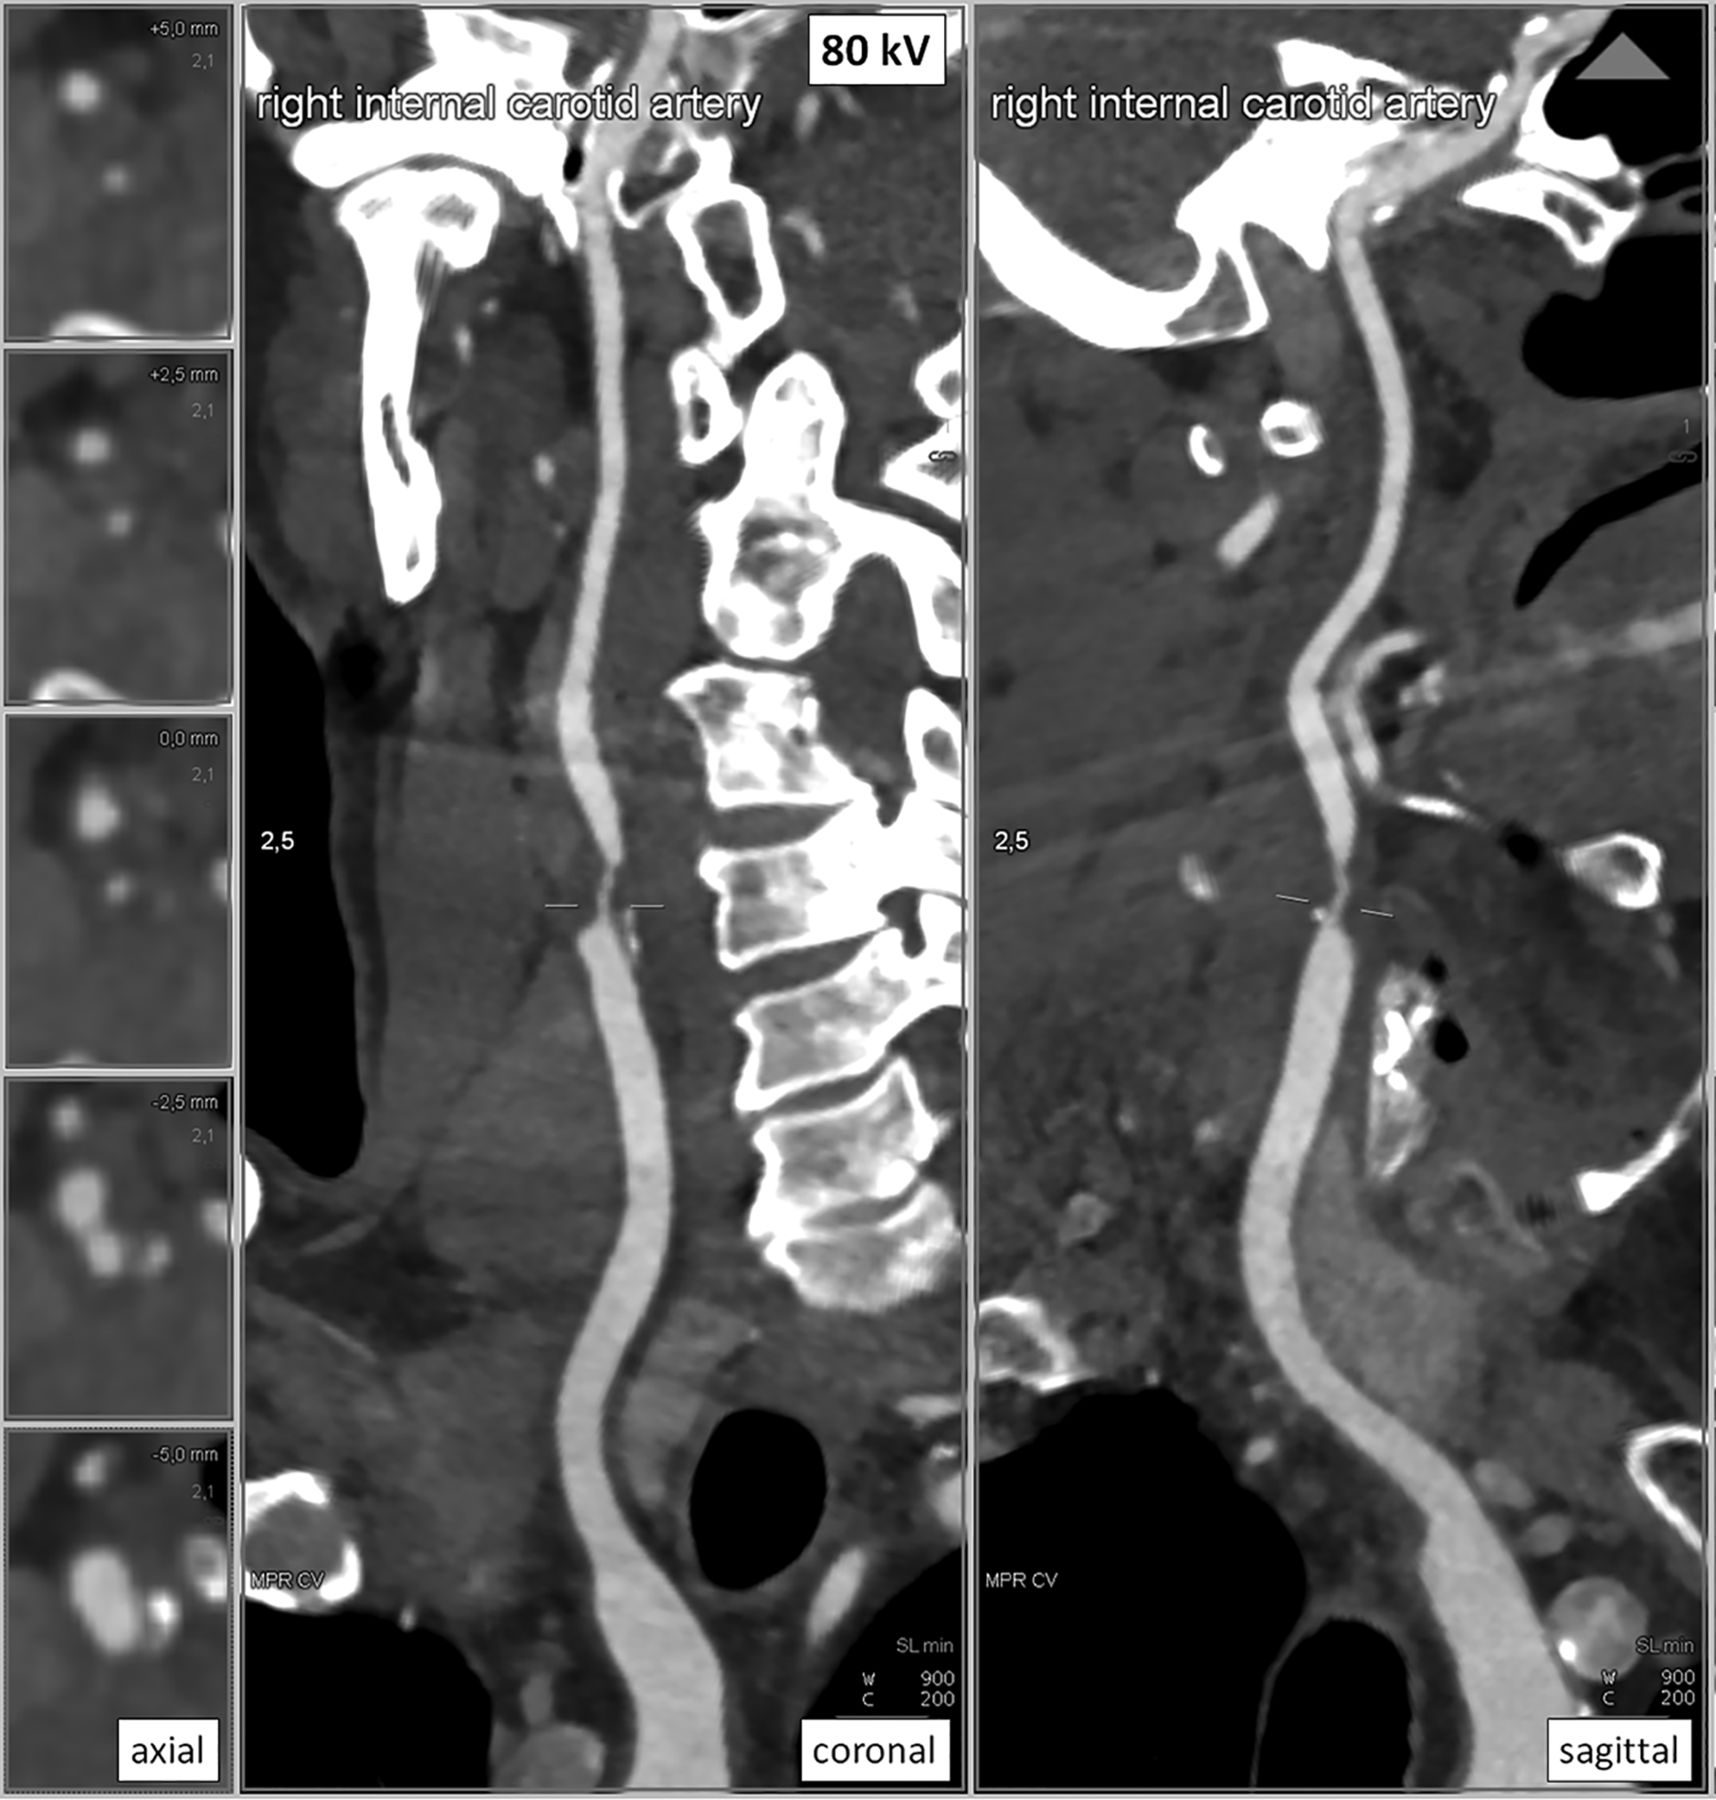
CT imaging of a 60-year-old male patient of the control group (BMI 25.7 kg/m2) curved MPR of the right side in 3 planes; 2.5-mm slice thickness; window level, 900 HU, and center, 200 HU. Intermediate vessel contrast with excellent overall image quality (Likert 4), severe stenosis of the internal carotid artery (NASCET 3), and artifacts from dental implants not affecting the diagnosis (Likert 2). CTDIvol was 4.01 mGy, and DLP was 146 mGy × cm.
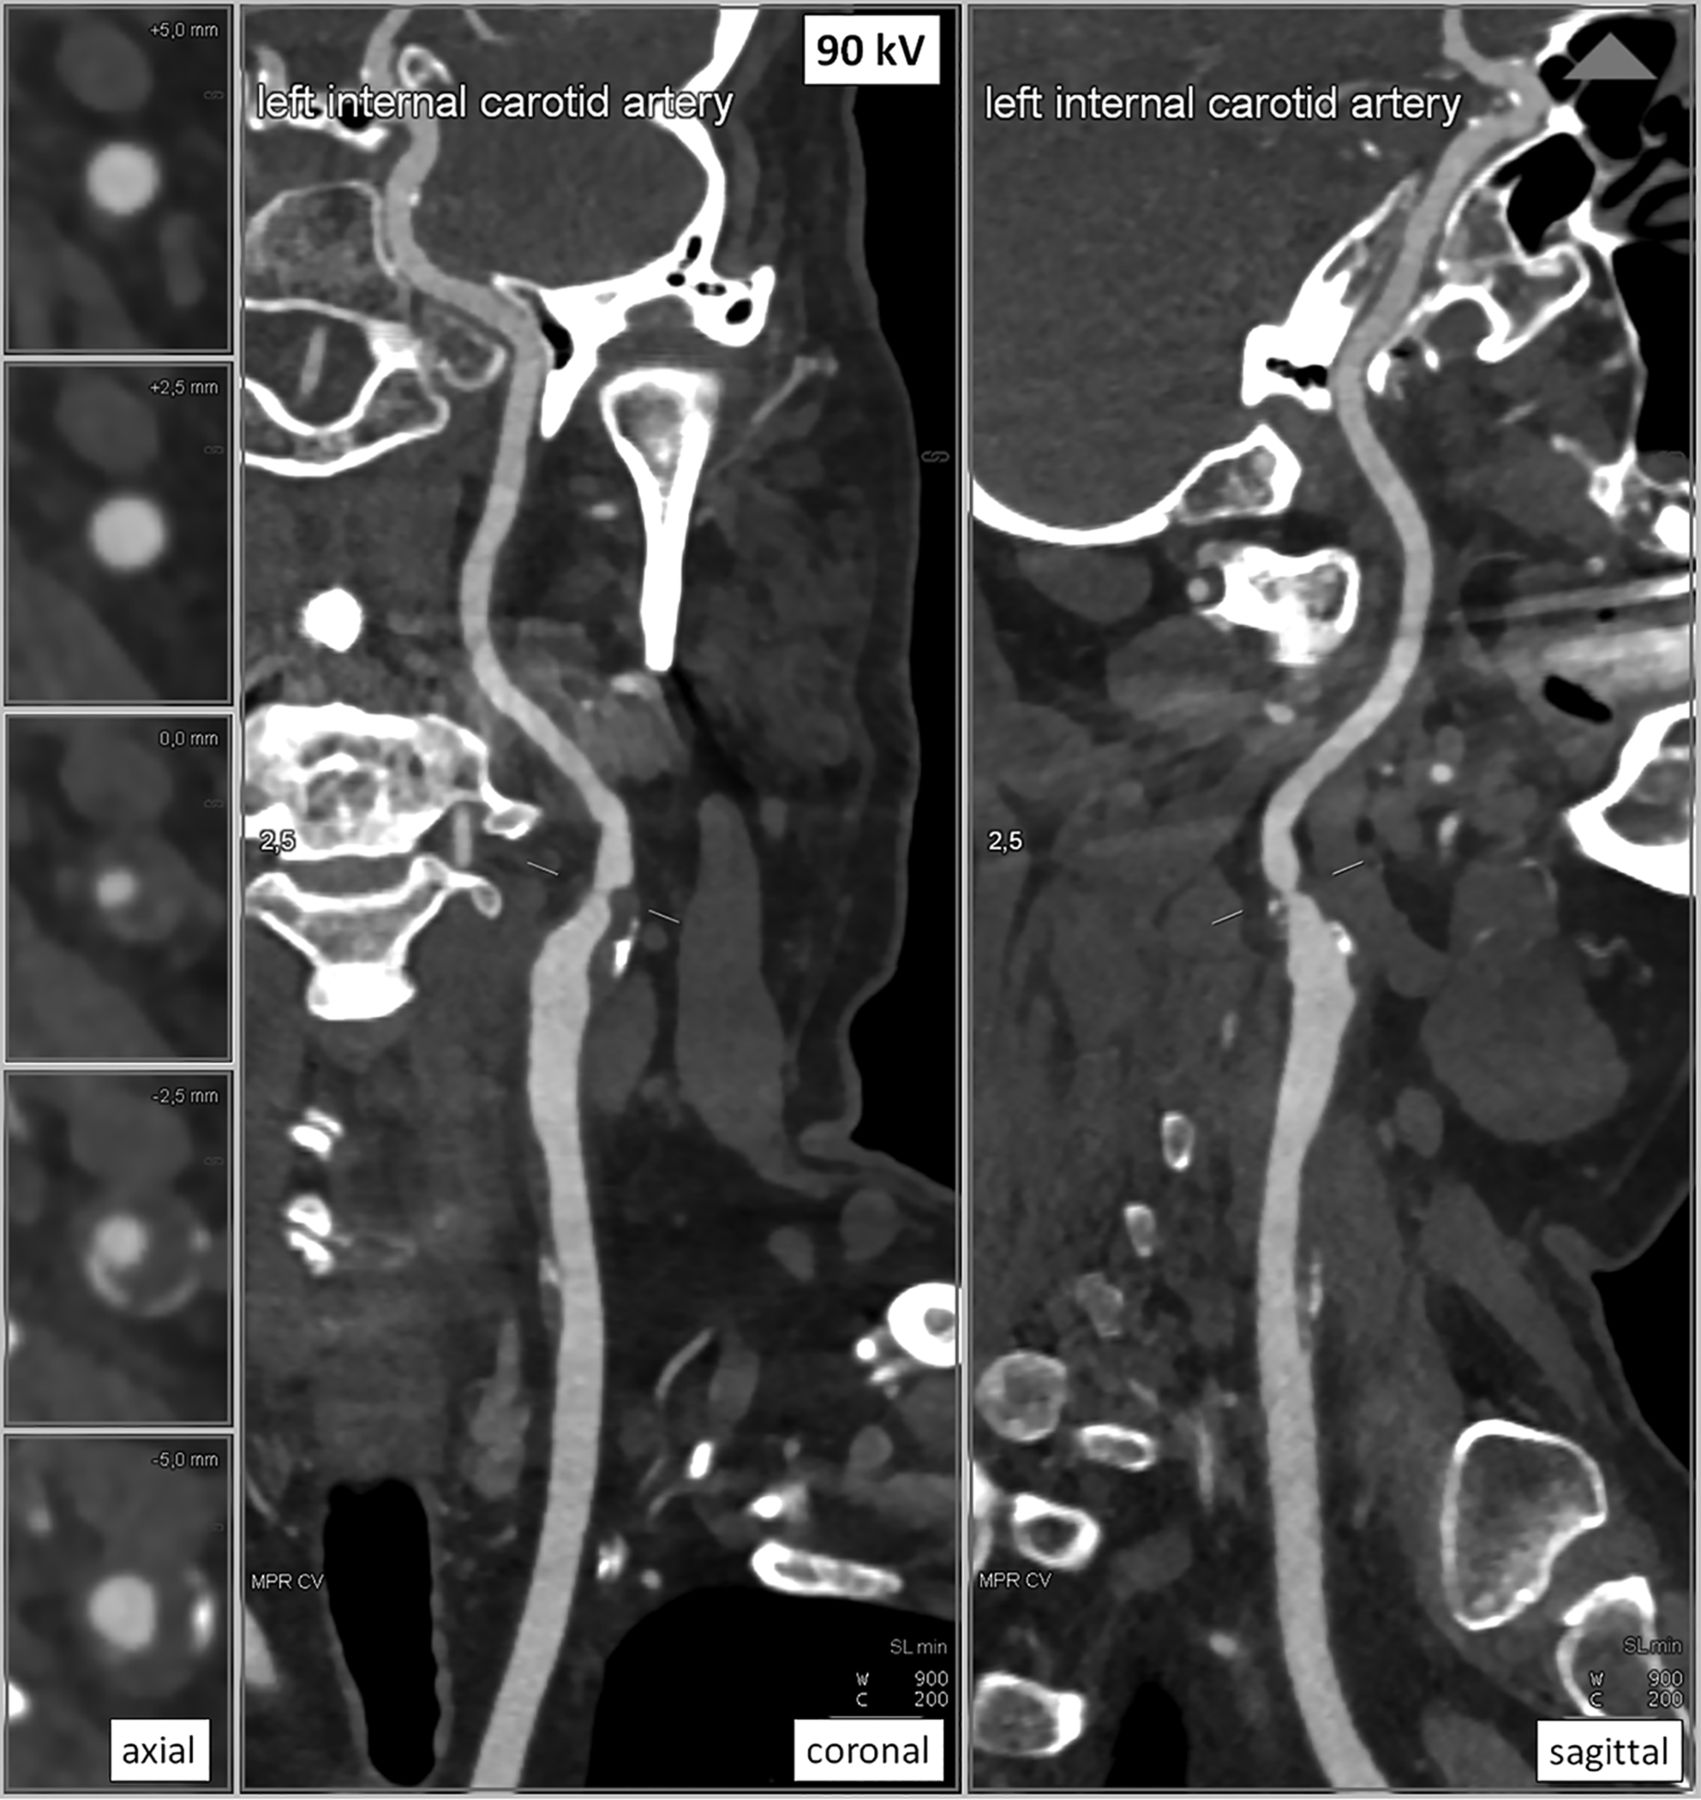
CT of a 69-year-old male patient of the control group (BMI, 31.6 kg/m2): curved MPR of the left side in 3 planes; 2.5-mm slice thickness; window level, 900 HU, and center, 200 HU. Low vessel contrast with excellent overall image quality (Likert 4), moderate stenosis of the internal carotid artery (NASCET 2), and artifacts from dental implants not affecting the diagnosis (Likert 2). The CTDIvol was 5.74 mGy, and the DLP was 202 mGy × cm.
Discussion
The lowest tube voltages provided a consistent overall image quality with very high dose efficiency in CTA of the carotids. The slight increase of image artifacts (example in Fig 1) compared with a protocol with automated individual tube voltage selection was nonsignificant and did not disturb the vessel reproduction.
Especially in CTA of the carotids, the lowest kilovolt approach seems promising, and adaptation of the tube voltage to the scout information may not be necessary in all cases. First, the examined volume of the head and neck usually does not have the volume and interindividual differences of, for example, examinations of the abdomen, where habitus and obesity are more likely to limit the extent of tube voltage reduction possible.22
Because of the relatively high iodine concentration in angiographic examinations, approaching the mean energy of the radiation spectrum to the k-absorption edge of iodine seems especially advantageous. Providing a strong increase of image contrast (Figs 2⇑–4) alleviates the disadvantages of potential elevations in image noise on the representation of the vessels, especially compared with soft-tissue examinations. Furthermore, radiation-sensitive organs like the thyroid gland and the ocular lenses are included in the exposed volume, so dose optimization should be of special interest.
In previous studies, higher image-noise levels in low-kilovolt protocols were described, compensated for by higher attenuation resulting in constant or even improved SNR/CNR in comparison with conservative protocols with fixed kilovolt levels for various body regions.12,17,20 Our study results showed, however, that the 70-kV study protocol provided comparable or even slightly lower image noise than the reference protocol. The latest high-end scanners are equipped with x-ray tubes that are optimized for high tube currents, especially at low tube voltages. The balanced image noise in this study might, therefore, be explained by these technical advantages, compared with previous studies. Different explanations could be the interindividual differences between the 2 randomized groups or the rather small ROI measurements due to the small vessel size, which are more prone to be biased.
The high tube current capacity of the system is also reflected by the decreased median tube voltage using the automated tube voltage selection algorithm in the reference group (80 kV), compared with the results of previous scanner generations seen in the literature (100 kV).17 Hence, modern scanners can boost the dose at very low tube voltages compared with earlier models. CNRD, which served as a figure of merit for radiation dose effectiveness in this study, was increased by 20% using the lowest tube voltage approach. However, these differences were statistically nonsignificant. The highest A, C, and also CNRD values were found in the 70-kV subgroup of the control group, which could be explained by the automated selection of smaller or thinner patients. This might also be reflected by the shorter mean volume coverage in the z-axis (34 cm) compared with the study group (37 cm).
Our results contradict Beitzke et al, 20 who found a significant reduction of image quality at the level of the shoulder girdle for patients with a BMI above 27 kg/m2 using 80 kV on a different CT system. Artifacts in that region did not affect the diagnosis in the control group and had little impact in the study group. The most limiting artifacts were reported around the contrast inflow in the venous system, which was not evaluated in particular in previous studies. The overall subjective image evaluation and evaluation of pathologic findings were of comparably high quality in both groups, without statistically significant differences (Figs 2⇑–4).
Some limitations have to be considered while interpreting our results. First, optimal timing of the contrast bolus is in direct relation to the vessel contrast, but the patient's physiology can strongly vary interindividually. Therefore, we sought to standardize the bolus timing using a test-bolus technique. The high intensity of artifacts around the contrast inflow could probably be reduced by further optimization of the injection protocols. Second, a transfer of these results to CTAs of other parts of the body (eg, aortic imaging) is difficult. The larger soft-tissue diameter of the chest and abdomen could overstrain the capacities of the x-ray tubes, resulting in increased image noise and artifacts. Third, our findings can only represent the evaluated CT system. A transfer to other tube-detector systems is strongly limited by the dedicated specifications. Fourth, we were only able to report diagnostic information about stenotic disease and assessment of the side branches of the external carotid artery. Other pathologies, for example dissections or aneurysms, should be systematically evaluated in future studies, especially if pooling of the contrast agent is likely to alter the visualization.
Conclusions
We demonstrate that the best radiation-dose efficiency in CTA of the carotids is provided by modern scanners using the lowest available tube voltage in a broad range of patients. The radiation dose can be reduced by about 20% in comparison with the state-of-the-art protocols with automated tube voltage adaptation, while the image quality is comparable.
Footnotes
Disclosures: Wolfgang Wüst—UNRELATED: Payment for Lectures Including Service on Speakers Bureaus: Siemens Speakers Bureau. Marc Saake—UNRELATED: Payment for Lectures Including Service on Speakers Bureaus: Siemens. Matthias M. May—UNRELATED: Consultancy: Siemens, Comments: coordination of educational courses; Payment for Lectures Including Service on Speakers Bureaus: Siemens, Comments: lectures and classroom courses. Rafael Heiss—UNRELATED: Payment for Lectures Including Service on Speakers Bureaus: member of Siemens Speakers Bureau. Michael Uder—UNRELATED: Grants/Grants Pending: Bayer Schering Pharma, Siemens.* *Money paid to the institution.
REFERENCES
- Received September 18, 2018.
- Accepted after revision May 26, 2019.
- © 2019 by American Journal of Neuroradiology


Jump to section
Related Articles
Cited By...
- No citing articles found.