
Abstract
BACKGROUND AND PURPOSE: Early detection of local recurrence is important to increase the chance of cure because local recurrence is the main cause of treatment failure in head and neck squamous cell carcinoma. We evaluated the added value of voxel-based color maps of dynamic contrast-enhanced MR imaging compared with conventional MR imaging alone for detecting local recurrence of head and neck squamous cell carcinoma.
MATERIALS AND METHODS: We retrospectively enrolled 63 consecutive patients with head and neck squamous cell carcinoma after definitive treatment and posttreatment surveillance MR imaging studies that demonstrated focal enhancement at the primary site. Three independent readers assessed conventional MR imaging and a pair of color maps of initial and final 90-second time-signal intensity areas under the curve from dynamic contrast-enhanced MR imaging. The sensitivities, specificities, and accuracies of both conventional MR imaging alone and combined interpretation of conventional and dynamic contrast-enhanced MR imaging were assessed using the clinicopathologic diagnosis as the criterion standard. κ statistics were used to evaluate interreader agreement.
RESULTS: There were 28 patients with subsequently documented local recurrence and 35 with posttreatment change. Adding dynamic contrast-enhanced MR imaging to conventional MR imaging significantly increased the diagnostic accuracies for detecting local recurrence (48%–54% versus 87%–91%; P < .05), with excellent interreader agreement (κ = 0.8; 95% CI, 0.67–0.92 to κ = 0.81; 95% CI, 0.69–0.93). By all 3 readers, the specificities were also significantly improved by adding dynamic contrast-enhanced MR imaging to conventional MR imaging (22%–43% versus 87%–91%; P < .001) without sacrificing the sensitivities (68%–82% versus 86%–89%; P > .05).
CONCLUSIONS: Adding voxel-based color maps of initial and final 90-second time-signal intensity areas under the curve from dynamic contrast-enhanced MR imaging to conventional MR imaging increases the diagnostic accuracy to detect local recurrence in head and neck squamous cell carcinoma by improving the specificity without sacrificing the sensitivity.
ABBREVIATIONS:
- CI
- confidence interval
- CE
- contrast-enhanced
- HNSCC
- head and neck squamous cell carcinoma
- DCE
- dynamic contrast-enhanced
- FAUC90
- final 90-second time-signal intensity area under the curve
- IAUC90
- initial 90-second time-signal intensity area under the curve
- SI
- signal intensity
- TSI
- time-signal intensity
Local tumor recurrence is the main cause (25.0%–54.9%) of treatment failures in head and neck squamous cell carcinoma (HNSCC).1⇓⇓–4 Because distant metastasis occurs less frequently than local recurrence, it is reasonable that posttreatment surveillance should focus on detecting local tumor recurrence to increase the chance of cure.5 Biopsies can be a dilemma in heavily irradiated tissue because biopsy procedure may increase the risk of superimposed infection, failure to heal, and increased edema.6 Therefore, diagnostic techniques should provide a better estimate of the likelihood of a recurrence and thus enable a more reliable selection of patients who should undergo pathologic examination.
Conventional and advanced imaging techniques, including diffusion-weighted MR imaging and FDG-PET, have shown variable results in distinguishing posttreatment change from recurrent or persistent disease.7 Dynamic contrast-enhanced (DCE)-MR imaging has emerged as a complementary technique for the posttreatment surveillance of patients with HNSCC and has shown promising results for distinguishing benign lesions from malignancies and predicting future treatment response.8⇓⇓–11 A quantitative DCE-MR imaging study by Ishiyama et al12 demonstrated that posttreatment changes had significantly higher permeability surface area than newly diagnosed or previously treated recurrent tumor. In addition to quantitative analysis, semiquantitative analysis of DCE-MR imaging can also be performed, offering the advantage of easier implementation, because it does not require the acquisition of baseline T1 mapping or arterial input function and does not rely on the assumptions of pharmacokinetic modeling. Regarding semiquantitative analysis, another previous study showed that benign postradiation changes had significantly longer time-to-peak and a lower relative washout ratio than recurrent tumors.13 A recent study showed that Kep (flux rate constant) and area under the gadolinium concentration-time curve were significantly higher in residual tumor, showing the potential of DCE-MR imaging to distinguish benign posttreatment change from residual HNSCC.14 Our recent studies using semiquantitative analysis of DCE-MR imaging have shown a significant difference in time-signal intensity (TSI) curve patterns between recurrence and posttreatment change15 and that histogram analysis of the ratios between the initial and final 90-second area under the TSI curve from DCE-MR imaging improves the sensitivity of MR imaging with 11% more recurrent tumors detected compared with conventional MR imaging without compromising diagnostic specificity.16 However, there are limitations in using both techniques in clinical practice. Considering that most recurrent tumors are mixed with posttreatment change, TSI curve analysis averaging dynamic characteristics of the individual voxels of the entire volume of interest cannot detect early tumor recurrence or select a proper biopsy site for pathologic confirmation due to loss of anatomic information. Histogram analysis might detect early recurrent tumors mixed with posttreatment change but cannot provide a visual guide to select a proper biopsy site either.
To overcome those limitations, we obtained voxel-based color maps of area under the curve (AUC) values extracted from TSI curves during the initial and final 90 seconds, to assess the voxel-by-voxel difference in signal intensity change according to the time lag. The study aimed to evaluate the feasibility and added value of visual assessment of voxel-based color maps using the initial and final AUC values of TSI curves derived from DCE-MR imaging to detect local tumor recurrence in patients with HNSCC after definitive treatment.
Materials and Methods
This case-controlled, retrospective cohort was approved by the institutional review board of Asan Medical Center, and acquisition of informed consent from patients was waived due to the retrospective nature of the study.
Study Patients
A review of the data base of our institution revealed 192 consecutive patients with pathologically confirmed HNSCC and surveillance MR imaging after definitive treatment between March 2014 and May 2015. Definitive treatment included curative resection, an operation and adjuvant radiation therapy, or concurrent chemoradiation. Among these, we found 135 patients with a focal moderate to intensely contrast-enhancing lesion at the primary site on fat-suppressed contrast-enhanced (CE) T1-weighted MR images and, finally, recruited 68 patients with a final diagnosis made by pathology or clinicoradiologic follow-up of >12 months. Subsequently, an independent neuroradiologist (J.Y.L., with 5 years of experience in head and neck imaging) who was not involved in the following image interpretation and data processing checked the image quality of DCE-MR imaging and excluded 5 patients with significant metallic artifacts, leaving 63 patients as a test patient group. Three of 63 patients have been previously reported.16 This prior article dealt with histogram analysis of DCE-MR imaging to evaluate local tumor recurrence in HNSCC, whereas in the current article, we investigated the feasibility of voxel-based color maps of DCE-MR imaging. Twenty patients were randomly selected as a separate patient group for a training session to distinguish among those with an enhancing lesion at the primary site but not confirmed as either recurrence or posttreatment change, to train readers and to minimize interreader variability (Fig 1).

Diagram of study population enrollment.
MR Imaging Acquisition and Generation of Voxel-Based Color Maps from DCE-MR Imaging
MR imaging examinations were performed with a 3T MR imaging scanner (Magnetom Skyra; Siemens, Erlangen, Germany) using a 64-channel head and neck coil. Our MR imaging protocol for head and neck tumors consists of axial and coronal T1- and T2-weighted turbo spin-echo sequences with DCE-MR images. All of the axial T1- (TR/TE = 790/11 ms) and T2-weighted images (TR/TE = 5470/85 ms) were acquired with an FOV = 190 × 190 mm2, matrix size = 448 × 291, and slice thickness = 3 mm without gap. DCE-MR imaging was performed in an axial plane with 3D controlled aliasing in parallel imaging results in higher acceleration (CAIPIRINHA) technique before, during, and after administration of a standard single-bolus administration of 0.1 mmol of gadoterate meglumine (Dotarem; Guerbet, Aulnay-sous-Bois, France) per kilogram of patient body weight dose with a rate of 4 mL/s. Dynamic acquisition was performed with a temporal resolution of 3.2 seconds, and contrast was administered after 11 baseline dynamics (total = 144 dynamics). Axial (TR/TE = 650/12 ms) and coronal (TR/TE = 540/11 ms) CE-T1WIs with fat suppression were obtained after DCE-MR imaging. Detailed imaging parameters for DCE-MR imaging are as follows: slice thickness = 3 mm without gap; 20 slices; z-axis coverage = 60 mm; spatial in-plane resolution = 184 × 160; TR/TE = 6.3/3.1 ms; flip angle = 15°; FOV = 19 cm; total acquisition time = 7 minutes 24 seconds.
The DCE-MR imaging data were transferred to a personal computer to process perfusion parametric maps with an in-house plug-in program, which was developed for DCE-MR imaging data processing by calculating the trapezoidal integration of normalized signal intensity (SI)17 using ImageJ software (National Institutes of Health, Bethesda, Maryland). The contrast index was calculated for the voxels on each DCE-MR image using the following formula: Contrast Index = [SI (Postcontrast) − SI (Precontrast)] / SI (Precontrast).16 The time course of the contrast index was plotted to obtain a TSI curve and the initial and final 90-second AUC TSI values (IAUC90 and FAUC90) for each voxel. IAUC90 was defined as the trapezoidal integration of the normalized TSI curve during the initial 90 seconds from the onset of contrast enhancement in the contrast-enhancing voxel, indicating a measurement of the initial arrival of contrast agent in the tissue of interest after intravenous bolus administration that reflects blood flow, vascular permeability, and the fraction of interstitial space.18 FAUC90 was defined as the trapezoidal integration of the normalized TSI curve during the last 90 seconds in the same contrast-enhancing voxel, with IAUC90, indicating the amount of contrast agent leakage within the extravascular extracellular space.19 The IAUC90 and FAUC90 values were then constructed to generate voxel-based color maps, which ranged from blue, green, yellow, to red (Fig 2). The SI of the enhanced tissue was displayed after normalization, relative to the unaffected prevertebral muscles on baseline images. The signal intensity of skeletal muscles was coded blue, and the vascular signal intensity exhibiting maximal enhancement was coded red. The average time for generating a pair of color maps in 1 DCE study was <2 minutes. Details for the postprocessing of the DCE-MR imaging data using the in-house-developed plug-in are described in the On-line Appendix and On-line Figs 1 and 2.
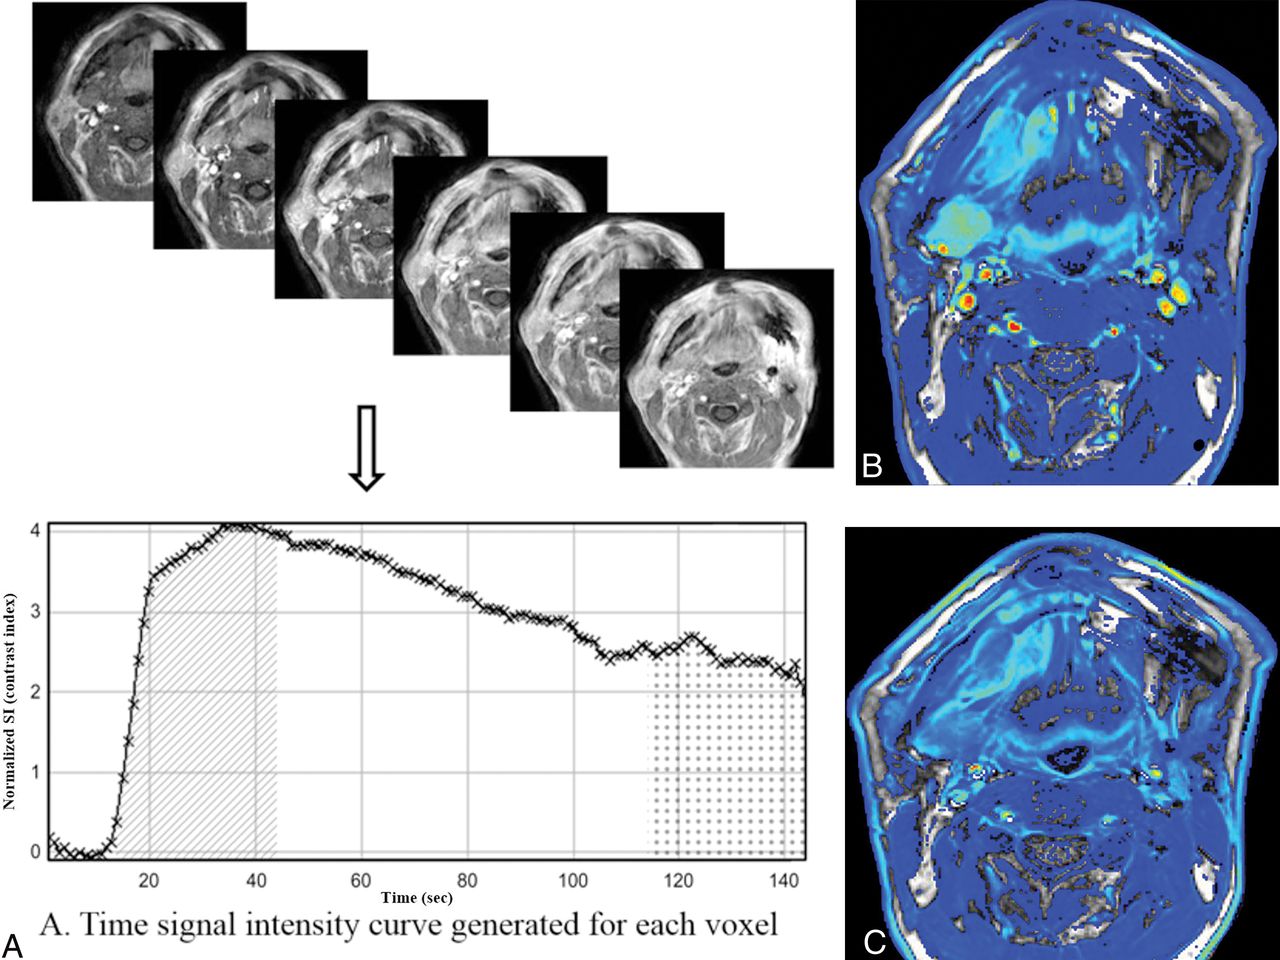
Illustration of the steps for generating color maps of initial and final 90-second AUC values using the TSI curve. A, The time course of the contrast index was plotted to obtain a TSI curve and the initial and final 90-second AUC values for each voxel. IAUC90 (diagonal pattern) and FAUC90 (dotted pattern) were defined as the trapezoidal integration of the normalized TSI curve during the initial and final 90 seconds from the onset of contrast enhancement in the voxel. B and C, Voxel-based color maps corresponding to IAUC90 and FAUC90 values were constructed in blue, green, yellow, and red.
Analysis of Conventional and DCE-MR Imaging Examinations
After reviewing axial CE-T1WI of 20 patients in the separate patient group to train readers, a neuroradiologist (K.L.C., with 7 years of experience), who was aware of the location of the primary tumor, constructed a TSI curve of DCE-MR imaging for the focal masslike enhancing lesion at the primary site using a hand-drawn ROI with ImageJ software. The ROIs were double-checked and supervised by another experienced neuroradiologist (J.H.B., with 20 years of experience). All ROIs were free from areas of necrosis or nontumor macrovessels depicted on structural images. The TSI curve was interpreted by the neuroradiologist as progressive increment (type 1), plateau (type 2), or washout (type 3). The same neuroradiologist drew a rectangular ROI on axial CE-T1WIs of the separate patient group used to train readers and the patient group to assess the diagnostic accuracy as a guide for visual assessment of voxel-based color maps by different readers.
Three neuroradiologists (J.H.L., Y.J.C., and H.W.K. with 16, 9, and 5 years of experience in head and neck imaging, respectively) conducted a visual assessment of voxel-based color maps of the separate patient group used to train readers to minimize interreader variability in their interpretation. For each patient, they assessed each pair of IAUC90 and FAUC90 images and then determined the patterns of the color change as progressive increment (type 1), plateau (type 2), and washout (type 3). The results were then correlated with those of the TSI curve-pattern analysis, and discrepancies were discussed to assess agreement. After the training session, they performed an independent analysis of the patient group to assess the diagnostic accuracy blinded to the final diagnosis using the same methods. They regarded type 2 (plateau) or type 3 (washout) as a recurrent tumor and type 1 (progressive increment) as a posttreatment change.10,15,20,21
All 3 neuroradiologists performed a blinded review of conventional MR images of the patient group to test the diagnostic accuracy to detect recurrent tumor or posttreatment change, and those results were used to investigate the added value of voxel-based color maps over conventional MR imaging. Image sets included axial T2-weighted images,T1WIs, fat-suppressed CE-T1WIs, and coronal fat-suppressed CE-T1WIs. The interpretation of conventional MR imaging was performed according to the following criteria22⇓–24: Recurrent tumors were defined as a focal mass discriminated by the surrounding tissue, with intermediate to slightly high signal intensity on T2WI, low signal on T1WI, and moderate-to-strong enhancement after gadolinium administration. Degree of enhancement was defined as “moderate” when enhancement was weaker than mucosal enhancement but greater than skeletal muscles. “Strong enhancement” was defined when the degree of enhancement was similar to or stronger than mucosal enhancement. “Posttreatment change” was defined as a fibrous scar on any focal linear or triangular enhancing lesion with very low signal intensity on T2WIs and low signal intensity on T1WIs, and “posttreatment inflammation,” as a diffuse hyperintense abnormality on T2WIs with strong contrast enhancement. Results of conventional MR imaging analysis for the detection of recurrent tumor were classified into very probable = 1, somewhat probable = 2, somewhat unlikely = 3, and unlikely = 4.
Interpretation of both conventional and DCE-MRIs was conducted with a 1-month interval from the interpretation session for conventional MR imaging alone. To assess the added value of DCE-MR imaging, we accepted the result on DCE-MR imaging with only score 2 or 3 on conventional MR imaging. Score 1 or 4 on conventional MR imaging was accepted as a final interpretation result regardless of the pattern on DCE-MR imaging.
Statistical Analysis
Pathology or clinicoradiologic follow-up for at least 12 months was the diagnostic reference standard for interpretation of conventional MR imaging and voxel-based color maps of DCE-MR imaging. To compare clinical characteristics between groups, we conducted the χ2 or Fisher exact test for categoric variables. Student t and the Mann-Whitney U test were performed for the comparison of continuous variables after checking the normality with the Kolmogorov-Smirnov test. The sensitivity, specificity, positive and negative predictive values, and accuracies of the conventional MR imaging alone and the combined interpretation of conventional and DCE-MRIs were calculated for differentiation of recurrent tumor and posttreatment change, with score 1 on conventional MR imaging or score 2 on conventional MR imaging with either type 2 or 3 on DCE-MR imaging being considered recurrence. Comparison of the sensitivity, specificity, positive predictive value, negative predictive value, and accuracy of conventional MR imaging alone and the combined interpretation of conventional MR imaging and color maps of DCE-MR imaging was performed using a generalized estimating equation model. The Cohen κ coefficient was used to measure interreader agreement of the results of DCE-MR imaging voxel-based color maps among 3 readers and agreement of the results between the TSI curve pattern and voxel-based color maps in the training session. All statistical analyses were performed using MedCalc for Windows, Version 13.0 (MedCalc Software, Mariakerke, Belgium) and SAS 9.4 software (SAS Institute, Cary, North Carolina). The significance threshold for the differences was set at a P value < .05.
Results
The patient group to test the diagnostic accuracy included 47 men (mean age, 59 years; range, 25–84 years) and 16 women (mean age, 59 years; range, 33–79 years) with a mean age of 59 years range, 25–84 years). There were 35 patients (male/female ratio = 29:6) with posttreatment change and 28 (male/female ratio = 18:10) with local tumor recurrence. All cases with local recurrence were located at the area of the primary site. Local tumor recurrence was confirmed by pathologic examination (n = 18, 64%) or size increase during follow-up (n = 10, 36%). Posttreatment change was confirmed by pathologic examination (n = 7, 20%) or a decrease or no growth of the abnormal enhancing lesion without any treatment by at least 12-month follow-up imaging (n = 28, 80%). The median time interval between the end of definitive treatment and the detection of an enhancing lesion in the primary site was 26.3 months (range, 12–60 months) for all patients in the test group, 27.0 months (range, 12–60 months) for the posttreatment-change group, and 24.0 months (range, 10–41 months) for the recurrence group, respectively. All enhancing lesions were detected during routine imaging surveillance in asymptomatic patients. There was no significant difference in demographic data or treatment modalities between the 2 subgroups. Descriptive statistics regarding the demographic and clinical data obtained in both test and training groups are summarized in Table 1.
Clinical characteristics of patients in training and test groupsa
Among the separate patient group to train readers, TSI curve patterns were classified into type 1 in 12 (60%), type 2 in 5 (25%), and type 3 in 3 (15%) patients. Voxel-based color maps were classified into type 1 in 11 (55%), type 2 in 6 (30%), and type 3 in 3 (15%) patients by visual assessment. Agreement between the TSI curve pattern and visual assessment of voxel-based color maps was excellent (κ = 0.96; 95% CI, 0.89–0.98; P < .001).
Table 2 shows the detailed results of analysis of conventional MR imaging and the combined approach of conventional MR imaging and DCE-MRI for detection of local tumor recurrence after evaluation of the patient group to test diagnostic accuracy. False-positive and false-negative rates from Table 2 were 57%–77% and 18%–32% for conventional MR imaging and 9% and 11%–18% for the combined interpretation of conventional and DCE-MRI by 3 readers, respectively. There was a 48–68 percentage point and 4–14 percentage point reduction in both false-positive and false-negative rates by combined interpretation compared with conventional MR imaging alone. Agreement between the TSI curve pattern and visual assessment of voxel-based color maps was excellent among 3 readers in the patient group to test diagnostic accuracy (κ = 0.86; 95% CI, 0.75–0.96 to κ = 0.87; 95% CI, 0.77–0.97). Interreader agreement for interpretation of voxel-based color maps of DCE-MR imaging was also excellent (κ = 0.80; 95% CI, 0.67–0.92 to κ = 0.81; 95% CI, 0.69–0.93).
Results of analysis of conventional MRI alone and combined interpretation of conventional and DCE-MRI for detecting local tumor recurrence
Table 3 summarizes diagnostic accuracies of conventional MR imaging alone and combined interpretation of conventional and DCE-MRIs. Diagnostic accuracies of conventional MR imaging by all 3 readers were significantly increased from 48%–54% to 87%–91% by adding DCE-MR imaging to conventional MR imaging in all patients (P < .05). The specificities were also significantly improved by adding DCE-MR imaging to conventional MR imaging (22%–43% versus 87%–91%; P < .001) without sacrificing the sensitivities (68%–82% versus 86%–89%; P > .05). Figures 3⇓–5 are representative cases.
Diagnostic accuracies of conventional MRI alone and combined interpretation of conventional and DCE-MRI for detecting local tumor recurrencea

A 53-year-old man after hemiglossectomy for squamous cell carcinoma of the oral tongue 12 months previously (T2N0M0; depth of invasion, 10 mm). A and B, T2-weighted and contrast-enhanced fat-suppressed T1-weighted images show an ill-defined enhancing lesion at the operative bed of the oral tongue (arrows). C and D, IAUC90 and FAUC90 images of DCE-MR imaging show contrast washout at the corresponding area. E, The time-signal intensity curve obtained from the enhancing area using a hand-drawn ROI also shows contrast washout. This lesion was confirmed as recurrent tumor on subsequent surgical excision.

A 40-year-old female patient after wide excision for buccal cancer 36 months previously (T1N0M0). T2-weighted image shows a low signal intensity lesion in the right retroantral region (A) with heterogeneous contrast enhancement on contrast-enhanced fat-suppressed T1-weighted imaging (B) (arrows). IAUC90 (C) and FAUC90 (D) images of DCE-MR imaging show a progressive increment pattern. Time-signal intensity curve obtained at the enhancing portion also shows a progressive increment pattern (E). This lesion was confirmed as fibrosis at excisional biopsy.

A 48-year-old female patient after wide excision and flap reconstruction for right-tongue cancer 13 months previously (T1N0M0). T2-weighted image (A) shows a slightly high signal intensity lesion posterolateral to the reconstructed flap with moderate contrast enhancement on the T1-weighted image (B, arrows). IAUC90 (C) and FAUC90 (D) images of DCE-MR imaging show a prolonged enhancement pattern. The time-signal intensity curve obtained at the enhancing portion also shows a prolonged enhancement pattern (E). This lesion was confirmed as dense fibrosis at excisional biopsy.
Discussion
Differentiating residual or recurrent tumor from posttreatment change is a clinically challenging decision, resulting in high false-positive rates (26%–46%) using conventional MR imaging criteria.25,26 FDG-PET has also been widely used to detect recurrent tumor due to its low false-negative rates and high negative predictive values for local tumor recurrence.27 However, low specificity might be a problem of PET/CT due to posttreatment granulation tissue and inflammatory changes.27
In this study, we demonstrated that visual assessment of voxel-based color maps of DCE-MR imaging is both feasible and technically valid for detecting local tumor recurrence at the primary site in patients with HNSCC during surveillance. When conventional MR imaging showed low specificity for distinguishing recurrence from posttreatment change, there was significant improvement of the specificity and accuracy without sacrificing sensitivity when conventional and DCE-MRIs were interpreted together. Hence, we conclude that voxel-based color maps of DCE-MR imaging might be useful to rule out the probability of local tumor recurrence as a complementary tool to conventional MR imaging during posttreatment surveillance. We believe that this technique has the potential to reduce unnecessary biopsy or imaging studies and to lead to a more targeted diagnostic and therapeutic approach with reduced complications by improving the diagnostic accuracy of conventional MR imaging.
Previous studies on the diagnostic performance of conventional MR imaging for local tumor recurrence showed a wide variation in the diagnostic sensitivity (84%; 95% CI, 72%–92%) and specificity (82%; 95% CI, 72%–89%), according to a recent meta-analysis.28 In our study, the specificity of conventional MR imaging was relatively low, which might be attributable to our strict interpretation criteria: We considered any focal enhancement inconsistent with posttreatment scar or inflammatory change as recurrent tumor. In contrast, DCE-MR imaging has the potential of low sensitivity compared with conventional MR imaging due to the relatively low signal-to-noise ratio and the spatial resolution of the color maps and the variable degree of enhancement from posttreatment change. However, our results demonstrated that morphologic information with conventional MR imaging and functional information with color maps of DCE are complementary and might contribute in different ways to improvement of overall diagnostic performance. Therefore, combined interpretation of conventional and DCE-MRIs might be more practical and accurate during posttreatment surveillance of patients with HNSCC.
DCE-MR imaging has been useful in differentiating recurrent tumor from posttreatment change in head and neck cancer as well as in other anatomic areas. Previous studies revealed that enhancement patterns after gadolinium contrast injection differed between malignant and benign lesions: Early enhancement and washout corresponded to recurrence, while a progressive enhancement pattern corresponded to benign lesions, including fibrosis.10,29,30 Our study used the same methodology as the previous studies and revealed the feasibility and repeatability of using voxel-based color maps of IAUC90 and FAUC90 values from DCE-MR imaging in differentiating recurrent tumor from posttreatment change in HNSCC. Increased IAUC90 values in recurrent tumors are a reflection of increased blood flow and contrast agent leakage to the extravascular extracellular space, related to the hypervascularity and neoangiogenesis of malignant tumor. A progressive increase in FAUC90 in posttreatment change is due to increased retention of contrast agent in the extravascular extracellular space due to low cellularity.19
On DCE-MR imaging, model-based pharmacokinetic DCE parameters are quantitative, having the potential to measure “true” physiologic mechanisms such as blood flow and permeability. However, model-based DCE parameters is difficult to apply in clinical practice for several reasons, including arterial input function measurement and model fit instability.31 AUC during a given time is a model-free parameter that describes the uptake of the contrast agent in a tissue of interest. It has advantages over the model-based approach because it does not require arterial input function measurement and does not need complex postprocessing pharmacokinetic modeling.18 In addition, the model-free technique is more robust, is unlikely to be influenced by scan sequence variation, and is easier and more reproducible compared with the model-based method.32
The current study emphasizes the usefulness of visual assessment of voxel-based color maps. Many recurrent tumors occur intermixed with posttreatment changes. Because the TSI curve itself has averaged hemodynamic characteristics of the entirety of voxels in the ROI, the TSI curve has inherent limitations. If there is only a small focal area of recurrent tumor showing washout or a plateau pattern within the entire enhancing lesion, TSI curve analysis may overlook a small focus of viable tumor. To overcome this limitation, histogram-based assessment can be an alternative method because it allows comprehensive evaluation of an entire lesion volume. However, both time and effort to obtain the histogram parameters are required for all patients during daily practice. Voxel-based color maps may compensate for the drawbacks of TSI curve-pattern analysis and histogram analysis. While TSI curve analysis and histogram analysis need an ROI segmentation to extract a TSI curve or AUC-derived parameters, voxel-based color maps can provide simple and visually intuitive images and can help radiologists differentiate recurrent tumor from posttreatment change.
Our study has several limitations. In addition to the retrospective nature, the small sample size may diminish the statistical validity of the results. Future research with a large prospective cohort could further validate the methodology. Second, our study did not investigate any difference in the TSI curve pattern according to the status of human papillomavirus or Epstein-Barr virus, histologic tumor grade, or lesion volume. Given that these factors might affect the TSI curve pattern on DCE-MR imaging, the use of a fixed time interval on the TSI curve for voxel-based color maps can be another limitation. Again, additional investigation with a larger sample size may be necessary to verify the preliminary results of the study. Third, our study included patients with various tumor locations, which could present different natural histories. However, we believe that the coherent results of our study reflect the histologic consequences of an operation or chemoradiation that are common (granulation tissue and fibrosis), irrespective of the tumor location. Further studies might be necessary to evaluate any difference in the dynamic features of DCE-MR imaging according to a specific tumor subsite.
Conclusions
We demonstrated that adding visual assessment of voxel-based color maps of IAUC90 and FAUC90 derived from DCE-MR imaging is both a technically valid and reliable method for detecting local tumor recurrence at the primary site in patients with HNSCC during surveillance. Combined interpretation of both conventional and DCE-MRIs can be useful in ruling out the probability of a locally recurrent tumor by improved diagnostic specificity without sacrificing sensitivity.
Footnotes
Ji Ye Lee and Kai Lun Cheng contributed equally to this work.
Disclosures: Jung Hwan Baek—UNRELATED: Consultancy: RF Medical and StarMed since 2017.
REFERENCES
- Received January 4, 2018.
- Accepted after revision June 17, 2019.
- © 2019 by American Journal of Neuroradiology


