
Abstract
BACKGROUND AND PURPOSE: Tumor recurrence is difficult to predict in patients receiving laser ablation for intracranial malignancy. We assessed the efficacy of the initial area under the time-to-signal intensity curve at 60 seconds (iAUC60) from dynamic contrast-enhanced MR imaging in predicting progression-free survival in patients with brain metastases following laser interstitial thermal therapy.
MATERIALS AND METHODS: The study population was a consecutive series of patients undergoing laser interstitial thermal therapy for brain metastases. Patient demographics including age, sex, tumor histology, and Karnofsky Performance Scale were collected prospectively. Preoperative, postoperative, and 1-month follow-up dynamic contrast-enhanced MRIs were analyzed. Values of iAUC60 were computed using a trapezoidal rule applied to the time history of contrast uptake over the first 60 seconds postenhancement. The change in iAUC60 (ΔiAUC60) was calculated by taking the difference between the values of iAUC60 from 2 time points. Pearson correlation coefficients were calculated between progression-free survival, defined as the time from laser interstitial thermal therapy to tumor recurrence, and iAUC60 or ΔiAUC60 values.
RESULTS: Thirty-three cases of laser interstitial thermal therapy for 32 brain metastases in a cohort of 27 patients were prospectively analyzed. A significant relationship was observed between the values of iAUC60 from postoperative dynamic contrast-enhanced MR imaging and progression-free survival with Pearson correlation (P = .03) and Cox univariate analysis (P = .01). The relationship between preoperative and 1-month follow-up dynamic contrast-enhanced MR imaging was not significantly correlated with progression-free survival. Similarly, no statistically significant relationship was observed with ΔiAUC60 and progression-free survival between any time points.
CONCLUSIONS: Progression-free survival is difficult to predict in patients undergoing laser interstitial thermal therapy for brain metastases due to confounding with posttreatment change. iAUC60 extracted from postoperative dynamic contrast-enhanced MR imaging shows promise for accurately prognosticating patients following this operative therapy.
ABBREVIATIONS:
- DCE-MRI
- dynamic contrast-enhanced MRI
- ΔiAUC60
- change in iAUC60
- HR
- hazard ratio
- iAUC60
- initial area under the time-to-signal intensity curve at 60 seconds
- LITT
- laser interstitial thermal therapy
- PFS
- progression-free survival
- RN
- radiation necrosis
- ROC
- receiver operating characteristic
Metastases are the most common underlying cause of intracranial tumor, occurring in approximately 10% of all patients with systemic malignancy.1,2 Laser interstitial thermal therapy (LITT) is emerging as a minimally invasive technique for reducing intracranial tumor burden in these patients. The development of real-time temperature feedback with MR thermography has made the intracranial application of LITT possible by minimizing collateral damage to adjacent tissue.3 However, tumor recurrence on the margins of the ablation zone remains a challenge to predict, due to confounding with posttreatment changes.4,5 A methodology for predicting recurrence from analysis of post-LITT ablation cavities on advanced MR imaging would be valuable for developing accurate prognoses, guiding future treatment, and illustrating points of LITT technique improvement to optimize ablation and prolong progression-free survival (PFS).
Dynamic contrast-enhanced MR imaging (DCE-MRI), a dynamic T1-weighted perfusion imaging technique, can be used to characterize the vasculature of tissue from which many quantifiable physiologic and nonphysiologic variables can be extracted.6,7 The initial area under the time-to-signal intensity curve at 60 seconds (iAUC60) is one such quantitative parameter that has been evaluated due to ease of implementation and indirect reflection of blood flow and vascular permeability in a tissue ROI.6 Recent studies have reported numerous successful applications of iAUC60 from treatment-response monitoring in breast cancer to prediction of local recurrence in head and neck cancer.8,9 iAUC60 has been further applied to aiding complex differential diagnoses in the field of neuro-oncology, particularly in distinguishing radiation necrosis from tumor recurrence in patients undergoing radiation therapy for intracranial tumors.10⇓–12 This study evaluates the utility of iAUC60 from DCE-MR imaging in the prediction of PFS in patients with brain metastases following LITT.
Materials and Methods
Study Design and Subjects
This study was performed with approval from our institutional review board with regard to the study of human subjects. Patients who received LITT from May 2016 through August 2017 were enrolled in the study. Inclusion criteria were cerebral metastases from a primary extracranial tumor confirmed by histopathologic analysis. Local recurrence was determined by a neuroradiologist at our institution applying the Response Assessment in Neuro-Oncology Criteria for Brain Metastases (RANO-BM) to follow-up MR imaging at 1-month intervals following LITT (eg, 30 days, 60 days, and so forth).13 The time from LITT to follow-up MR imaging at which local recurrence was determined was recorded as PFS. If no local recurrence was observed, the time to last follow-up MR imaging was recorded and the patients were right-censored for PFS analysis. For patients undergoing LITT for >1 lesion, recurrence was defined for each individual lesion. Deep-seated location of the tumor was defined as the location in the white matter or basal ganglia. The following data were extracted from the electronic medical record: age, sex, tumor histology, tumor location, date of LITT procedure, and neurologic status in the form of Karnofsky Performance Scale preoperatively, postoperatively, and at first follow-up.
Operative Technique
All LITT procedures were performed at our institution in an intraoperative MR imaging suite using a Magnetom Espree 1.5T bore (Siemens, Erlangen, Germany) with the NeuroBlate (Monteris Medical, Minneapolis, Minnesota) system. The details for the technical aspects of LITT at our institution have been previously described.14
Image Analysis
Tumor volume and extent of ablation data were obtained from the iPlan workstation (Brainlab, Munich, Germany) for treatment planning and ablation surveillance. Manual, tridimensional tumor segmentation was completed by a neuroradiologist preoperatively using postcontrast T1-weighted MR imaging. The residual tumor volume was calculated by subtracting the volume of the ablation cavity within the tumor volume using iPlan software.
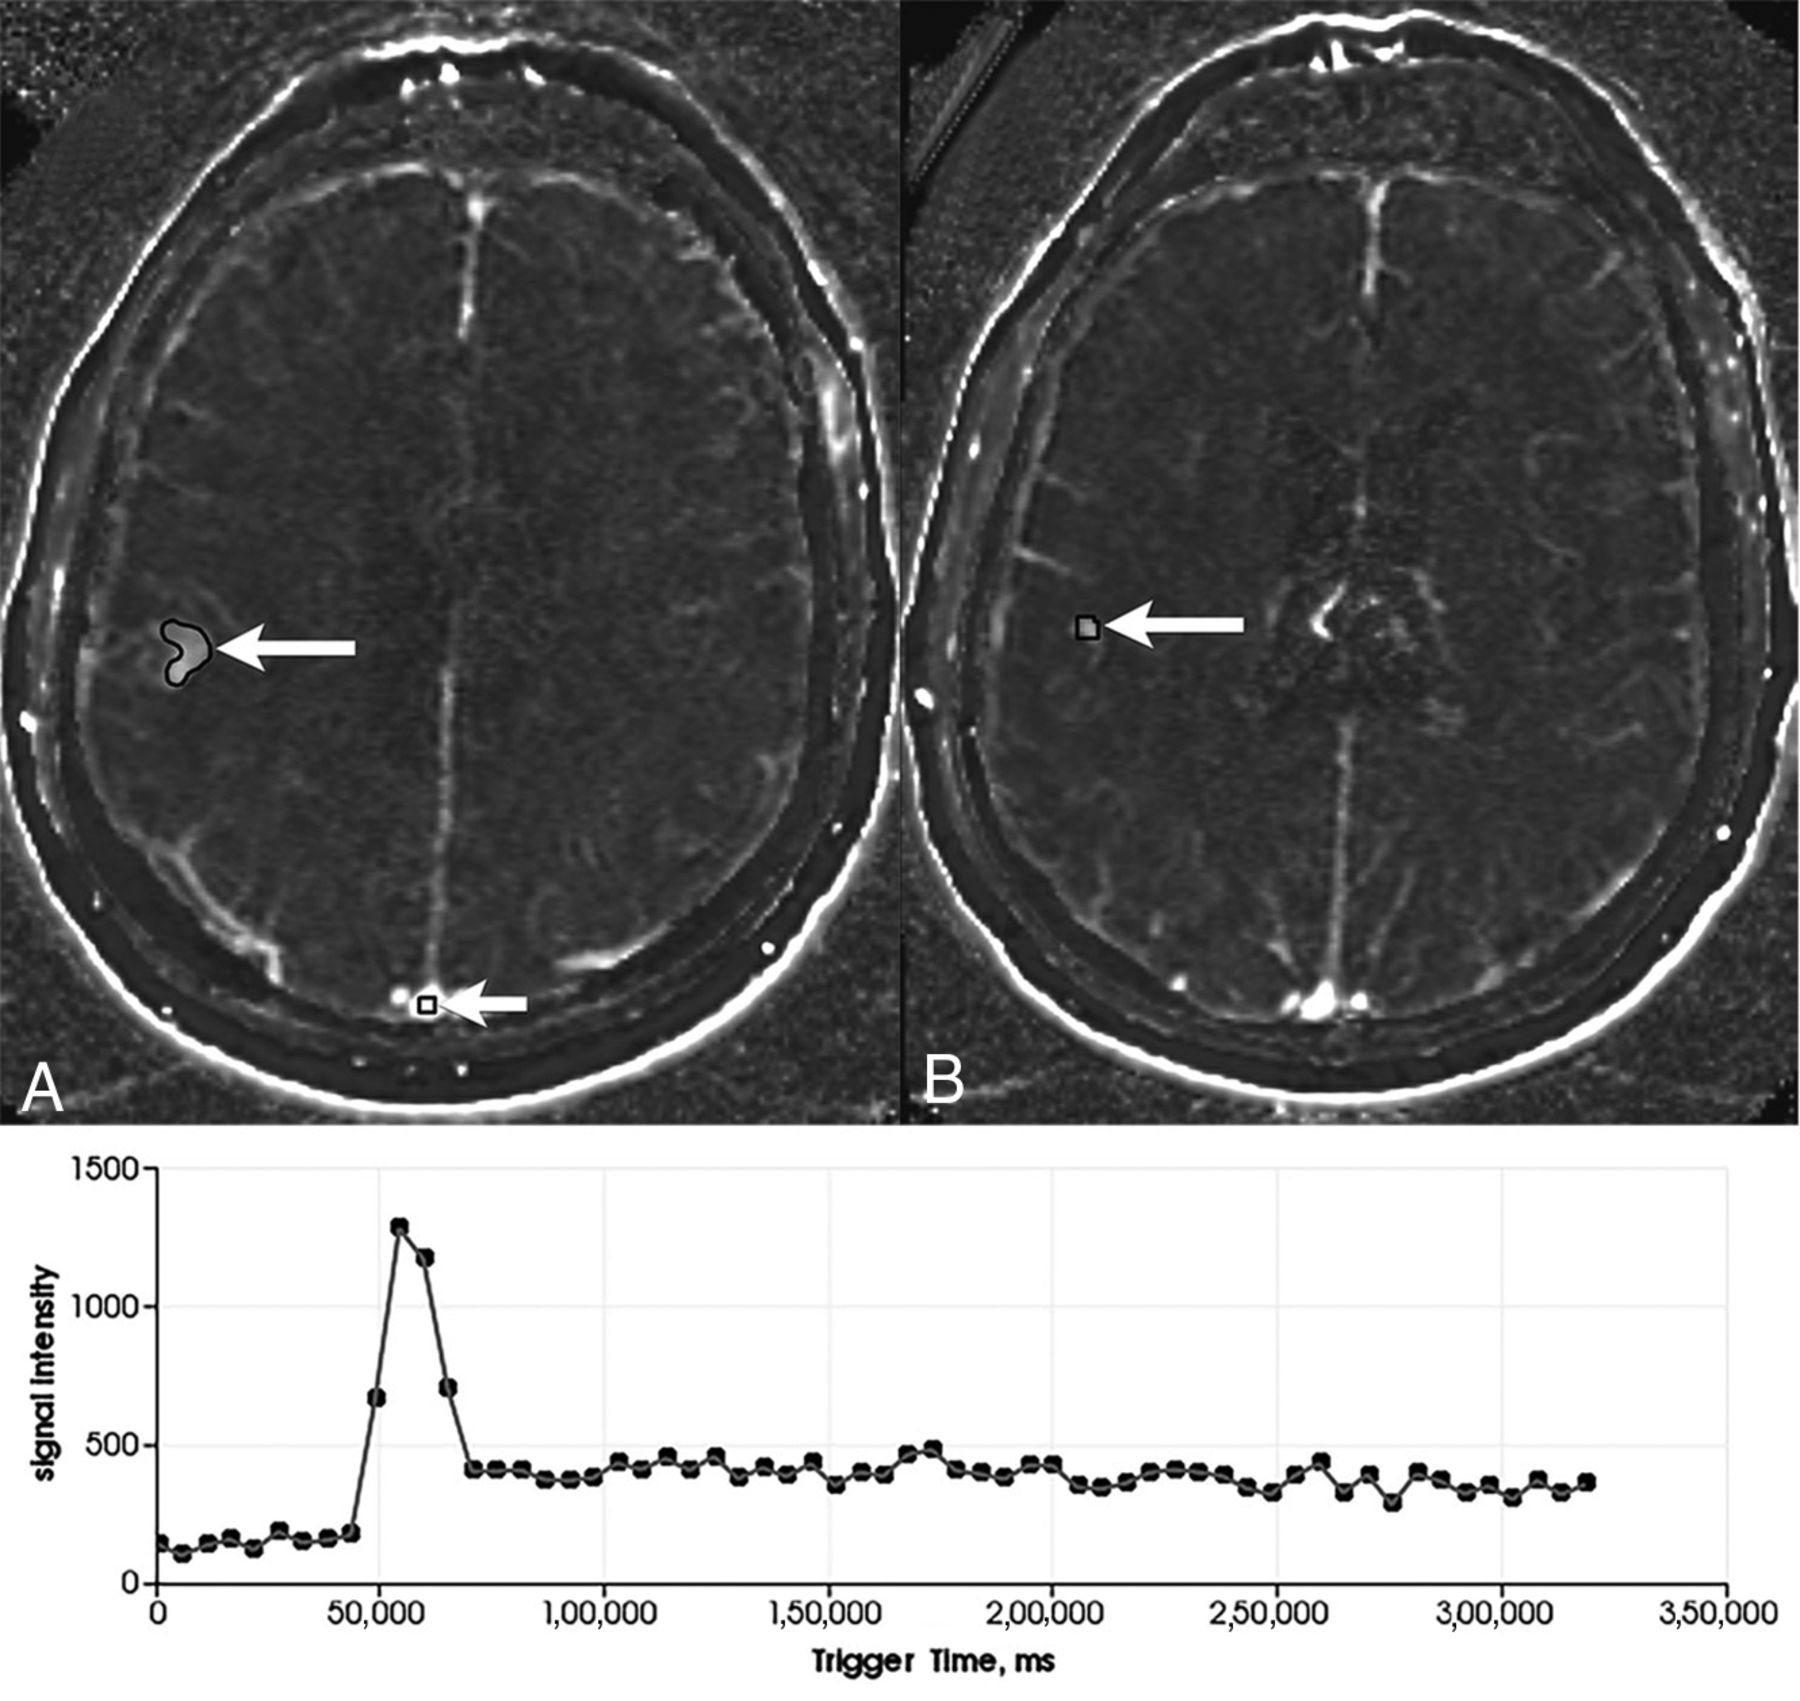
DCE-MR images were obtained preoperatively and at 1-month follow-up. Immediate postoperative DCE-MRIs were not initially part of the study protocol. However, an amendment was later made to include imaging at this time point. Thus, there were fewer immediate postoperative DCE-MRIs to analyze than at other time points. ROIs from preoperative images were identified as the entire tumor and manually drawn as masks in 3D Slicer (https://www.slicer.org/) using the Editor module.15 ‘Egg-shell’ enhancement along the margin of the postablation cavity is a normal finding in the postoperative period on T1-weighted postcontrast MR imaging that does not denote residual or recurrent tumor.16 Thus, in postoperative and follow-up DCE-MRIs, a subvolume mask of the brightest, contiguous region of thick enhancement, if present, in the ablation cavity was obtained by 3 separate users (Fig 1). For cases in which a thick region of enhancement in the ablation cavity was not identified, a mask of the entire ablation cavity was obtained instead. A 2 × 2 × 1 voxel control mask was also drawn in the superior sagittal sinus of each case. Using a technique described by Chung et al,11 we extracted iAUC60 values by integrating the iAUC60 from 0–60 seconds after bolus arrival from intravenous contrast agent administration. iAUC60 values were then calculated for each pixel in the ROI mask using a trapezoidal rule. iAUC60 values were normalized to the average signal intensity before the bolus arrival. The bolus arrival time was obtained from a manually placed arterial input function on the superior sagittal sinus. The arrival time was calculated as the maximum time derivative in signal intensity. A single bolus arrival time was averaged across the ROI. This method of semiautomatic segmentation of the ROI and automatic iAUC60 calculation based on the time to signal intensity is similar to the technique described by Choi et al.17 The median of the subvolume iAUC60 values for postoperative and follow-up DCE-MRIs from the 3 users was then used for further analysis. The change in iAUC60 (ΔiAUC60) was also calculated by taking the difference between iAUC60 values between pre- and postoperative DCE-MR imaging as well as postoperative and 1-month follow-up imaging.

Screenshots from 3D Slicer showing an outline of the masks (white arrows) delineating a metastatic lesion in the right frontal lobe from breast cancer on an axial plane DCE-MRI. (A) shows the metastasis as well as the 2 × 2 × 1 voxel control mask in the superior sagittal sinus, while (B) shows the same lesion mask two slices inferiorly. Also shown is the arterial input function of the contrast history at a single pixel (lower part).
Statistical Analysis
All statistical analyses were completed in R statistical and computing software (http://www.r-project.org) using the Survival,18 Caret,19 and pROC20 packages. Scatterplots and survival curves were created in R using the ggplot221 and survminer22 packages. Patients with no progression on follow-up imaging were right-censored on the basis of the date of last MRI. Cox univariate analysis was used to evaluate the significance of iAUC60 from preoperative, postoperative, and 1-month follow-up in predicting PFS and was presented with a level of significance (P value), hazard ratios (HRs), and CI. Correlations between PFS and iAUC60 values were assessed with the Pearson correlation coefficient (r) and presented with the level of significance (P value) and CI. Patients without observed local recurrence, either by loss to follow-up or death, were censored for PFS statistical analysis. Cases censored after 100 days were included in correlation analysis (PFS and iAUC60). A receiver operating characteristic (ROC) curve was constructed to identify iAUC60 thresholds for statistically significant relationships using the Youden Index and was reported with sensitivity and specificity values, area under the ROC curve, and a confusion matrix of prediction values.23 To construct the ROC curve, we binarized PFS outcomes to local recurrence status at 6 months from LITT therapy. A P value < .05 was considered significant. Similarly, CIs were set at 95% confidence.
Results
Patient Demographics
Patient demographics and clinical features are summarized in Table 1. A total of 32 brain metastases of the cohort of 27 patients were analyzed. LITT was used for 2 separate metastases in 4 patients (15%). One patient with 2 intracranial metastases from breast cancer lesions underwent LITT 3 times (n = 33), once for a lesion in the posterior fossa and twice for a lesion in the corpus callosum. Deep-seated locations were identified in 6.3% of cases (n = 1 corpus callosum, n = 1 basal ganglia). Of the 33 total lesions, 51.5% (n = 17) were completely ablated during the LITT procedure. Of the 16 remaining lesions, the median volume of the residual tumor was 0.50 cm3 (range, 0.03–4.61 cm3). Regional posttreatment enhancement was observed in 80% (n = 16) of the 20 total patients for which immediate postoperative DCE-MR imaging was available. Of the 16 total patients with observed regional enhancement on postoperative DCE-MR imaging, 50% (n = 8) were observed to experience local progression. Of the 33 total LITT cases, 30.3% underwent cranial radiation therapy (n = 8 stereotactic radiosurgery, n = 2 whole-brain radiation therapy) to the lesion due to local progression. The median PFS for the treatment cohort (n = 33) was 137 days from LITT (range, 33–497 days) (Fig 2). Three of the 27 patients (11.1%) were deceased by last follow-up. No post-LITT hemorrhage was observed in any patients during follow-up.
Demographics and clinical features

The Kaplan-Meier curve of progression-free survival for all LITT cases (n = 33).
PFS Correlation with iAUC60 and ΔiAUC60 from DCE-MR Imaging
Figure 3 compares immediate postoperative DCE-MRIs from 2 patients, 1 with a short PFS (local recurrence observed 86 days from LITT) and 1 with good local control (no local recurrence observed at 329 days from LITT). Preoperative DCE-MR images were available for all 27 patients (n = 33 cases of LITT), though only 15 cases were non-censored for correlation analysis. Postoperative DCE-MRIs were only available for 17 (n = 20 cases) patients because these were not included in the original protocol, with only 11 cases non-censored for correlation analysis. Furthermore, 1-month follow-up DCE-MR images were available for only 21 patients (n = 25 cases) because of loss to follow-up, with 20 noncensored cases available for correlation analysis. No significant linear relationship was observed between preoperative DCE-MR imaging iAUC60 and PFS (r = 0.06, n = 15, P = .82; 95% CI, −0.46–0.56). However, a significant relationship was calculated between iAUC60 from postoperative DCE-MR imaging and PFS (r = −0.64, n = 11, P = .03; 95% CI, −0.90 to −0.07) (Fig 4A). A nonsignificant relationship was observed between iAUC60 from DCE-MR imaging at 1-month follow-up and PFS (r = 0.01, n = 20, P = .96; 95% CI, −0.46–0.48); however, a clear iAUC60 outlier value can be seen on the plot. With this outlier removed, the relationship between DCE-MR imaging at 1-month follow-up and PFS was significant (r = −0.46, n = 19, P = .05; 95% CI, −0.75 to −0.01) (Fig 4B). Analysis of ΔiAUC60 between pre- and immediate postoperative DCE-MR imaging yielded no significant relationship (r = 0.28, n = 11, P = .40; 95% CI, −0.38–0.76). Furthermore, no significant relationship was observed with the ΔiAUC60 values between postoperative imaging and DCE-MR imaging at 1-month follow-up (r = −0.10, n = 10, P = .78; 95% CI, −0.69–0.56) (Fig 4C).

Immediate postoperative T1-weighted postcontrast MRIs showing a region of T1 hyperintensity (white arrows) consistent with treatment change within the ablation zone in a patient with a short PFS (86 days from LITT, iAUC60 = 1.81) (A) and good long-term control (no recurrence 329 days from LITT, iAUC60 = 1.29) (B). This patient illustrates that T1-weighted postcontrast MR imaging is not sufficient for distinguishing completely ablated lesions versus partially ablated lesions shortly after thermal ablation and supports the need for DCE-MR imaging in this setting.

Scatterplot with the line of best fit for iAUC60 values from postoperative DCE-MR imaging (r = −0.64, P = .03) (A) and DCE-MR imaging at 1-month follow-up with the line of best fit drawn with the outlier (marked by x) excluded (r = −0.46, P = .05) (B). The correlation of PFS and ΔiAUC60 between postoperative and 1-month follow-up DCE-MR imaging is also shown (r = −0.10, P = .78) (C).
When treated as a continuous variable, iAUC60 was not found to be a significant predictor of PFS from preoperative (P = .27, HR = 0.66; 95% CI, 0.31–1.37) and 1-month follow-up (P = .27, HR = 0.4; 95% CI, 0.13–1.75) DCE-MR images on Cox univariate analysis. Similarly, ΔiAUC60 between postoperative and 1-month follow-up DCE-MR imaging was not associated with PFS (P = .65, HR = 1.45; 95% CI, 0.30–7.06). However, iAUC60 from postoperative DCE-MR imaging was found to be a significant predictor of PFS on Cox univariate analysis (P = .01, HR = 70.99; 95% CI, 2.9–1738.00).
An ROC curve was constructed to assess the ability of iAUC60 from statistically significant imaging time points (postoperative DCE-MR imaging) to predict 6-month local recurrence status. The area under the ROC curve was calculated as 0.82. The optimal iAUC60 value cutoff based on the Youden Index was 1.43. The sensitivity and specificity were 0.75 (95% CI, 0.50–1.00) and 1.00 (95% CI, 43–1.00), respectively. The confusion matrix resulting from this ROC analysis can be seen in Table 2.
Confusion matrix of ROC analysis of postoperative DCE-MRI iAUC60 values
Discussion
The results of this study suggest a relationship between the iAUC60 from DCE-MR imaging and PFS. The association was strongest with iAUC60 from imaging obtained immediately post-LITT and establishes a methodology by which subsequent prognostic techniques can be based. Local tissue inflammation, edema, and increased vascular permeability are known characteristics of a local treatment-related response following radiation therapy.24 Although less well-described in patients undergoing LITT, ambiguous contrast enhancement in the postoperative period until follow-up has similarly been known to mimic residual tumor.25 The increased vascular permeability underlying these posttreatment changes is often indistinguishable from tumor recurrence on conventional brain MR imaging, creating a diagnostic and management conundrum in patients with persistent enhancement following definitive brain tumor management. On the basis of clinical DCE-MR imaging applications, we hypothesized that higher iAUC60 values would indicate shorter time to local recurrence due to a unique profile of contrast enhancement in tumor tissue and associated vasculature. The inverse linear relationship seen when plotting postoperative DCE-MR imaging iAUC60 values against associated PFS would appear to be consistent with this hypothesis.
Because of early postoperative changes confounding signal intensity, we originally theorized that persistently high iAUC60 values after 1 month would consequently be more predictive of eminent disease progression because an underlying posttreatment effect would be less robust. A significant correlation was observed between DCE-MR imaging at 1-month follow-up and PFS, but only after removal of a clear statistical outlier, presenting a potentially confounding variable in this relationship. The iAUC60 value for this patient was well above the value of any other in the cohort and may represent some inter-image variability in extracted iAUC60 values. Interestingly, no relationship was observed between immediately post-LITT and 1-month follow-up DCE-MR imaging, indicating that another process may be confounding these parameters. Despite these findings, the negative correlation between postoperative and follow-up DCE-MR imaging and iAUC60 values would appear to correspond to current evidence suggesting that the extent of ablation predicts PFS in patients with brain metastases.26 Conversely, the weak relationship between the preoperative iAUC60 and PFS as well as the ΔiAUC60 between pre- and postoperative DCE-MR imaging is to be expected because the extent of ablation is not taken into account in the preoperative image.
The unique ability to observe vascular changes in tissue has led to the establishment of DCE-MR imaging as a noninvasive method for analyzing blood flow and vessel permeability in ROIs.6 Within the field of neuro-oncology, quantification of vascular parameters with DCE-MR imaging has found numerous clinical applications in tumor characterization and diagnosis.27⇓–29 Specifically, a number of studies have successfully used DCE-MR imaging to differentiate radiation necrosis (RN) and tumor recurrence.27,30⇓⇓⇓–34 The authors of these studies often used quantitative parameters such as volume transfer constant, fractional extravascular extracellular space volume (ve), reflux rate (kep), and fractional plasma volume (vp) to contrast the difference in vasculature between RN and recurrence. Like posttreatment changes, RN presents as persistent enhancement on imaging that can obscure a diagnosis of recurrence on follow-up imaging. However, RN presents a more intuitive application of DCE-MR imaging because there is a stark, quantifiable contrast in the density of vasculature in the 2 disease processes.7
Our study applies DCE-MR imaging in the assessment of tumor recurrence from post-LITT treatment change using a simple quantitative parameter (iAUC60) that is easier to extract than the aforementioned variables. Specifically, iAUC60 has been established as an effective and reproducible measure of tissue perfusion that is easier to calculate than other quantifiable parameters requiring complex model-fitting and additional data on arterial concentration and/or the exchange of contrast between the plasma and extracellular space.6,35 Posttreatment change following LITT is a discrete physiologic entity from RN following radiation therapy; the zone of necrosis within the ablation cavity transforms into granulation tissue and ultimately a ring of reactive gliosis with necrotic debris.36 Tissue ablation also has distinct subsequent vascular effects because preservation of the general vascular structure with a potential breakdown in the blood-brain barrier can be observed, similar to known tumoral effects.37,38 Because this local tissue reaction to LITT ablation undergoes an angiogenic process similar to that of a recurrent tumor, the application of DCE-MR imaging in this scenario is less straightforward. Nevertheless, our findings suggest some utility in determining early tumor recurrence in these patients, though these results should be confirmed in larger comparative studies investigating additional DCE-MR imaging quantitative parameters (eg, histogram analysis).
Limitations
Although this study benefits from prospective data collection, it is limited by a small sample size. Additionally, a number of subjects were lost to follow-up, and tumor progression was subsequently not observed, further reducing the number of noncensored cases, particularly for the postoperative DCE-MR imaging cohort (n = 11). Furthermore, some patients were counted twice in the analysis if both metastatic lesions were treated with LITT. Although this can introduce some confounding in outcome, the separate LITT treatments for different intracranial metastases can be considered discrete samples because they do not affect the associated iAUC60 and PFS. Furthermore, the second outcome was censored due to the short follow-up for the patient who received LITT twice for the same lesion and was thus not considered in the statistical analysis.
The methodology by which we attained the iAUC60 may also limit the ability of this parameter to predict PFS and differentiate between posttreatment changes and progression. By simply masking the entire ROI on the DCE-MR imaging, the associated iAUC60 can be obscured by variables unique to each patient. For example, a larger tumor area with a smaller region of residual tumor with greater enhancement would have a lower total iAUC60 value than a smaller ROI covering posttreatment changes with homogeneous-but-moderate enhancement. Thus, to establish a role for DCE-MR imaging in predicting tumor recurrence post-LITT, larger studies that assess each patient as a discrete sample and compare various methodologies of iAUC60 extraction are needed. Furthermore, hemorrhage is an observed phenomenon following LITT ablation that presents as regional enhancement within the ablation cavity.39 The efficacy of iAUC60 in differentiating true recurrence from hemorrhagic enhancement was not measured because this complication was not observed in our cohort. Despite these limitations, this pilot study is the first of its kind to demonstrate a significant relationship between PFS and the iAUC60 values from immediately postoperative DCE-MRIs and paves the way for additional studies to investigate these methods in predicting local recurrence in patients undergoing LITT for brain metastases.
Conclusions
Predicting PFS in patients undergoing LITT for brain metastases presents a dilemma in prognosis and subsequent management. iAUC60 from DCE-MR imaging is a potential quantifiable parameter for PFS prediction in these patients and can guide subsequent treatment. However, additional studies are warranted to compare iAUC60 values from DCE-MR imaging with those from other advanced MR imaging sequences before this technique can be validated for predicting time to local tumor recurrence.
Footnotes
Disclosures: Jeffrey I. Traylor—RELATED: Grant: Monteris Medical.* *Money paid to the institution.
This work was supported, in part, by Monteris Medical.
The funder had no role in study design, data interpretation, or analysis, or manuscript preparation.
REFERENCES
- Received April 22, 2019.
- Accepted after revision June 19, 2019.
- © 2019 by American Journal of Neuroradiology


Jump to section
Related Articles
Cited By...
- No citing articles found.